Oak City, UT Map & Demographics
Oak City Map
Oak City Overview
$28,561
PER CAPITA INCOME
$69,081
AVG FAMILY INCOME
$69,075
AVG HOUSEHOLD INCOME
0.27
INEQUALITY / GINI INDEX
795
TOTAL POPULATION
407
MALE POPULATION
388
FEMALE POPULATION
104.90
MALES / 100 FEMALES
95.33
FEMALES / 100 MALES
43.7
MEDIAN AGE
3.2
AVG FAMILY SIZE
3.0
AVG HOUSEHOLD SIZE
302
LABOR FORCE [ PEOPLE ]
49.7%
PERCENT IN LABOR FORCE
1.7%
UNEMPLOYMENT RATE
Oak City Zip Codes
Oak City Area Codes
Income in Oak City
Income Overview in Oak City
Per Capita Income in Oak City is $28,561, while median incomes of families and households are $69,081 and $69,075 respectively.
| Characteristic | Number | Measure |
| Per Capita Income | 795 | $28,561 |
| Median Family Income | 234 | $69,081 |
| Mean Family Income | 234 | $80,917 |
| Median Household Income | 266 | $69,075 |
| Mean Household Income | 266 | $79,638 |
| Income Deficit | 234 | $0 |
| Wage / Income Gap (%) | 795 | 0.00% |
| Wage / Income Gap ($) | 795 | 100.00¢ per $1 |
| Gini / Inequality Index | 795 | 0.27 |
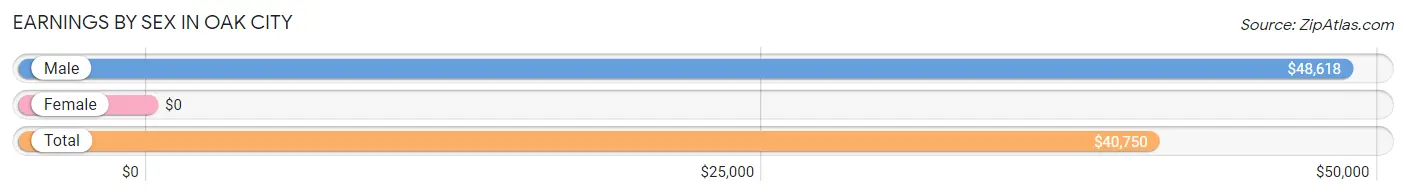
Earnings by Sex in Oak City
| Sex | Number | Average Earnings |
| Male | 175 (54.2%) | $48,618 |
| Female | 148 (45.8%) | $0 |
| Total | 323 (100.0%) | $40,750 |
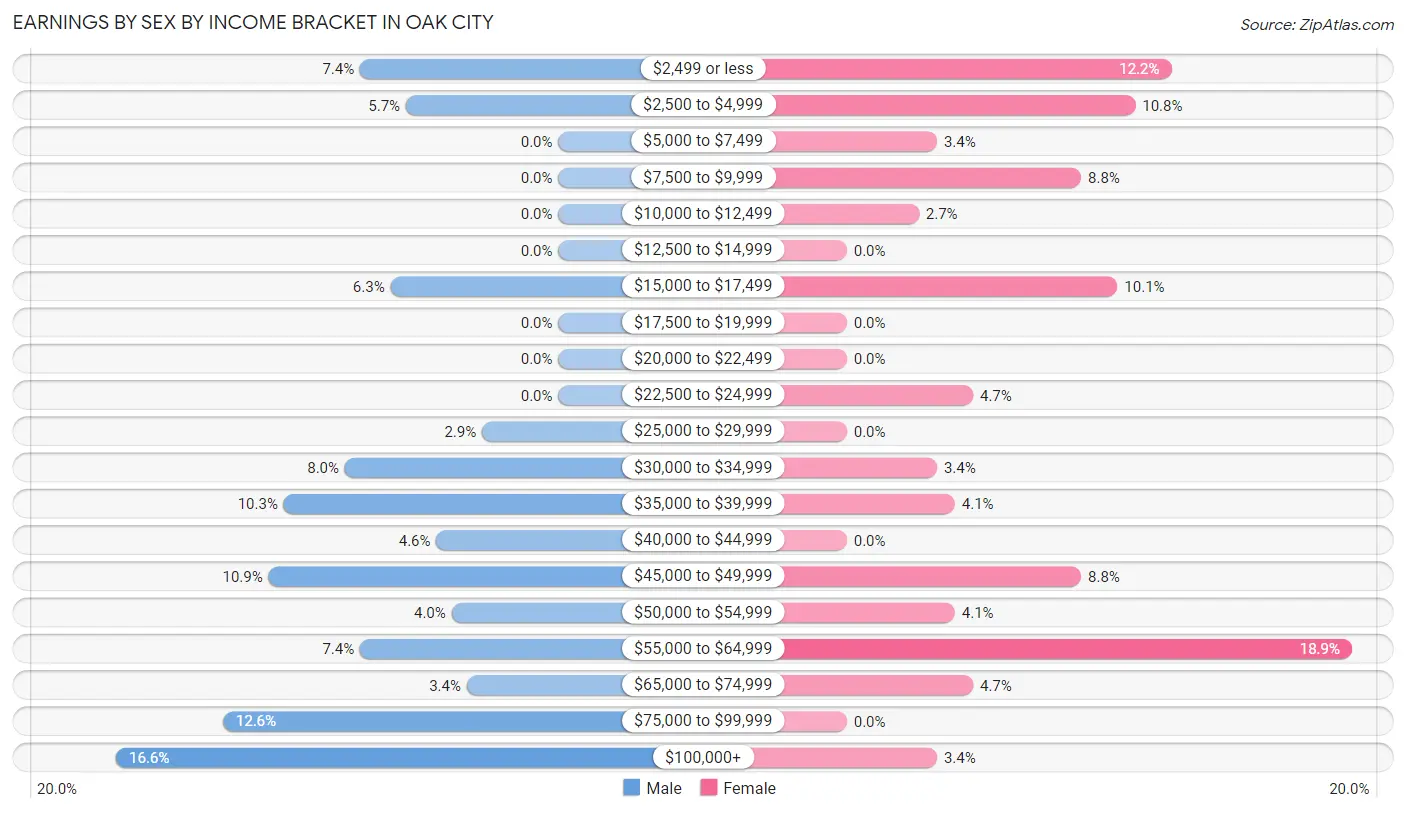
Earnings by Sex by Income Bracket in Oak City
The most common earnings brackets in Oak City are $100,000+ for men (29 | 16.6%) and $55,000 to $64,999 for women (28 | 18.9%).
| Income | Male | Female |
| $2,499 or less | 13 (7.4%) | 18 (12.2%) |
| $2,500 to $4,999 | 10 (5.7%) | 16 (10.8%) |
| $5,000 to $7,499 | 0 (0.0%) | 5 (3.4%) |
| $7,500 to $9,999 | 0 (0.0%) | 13 (8.8%) |
| $10,000 to $12,499 | 0 (0.0%) | 4 (2.7%) |
| $12,500 to $14,999 | 0 (0.0%) | 0 (0.0%) |
| $15,000 to $17,499 | 11 (6.3%) | 15 (10.1%) |
| $17,500 to $19,999 | 0 (0.0%) | 0 (0.0%) |
| $20,000 to $22,499 | 0 (0.0%) | 0 (0.0%) |
| $22,500 to $24,999 | 0 (0.0%) | 7 (4.7%) |
| $25,000 to $29,999 | 5 (2.9%) | 0 (0.0%) |
| $30,000 to $34,999 | 14 (8.0%) | 5 (3.4%) |
| $35,000 to $39,999 | 18 (10.3%) | 6 (4.1%) |
| $40,000 to $44,999 | 8 (4.6%) | 0 (0.0%) |
| $45,000 to $49,999 | 19 (10.9%) | 13 (8.8%) |
| $50,000 to $54,999 | 7 (4.0%) | 6 (4.1%) |
| $55,000 to $64,999 | 13 (7.4%) | 28 (18.9%) |
| $65,000 to $74,999 | 6 (3.4%) | 7 (4.7%) |
| $75,000 to $99,999 | 22 (12.6%) | 0 (0.0%) |
| $100,000+ | 29 (16.6%) | 5 (3.4%) |
| Total | 175 (100.0%) | 148 (100.0%) |
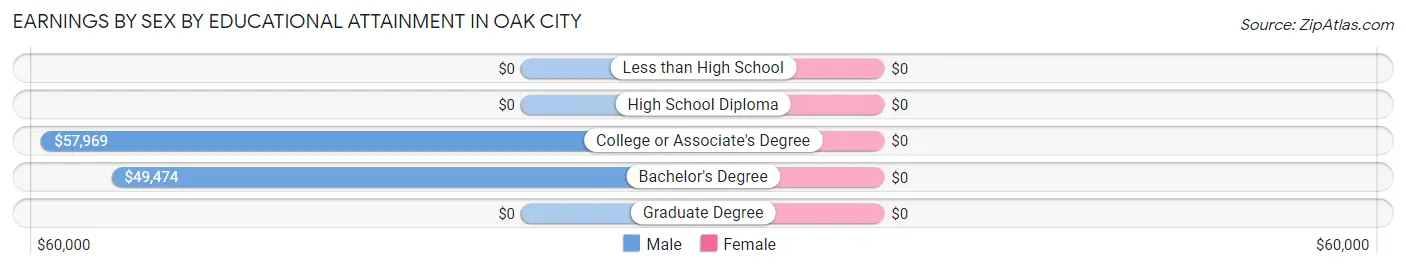
Earnings by Sex by Educational Attainment in Oak City
| Educational Attainment | Male Income | Female Income |
| Less than High School | - | - |
| High School Diploma | - | - |
| College or Associate's Degree | $57,969 | $0 |
| Bachelor's Degree | $49,474 | $0 |
| Graduate Degree | - | - |
| Total | $49,934 | $37,917 |
Family Income in Oak City
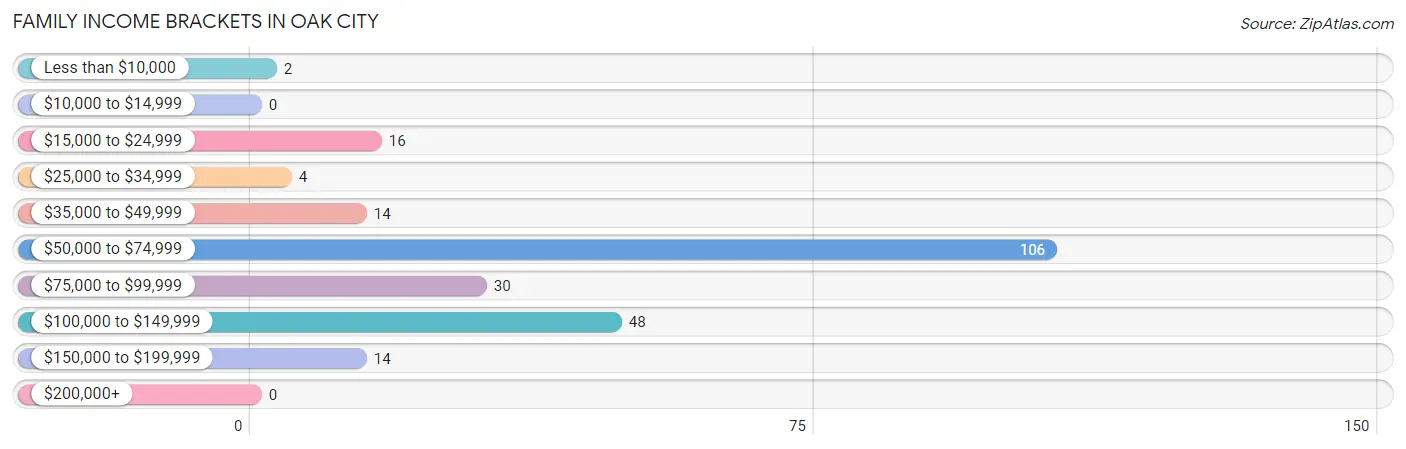
Family Income Brackets in Oak City
According to the Oak City family income data, there are 106 families falling into the $50,000 to $74,999 income range, which is the most common income bracket and makes up 45.3% of all families.
| Income Bracket | # Families | % Families |
| Less than $10,000 | 2 | 0.9% |
| $10,000 to $14,999 | 0 | 0.0% |
| $15,000 to $24,999 | 16 | 6.8% |
| $25,000 to $34,999 | 4 | 1.7% |
| $35,000 to $49,999 | 14 | 6.0% |
| $50,000 to $74,999 | 106 | 45.3% |
| $75,000 to $99,999 | 30 | 12.8% |
| $100,000 to $149,999 | 48 | 20.5% |
| $150,000 to $199,999 | 14 | 6.0% |
| $200,000+ | 0 | 0.0% |
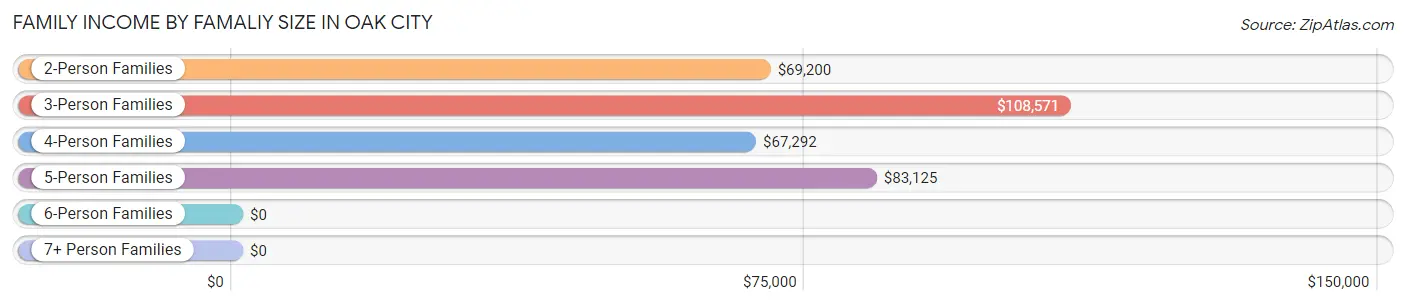
Family Income by Famaliy Size in Oak City
3-person families (16 | 6.8%) account for the highest median family income in Oak City with $108,571 per family, while 3-person families (16 | 6.8%) have the highest median income of $36,190 per family member.
| Income Bracket | # Families | Median Income |
| 2-Person Families | 144 (61.5%) | $69,200 |
| 3-Person Families | 16 (6.8%) | $108,571 |
| 4-Person Families | 41 (17.5%) | $67,292 |
| 5-Person Families | 16 (6.8%) | $83,125 |
| 6-Person Families | 11 (4.7%) | $0 |
| 7+ Person Families | 6 (2.6%) | $0 |
| Total | 234 (100.0%) | $69,081 |
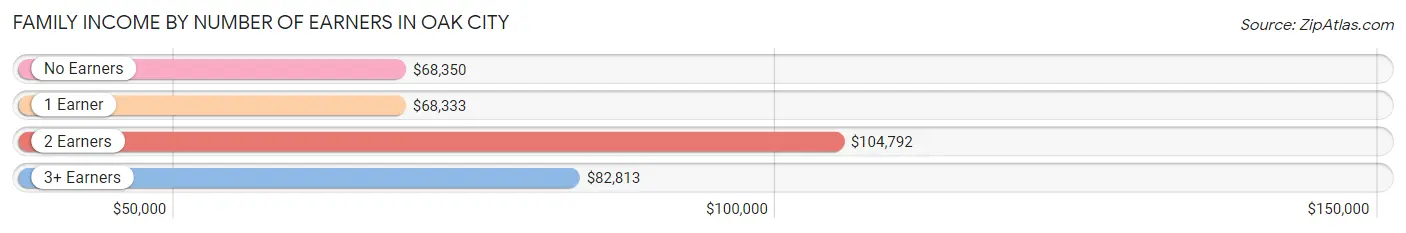
Family Income by Number of Earners in Oak City
The median family income in Oak City is $69,081, with families comprising 2 earners (57) having the highest median family income of $104,792, while families with 1 earner (92) have the lowest median family income of $68,333, accounting for 24.4% and 39.3% of families, respectively.
| Number of Earners | # Families | Median Income |
| No Earners | 66 (28.2%) | $68,350 |
| 1 Earner | 92 (39.3%) | $68,333 |
| 2 Earners | 57 (24.4%) | $104,792 |
| 3+ Earners | 19 (8.1%) | $82,813 |
| Total | 234 (100.0%) | $69,081 |
Household Income in Oak City
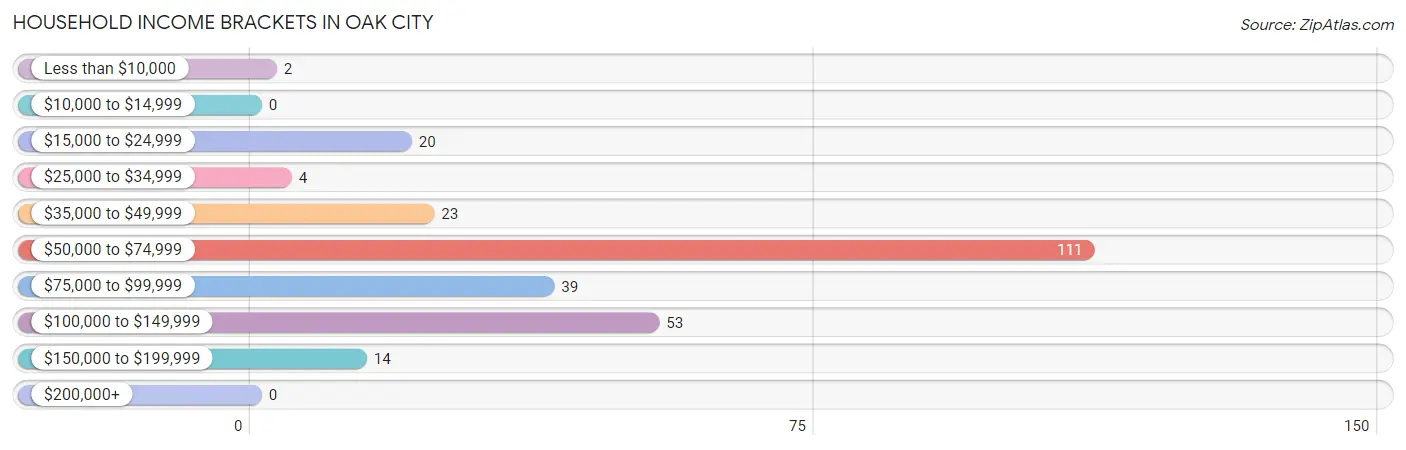
Household Income Brackets in Oak City
With 111 households falling in the category, the $50,000 to $74,999 income range is the most frequent in Oak City, accounting for 41.7% of all households.
| Income Bracket | # Households | % Households |
| Less than $10,000 | 2 | 0.8% |
| $10,000 to $14,999 | 0 | 0.0% |
| $15,000 to $24,999 | 20 | 7.5% |
| $25,000 to $34,999 | 4 | 1.5% |
| $35,000 to $49,999 | 23 | 8.6% |
| $50,000 to $74,999 | 111 | 41.7% |
| $75,000 to $99,999 | 39 | 14.7% |
| $100,000 to $149,999 | 53 | 19.9% |
| $150,000 to $199,999 | 14 | 5.3% |
| $200,000+ | 0 | 0.0% |
Household Income by Householder Age in Oak City
The median household income in Oak City is $69,075, with the highest median household income of $99,659 found in the 45 to 64 years age bracket for the primary householder. A total of 85 households (32.0%) fall into this category.
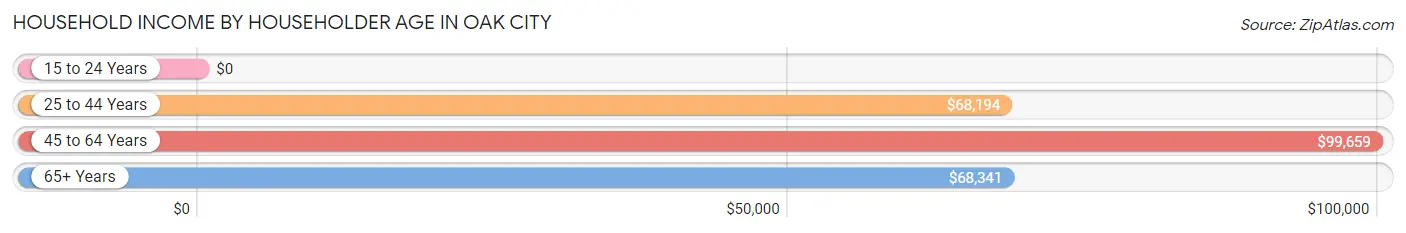
| Income Bracket | # Households | Median Income |
| 15 to 24 Years | 0 (0.0%) | $0 |
| 25 to 44 Years | 76 (28.6%) | $68,194 |
| 45 to 64 Years | 85 (32.0%) | $99,659 |
| 65+ Years | 105 (39.5%) | $68,341 |
| Total | 266 (100.0%) | $69,075 |
Poverty in Oak City
Income Below Poverty by Sex and Age in Oak City
With 3.7% poverty level for males and 4.1% for females among the residents of Oak City, 15 year old males and 15 year old females are the most vulnerable to poverty, with 2 males (100.0%) and 3 females (37.5%) in their respective age groups living below the poverty level.
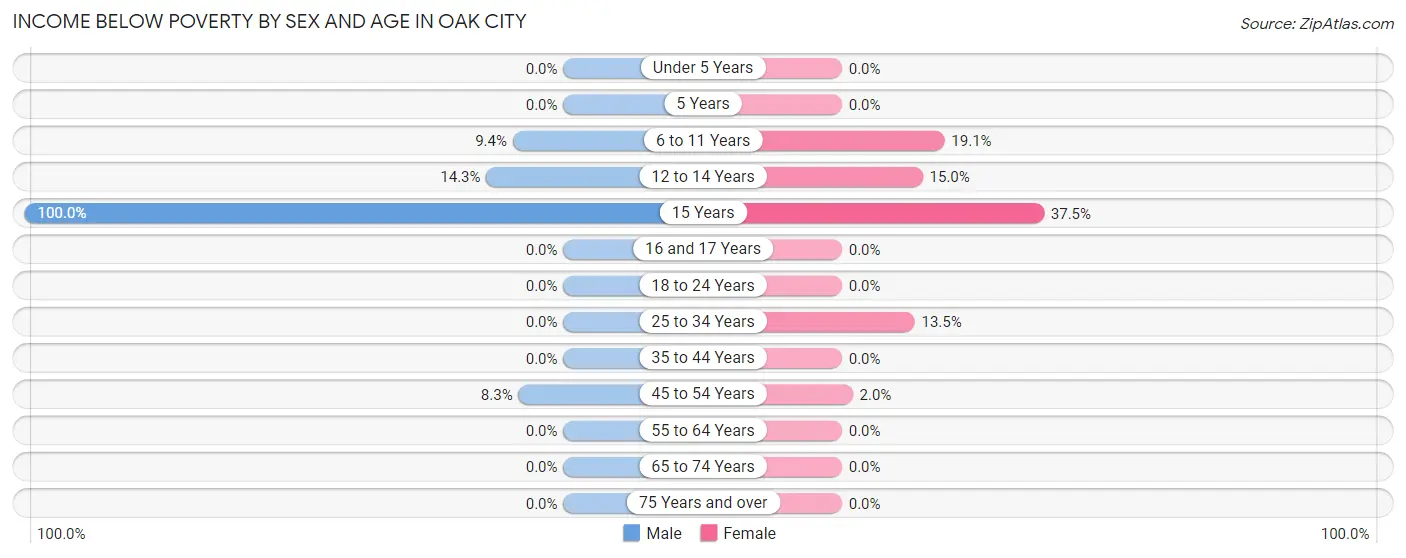
| Age Bracket | Male | Female |
| Under 5 Years | 0 (0.0%) | 0 (0.0%) |
| 5 Years | 0 (0.0%) | 0 (0.0%) |
| 6 to 11 Years | 6 (9.4%) | 4 (19.1%) |
| 12 to 14 Years | 5 (14.3%) | 3 (15.0%) |
| 15 Years | 2 (100.0%) | 3 (37.5%) |
| 16 and 17 Years | 0 (0.0%) | 0 (0.0%) |
| 18 to 24 Years | 0 (0.0%) | 0 (0.0%) |
| 25 to 34 Years | 0 (0.0%) | 5 (13.5%) |
| 35 to 44 Years | 0 (0.0%) | 0 (0.0%) |
| 45 to 54 Years | 2 (8.3%) | 1 (2.0%) |
| 55 to 64 Years | 0 (0.0%) | 0 (0.0%) |
| 65 to 74 Years | 0 (0.0%) | 0 (0.0%) |
| 75 Years and over | 0 (0.0%) | 0 (0.0%) |
| Total | 15 (3.7%) | 16 (4.1%) |
Income Above Poverty by Sex and Age in Oak City
According to the poverty statistics in Oak City, males aged under 5 years and females aged under 5 years are the age groups that are most secure financially, with 100.0% of males and 100.0% of females in these age groups living above the poverty line.
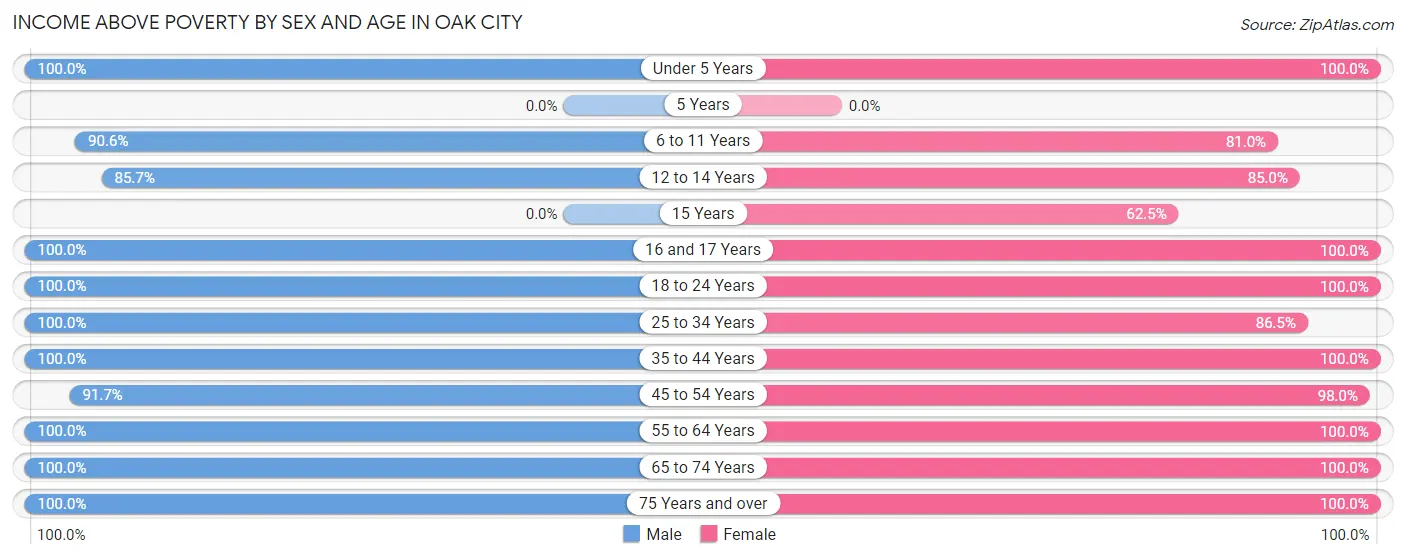
| Age Bracket | Male | Female |
| Under 5 Years | 2 (100.0%) | 35 (100.0%) |
| 5 Years | 0 (0.0%) | 0 (0.0%) |
| 6 to 11 Years | 58 (90.6%) | 17 (80.9%) |
| 12 to 14 Years | 30 (85.7%) | 17 (85.0%) |
| 15 Years | 0 (0.0%) | 5 (62.5%) |
| 16 and 17 Years | 4 (100.0%) | 14 (100.0%) |
| 18 to 24 Years | 20 (100.0%) | 6 (100.0%) |
| 25 to 34 Years | 59 (100.0%) | 32 (86.5%) |
| 35 to 44 Years | 45 (100.0%) | 34 (100.0%) |
| 45 to 54 Years | 22 (91.7%) | 49 (98.0%) |
| 55 to 64 Years | 50 (100.0%) | 47 (100.0%) |
| 65 to 74 Years | 72 (100.0%) | 78 (100.0%) |
| 75 Years and over | 30 (100.0%) | 38 (100.0%) |
| Total | 392 (96.3%) | 372 (95.9%) |
Income Below Poverty Among Married-Couple Families in Oak City
The poverty statistics for married-couple families in Oak City show that 1.0% or 2 of the total 202 families live below the poverty line. Families with 3 or 4 children have the highest poverty rate of 8.3%, comprising of 2 families. On the other hand, families with no children have the lowest poverty rate of 0.0%, which includes 0 families.
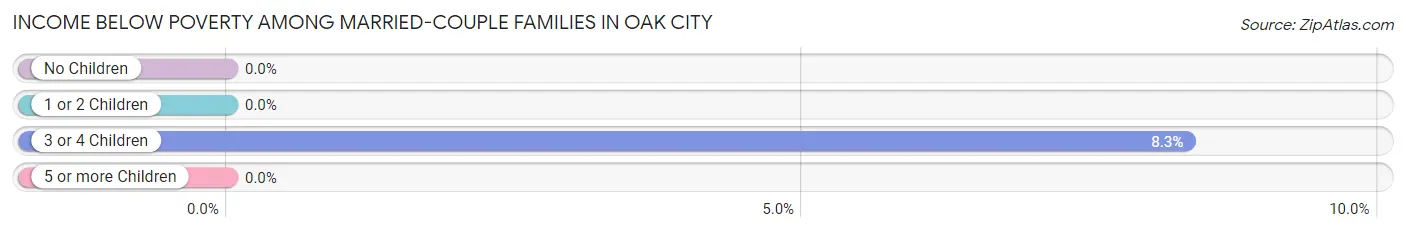
| Children | Above Poverty | Below Poverty |
| No Children | 135 (100.0%) | 0 (0.0%) |
| 1 or 2 Children | 37 (100.0%) | 0 (0.0%) |
| 3 or 4 Children | 22 (91.7%) | 2 (8.3%) |
| 5 or more Children | 6 (100.0%) | 0 (0.0%) |
| Total | 200 (99.0%) | 2 (1.0%) |
Income Below Poverty Among Single-Parent Households in Oak City
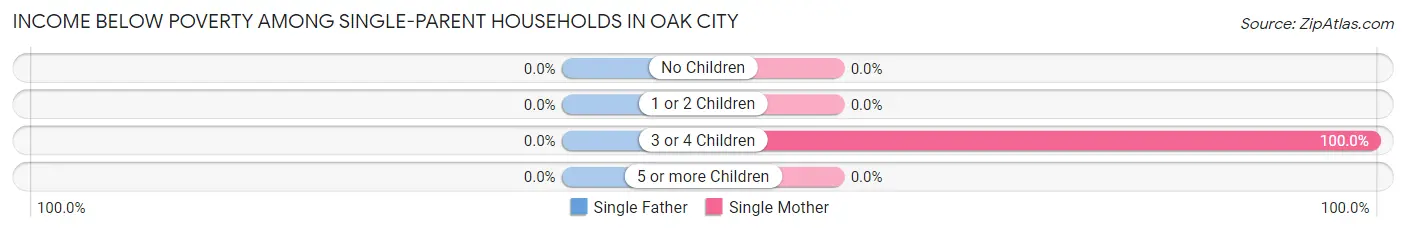
| Children | Single Father | Single Mother |
| No Children | 0 (0.0%) | 0 (0.0%) |
| 1 or 2 Children | 0 (0.0%) | 0 (0.0%) |
| 3 or 4 Children | 0 (0.0%) | 5 (100.0%) |
| 5 or more Children | 0 (0.0%) | 0 (0.0%) |
| Total | 0 (0.0%) | 5 (15.6%) |
Income Below Poverty Among Married-Couple vs Single-Parent Households in Oak City
The poverty data for Oak City shows that 2 of the married-couple family households (1.0%) and 5 of the single-parent households (15.6%) are living below the poverty level. Within the married-couple family households, those with 3 or 4 children have the highest poverty rate, with 2 households (8.3%) falling below the poverty line. Among the single-parent households, those with 3 or 4 children have the highest poverty rate, with 5 household (100.0%) living below poverty.
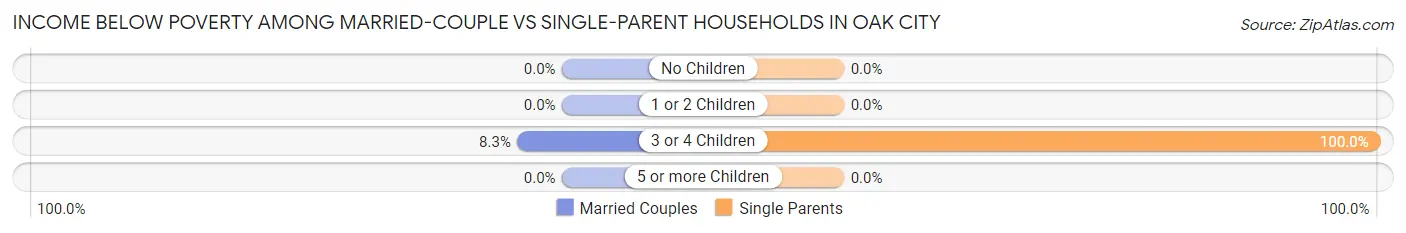
| Children | Married-Couple Families | Single-Parent Households |
| No Children | 0 (0.0%) | 0 (0.0%) |
| 1 or 2 Children | 0 (0.0%) | 0 (0.0%) |
| 3 or 4 Children | 2 (8.3%) | 5 (100.0%) |
| 5 or more Children | 0 (0.0%) | 0 (0.0%) |
| Total | 2 (1.0%) | 5 (15.6%) |
Race in Oak City
The most populous races in Oak City are White / Caucasian (746 | 93.8%), Hispanic or Latino (40 | 5.0%), and Some other Race (28 | 3.5%).
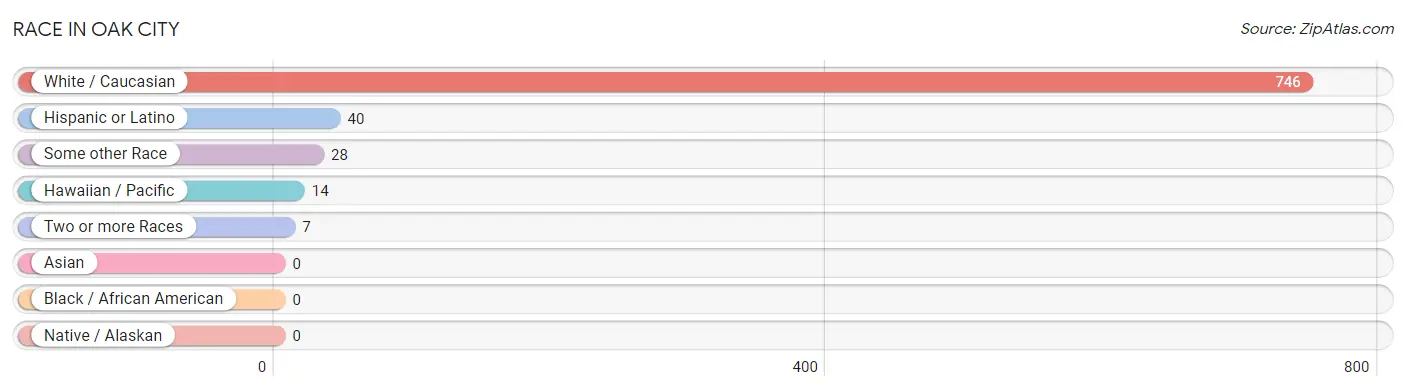
| Race | # Population | % Population |
| Asian | 0 | 0.0% |
| Black / African American | 0 | 0.0% |
| Hawaiian / Pacific | 14 | 1.8% |
| Hispanic or Latino | 40 | 5.0% |
| Native / Alaskan | 0 | 0.0% |
| White / Caucasian | 746 | 93.8% |
| Two or more Races | 7 | 0.9% |
| Some other Race | 28 | 3.5% |
| Total | 795 | 100.0% |
Ancestry in Oak City
The most populous ancestries reported in Oak City are English (574 | 72.2%), Danish (138 | 17.4%), Canadian (44 | 5.5%), Mexican (33 | 4.2%), and Welsh (25 | 3.1%), together accounting for 102.4% of all Oak City residents.
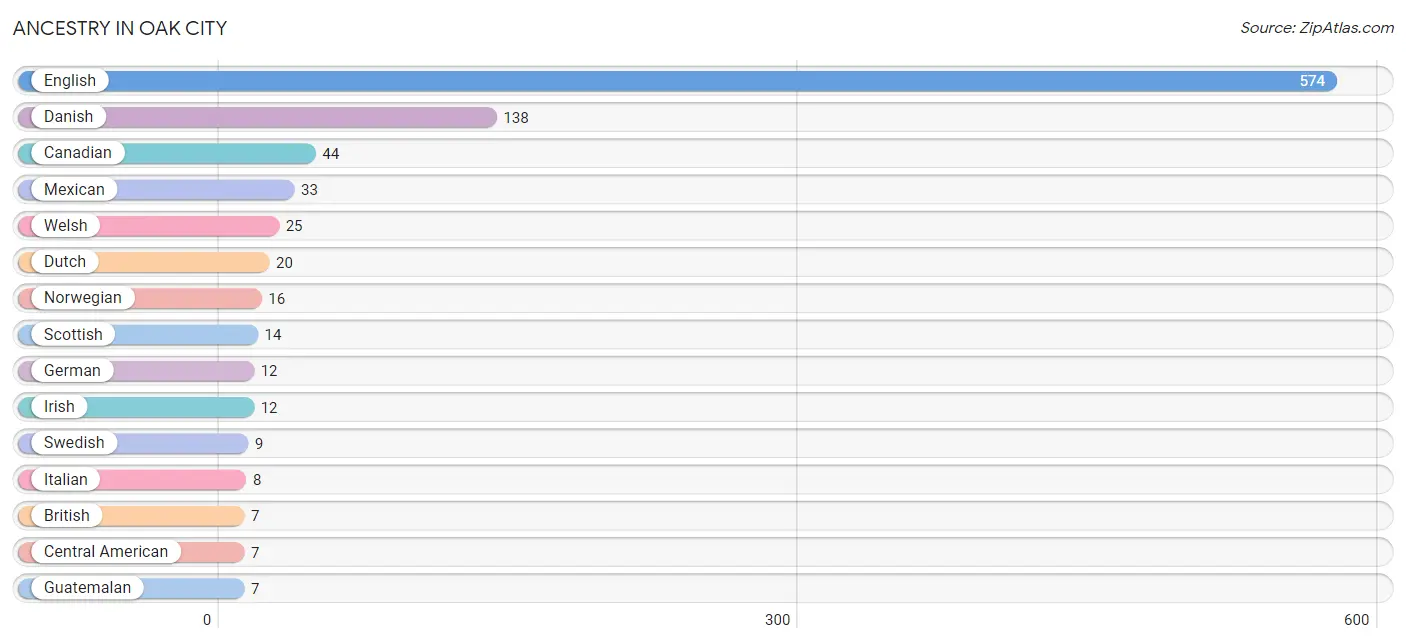
| Ancestry | # Population | % Population |
| British | 7 | 0.9% |
| Canadian | 44 | 5.5% |
| Central American | 7 | 0.9% |
| Danish | 138 | 17.4% |
| Dutch | 20 | 2.5% |
| English | 574 | 72.2% |
| European | 5 | 0.6% |
| French | 4 | 0.5% |
| German | 12 | 1.5% |
| Guatemalan | 7 | 0.9% |
| Irish | 12 | 1.5% |
| Italian | 8 | 1.0% |
| Mexican | 33 | 4.2% |
| Norwegian | 16 | 2.0% |
| Scottish | 14 | 1.8% |
| Swedish | 9 | 1.1% |
| Swiss | 6 | 0.7% |
| Welsh | 25 | 3.1% | View All 18 Rows |
Immigrants in Oak City
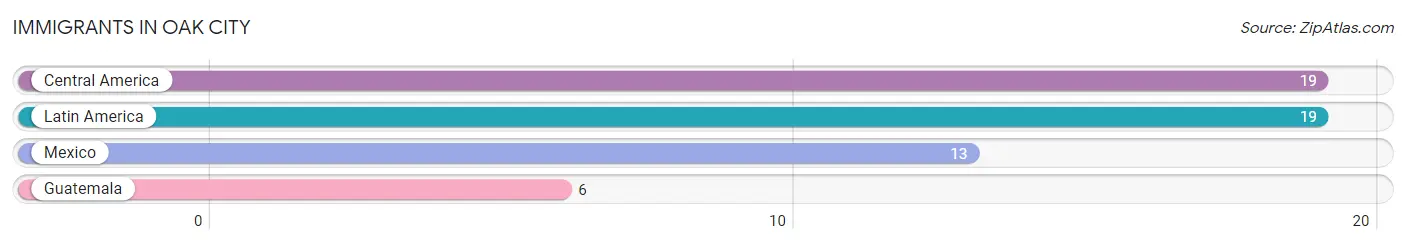
The most numerous immigrant groups reported in Oak City came from Central America (19 | 2.4%), Latin America (19 | 2.4%), Mexico (13 | 1.6%), and Guatemala (6 | 0.7%), together accounting for 7.2% of all Oak City residents.
| Immigration Origin | # Population | % Population |
| Central America | 19 | 2.4% |
| Guatemala | 6 | 0.7% |
| Latin America | 19 | 2.4% |
| Mexico | 13 | 1.6% | View All 4 Rows |
Sex and Age in Oak City
Sex and Age in Oak City
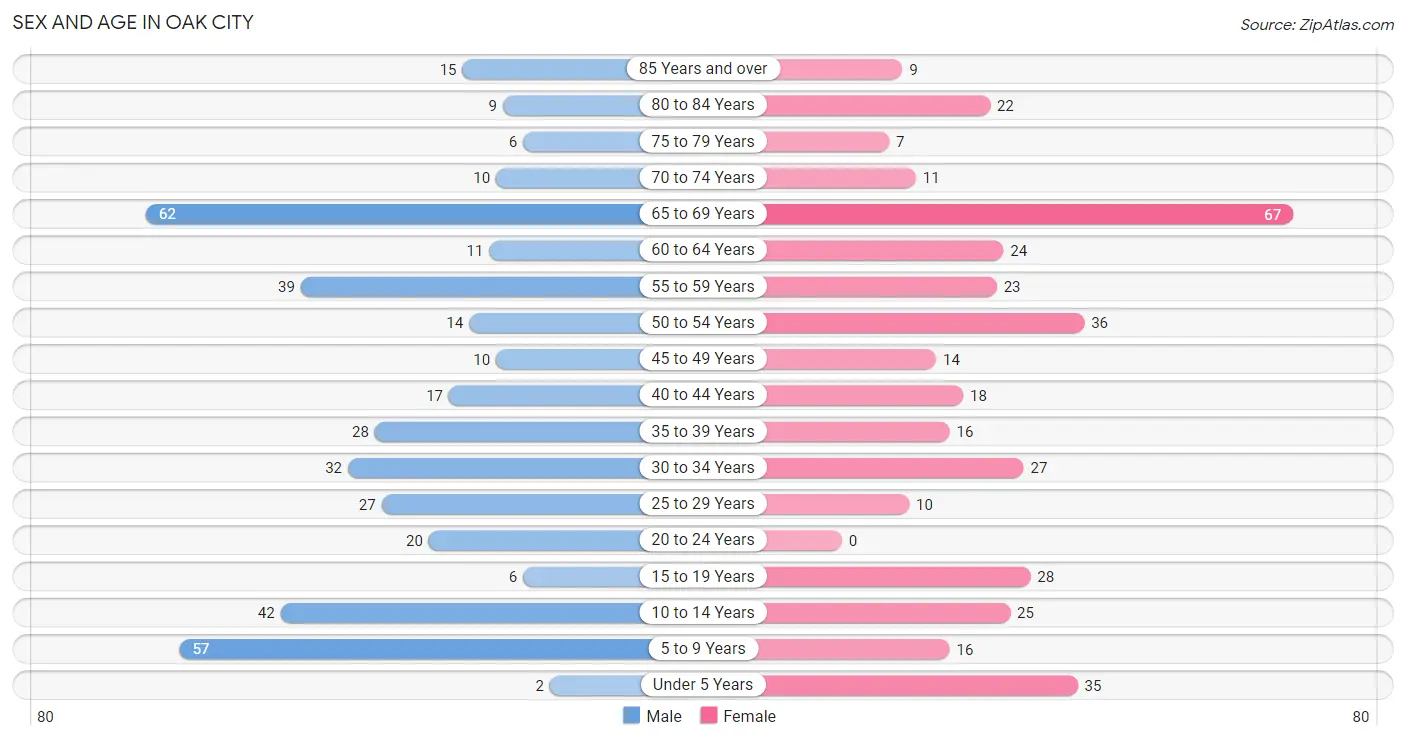
The most populous age groups in Oak City are 65 to 69 Years (62 | 15.2%) for men and 65 to 69 Years (67 | 17.3%) for women.
| Age Bracket | Male | Female |
| Under 5 Years | 2 (0.5%) | 35 (9.0%) |
| 5 to 9 Years | 57 (14.0%) | 16 (4.1%) |
| 10 to 14 Years | 42 (10.3%) | 25 (6.4%) |
| 15 to 19 Years | 6 (1.5%) | 28 (7.2%) |
| 20 to 24 Years | 20 (4.9%) | 0 (0.0%) |
| 25 to 29 Years | 27 (6.6%) | 10 (2.6%) |
| 30 to 34 Years | 32 (7.9%) | 27 (7.0%) |
| 35 to 39 Years | 28 (6.9%) | 16 (4.1%) |
| 40 to 44 Years | 17 (4.2%) | 18 (4.6%) |
| 45 to 49 Years | 10 (2.5%) | 14 (3.6%) |
| 50 to 54 Years | 14 (3.4%) | 36 (9.3%) |
| 55 to 59 Years | 39 (9.6%) | 23 (5.9%) |
| 60 to 64 Years | 11 (2.7%) | 24 (6.2%) |
| 65 to 69 Years | 62 (15.2%) | 67 (17.3%) |
| 70 to 74 Years | 10 (2.5%) | 11 (2.8%) |
| 75 to 79 Years | 6 (1.5%) | 7 (1.8%) |
| 80 to 84 Years | 9 (2.2%) | 22 (5.7%) |
| 85 Years and over | 15 (3.7%) | 9 (2.3%) |
| Total | 407 (100.0%) | 388 (100.0%) |
Families and Households in Oak City
Median Family Size in Oak City
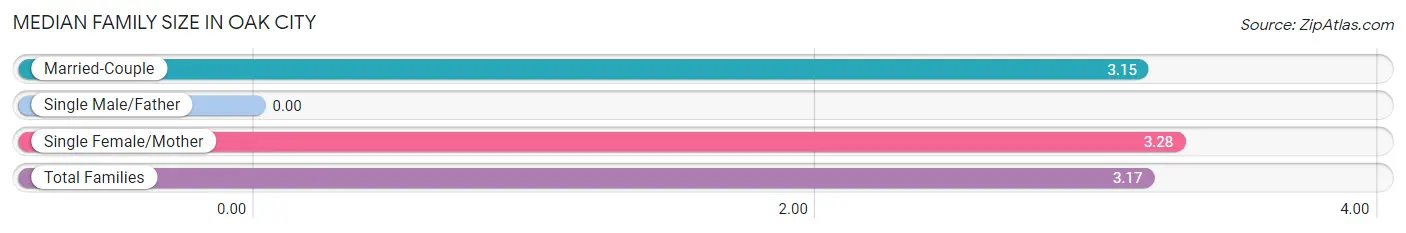
| Family Type | # Families | Family Size |
| Married-Couple | 202 (86.3%) | 3.15 |
| Single Male/Father | 0 (0.0%) | - |
| Single Female/Mother | 32 (13.7%) | 3.28 |
| Total Families | 234 (100.0%) | 3.17 |
Median Household Size in Oak City
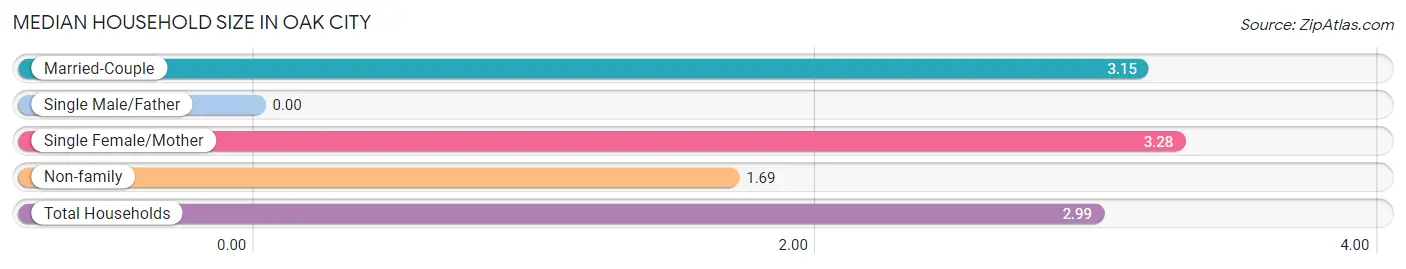
| Household Type | # Households | Household Size |
| Married-Couple | 202 (75.9%) | 3.15 |
| Single Male/Father | 0 (0.0%) | - |
| Single Female/Mother | 32 (12.0%) | 3.28 |
| Non-family | 32 (12.0%) | 1.69 |
| Total Households | 266 (100.0%) | 2.99 |
Household Size by Marriage Status in Oak City
Out of a total of 266 households in Oak City, 234 (88.0%) are family households, while 32 (12.0%) are nonfamily households. The most numerous type of family households are 2-person households, comprising 144, and the most common type of nonfamily households are 1-person households, comprising 27.
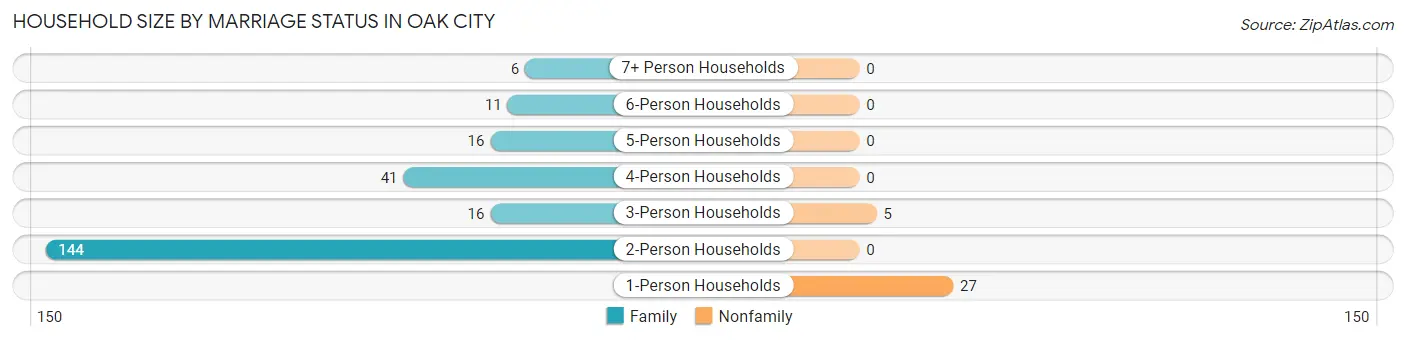
| Household Size | Family Households | Nonfamily Households |
| 1-Person Households | - | 27 (10.2%) |
| 2-Person Households | 144 (54.1%) | 0 (0.0%) |
| 3-Person Households | 16 (6.0%) | 5 (1.9%) |
| 4-Person Households | 41 (15.4%) | 0 (0.0%) |
| 5-Person Households | 16 (6.0%) | 0 (0.0%) |
| 6-Person Households | 11 (4.1%) | 0 (0.0%) |
| 7+ Person Households | 6 (2.3%) | 0 (0.0%) |
| Total | 234 (88.0%) | 32 (12.0%) |
Female Fertility in Oak City
Fertility by Age in Oak City
| Age Bracket | Women with Births | Births / 1,000 Women |
| 15 to 19 years | 0 (0.0%) | 0.0 |
| 20 to 34 years | 0 (0.0%) | 0.0 |
| 35 to 50 years | 0 (0.0%) | 0.0 |
| Total | 0 (0.0%) | 0.0 |
Fertility by Age by Marriage Status in Oak City
| Age Bracket | Married | Unmarried |
| 15 to 19 years | 0 (0.0%) | 0 (0.0%) |
| 20 to 34 years | 0 (0.0%) | 0 (0.0%) |
| 35 to 50 years | 0 (0.0%) | 0 (0.0%) |
| Total | 0 (0.0%) | 0 (0.0%) |
Fertility by Education in Oak City
| Educational Attainment | Women with Births | Births / 1,000 Women |
| Less than High School | 0 (0.0%) | 0.0 |
| High School Diploma | 0 (0.0%) | 0.0 |
| College or Associate's Degree | 0 (0.0%) | 0.0 |
| Bachelor's Degree | 0 (0.0%) | 0.0 |
| Graduate Degree | 0 (0.0%) | 0.0 |
| Total | 0 (0.0%) | 0.0 |
Fertility by Education by Marriage Status in Oak City
| Educational Attainment | Married | Unmarried |
| Less than High School | 0 (0.0%) | 0 (0.0%) |
| High School Diploma | 0 (0.0%) | 0 (0.0%) |
| College or Associate's Degree | 0 (0.0%) | 0 (0.0%) |
| Bachelor's Degree | 0 (0.0%) | 0 (0.0%) |
| Graduate Degree | 0 (0.0%) | 0 (0.0%) |
| Total | 0 (0.0%) | 0 (0.0%) |
Employment Characteristics in Oak City
Employment by Class of Employer in Oak City
Among the 297 employed individuals in Oak City, private company employees (184 | 62.0%), state government employees (36 | 12.1%), and self-employed (not incorporated) (27 | 9.1%) make up the most common classes of employment.
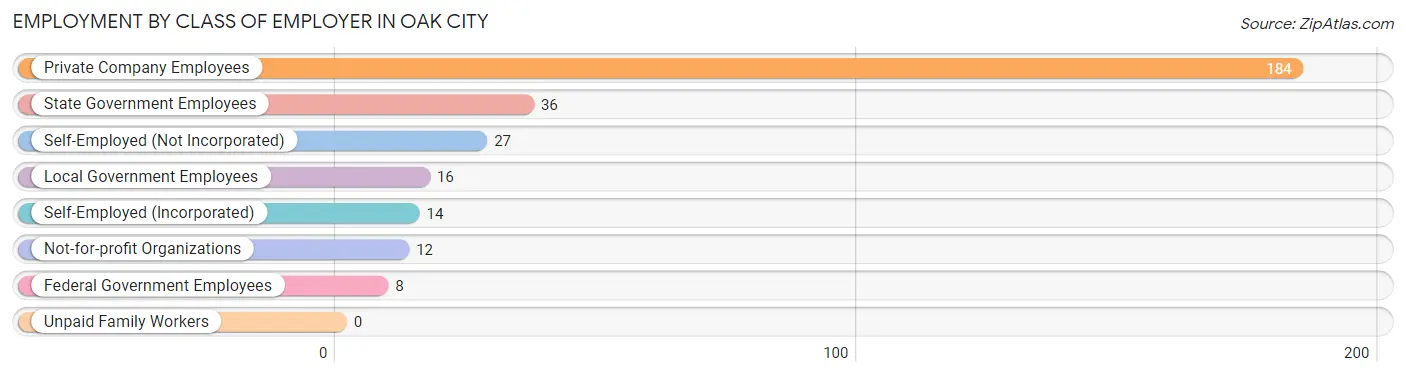
| Employer Class | # Employees | % Employees |
| Private Company Employees | 184 | 62.0% |
| Self-Employed (Incorporated) | 14 | 4.7% |
| Self-Employed (Not Incorporated) | 27 | 9.1% |
| Not-for-profit Organizations | 12 | 4.0% |
| Local Government Employees | 16 | 5.4% |
| State Government Employees | 36 | 12.1% |
| Federal Government Employees | 8 | 2.7% |
| Unpaid Family Workers | 0 | 0.0% |
| Total | 297 | 100.0% |
Employment Status by Age in Oak City
According to the labor force statistics for Oak City, out of the total population over 16 years of age (608), 49.7% or 302 individuals are in the labor force, with 1.7% or 5 of them unemployed. The age group with the highest labor force participation rate is 25 to 29 years, with 100.0% or 37 individuals in the labor force. Within the labor force, the 30 to 34 years age range has the highest percentage of unemployed individuals, with 15.6% or 5 of them being unemployed.
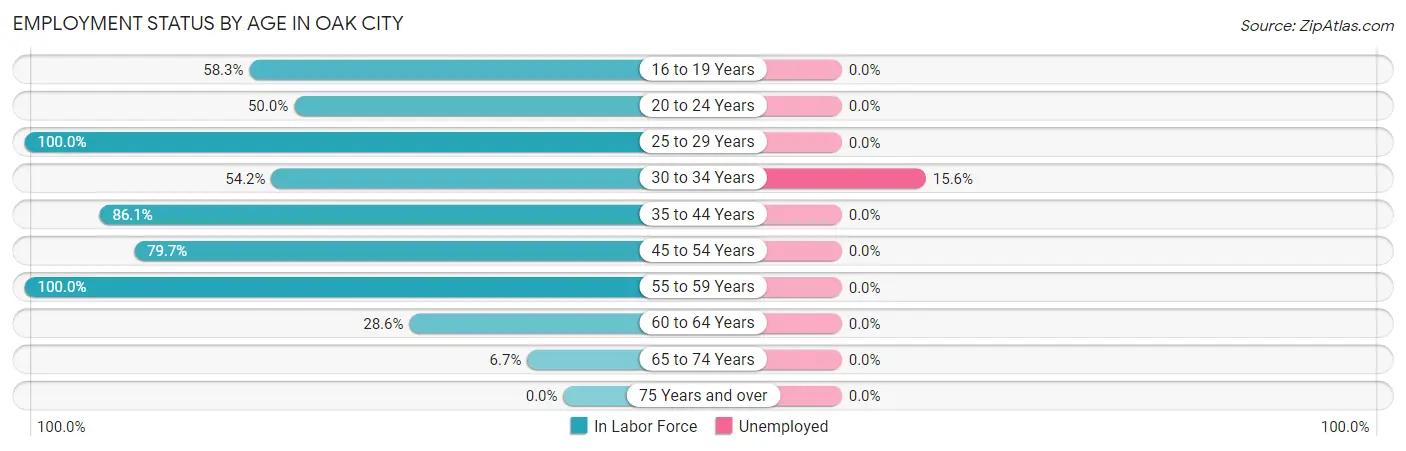
| Age Bracket | In Labor Force | Unemployed |
| 16 to 19 Years | 14 (58.3%) | 0 (0.0%) |
| 20 to 24 Years | 10 (50.0%) | 0 (0.0%) |
| 25 to 29 Years | 37 (100.0%) | 0 (0.0%) |
| 30 to 34 Years | 32 (54.2%) | 5 (15.6%) |
| 35 to 44 Years | 68 (86.1%) | 0 (0.0%) |
| 45 to 54 Years | 59 (79.7%) | 0 (0.0%) |
| 55 to 59 Years | 62 (100.0%) | 0 (0.0%) |
| 60 to 64 Years | 10 (28.6%) | 0 (0.0%) |
| 65 to 74 Years | 10 (6.7%) | 0 (0.0%) |
| 75 Years and over | 0 (0.0%) | 0 (0.0%) |
| Total | 302 (49.7%) | 5 (1.7%) |
Employment Status by Educational Attainment in Oak City
According to labor force statistics for Oak City, 77.5% of individuals (268) out of the total population between 25 and 64 years of age (346) are in the labor force, with 1.9% or 5 of them being unemployed. The group with the highest labor force participation rate are those with the educational attainment of less than high school, with 100.0% or 1 individuals in the labor force. Within the labor force, individuals with high school diploma education have the highest percentage of unemployment, with 10.0% or 5 of them being unemployed.
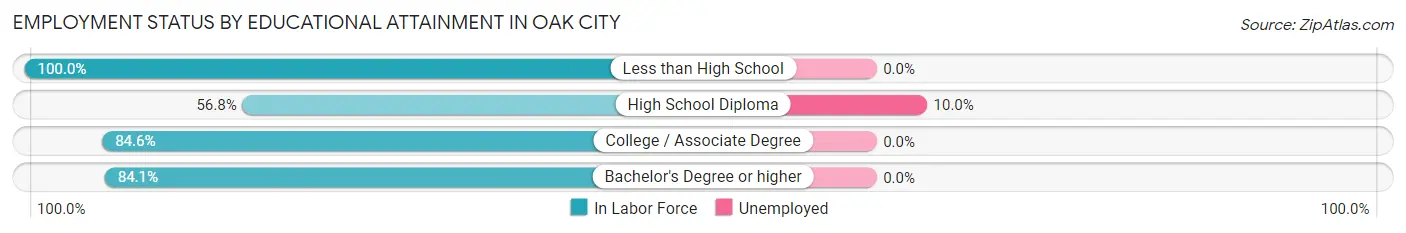
| Educational Attainment | In Labor Force | Unemployed |
| Less than High School | 1 (100.0%) | 0 (0.0%) |
| High School Diploma | 50 (56.8%) | 9 (10.0%) |
| College / Associate Degree | 143 (84.6%) | 0 (0.0%) |
| Bachelor's Degree or higher | 74 (84.1%) | 0 (0.0%) |
| Total | 268 (77.5%) | 7 (1.9%) |
Employment Occupations by Sex in Oak City
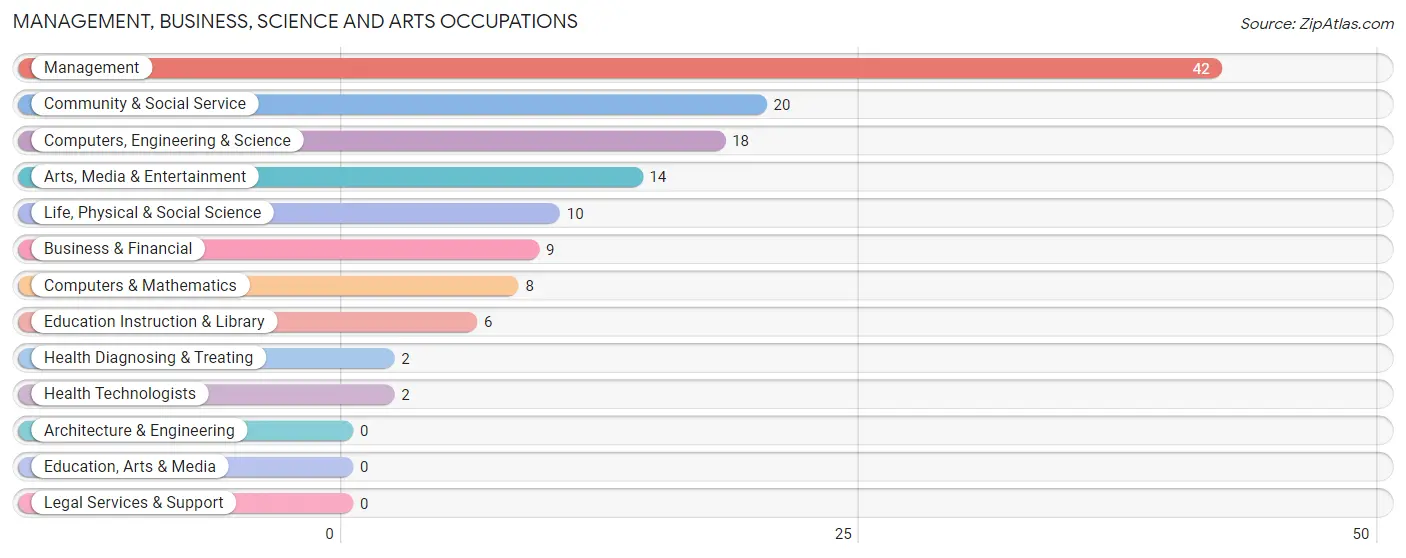
Management, Business, Science and Arts Occupations
The most common Management, Business, Science and Arts occupations in Oak City are Management (42 | 14.1%), Community & Social Service (20 | 6.7%), Computers, Engineering & Science (18 | 6.1%), Arts, Media & Entertainment (14 | 4.7%), and Life, Physical & Social Science (10 | 3.4%).
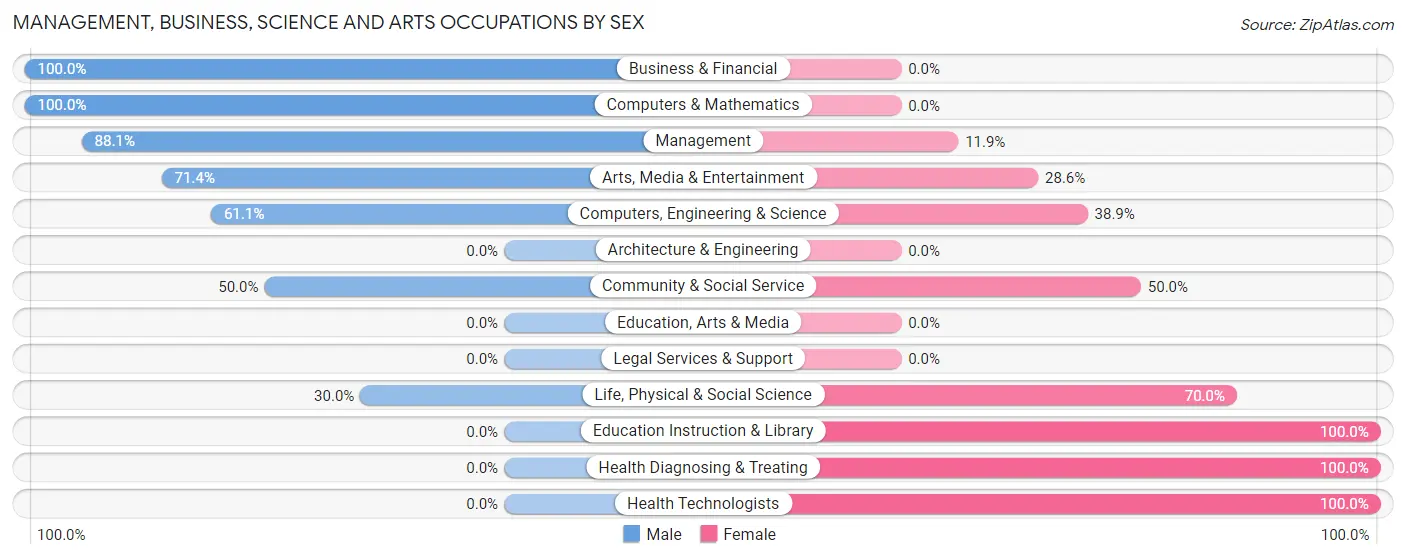
Management, Business, Science and Arts Occupations by Sex
Within the Management, Business, Science and Arts occupations in Oak City, the most male-oriented occupations are Business & Financial (100.0%), Computers & Mathematics (100.0%), and Management (88.1%), while the most female-oriented occupations are Education Instruction & Library (100.0%), Health Diagnosing & Treating (100.0%), and Health Technologists (100.0%).
| Occupation | Male | Female |
| Management | 37 (88.1%) | 5 (11.9%) |
| Business & Financial | 9 (100.0%) | 0 (0.0%) |
| Computers, Engineering & Science | 11 (61.1%) | 7 (38.9%) |
| Computers & Mathematics | 8 (100.0%) | 0 (0.0%) |
| Architecture & Engineering | 0 (0.0%) | 0 (0.0%) |
| Life, Physical & Social Science | 3 (30.0%) | 7 (70.0%) |
| Community & Social Service | 10 (50.0%) | 10 (50.0%) |
| Education, Arts & Media | 0 (0.0%) | 0 (0.0%) |
| Legal Services & Support | 0 (0.0%) | 0 (0.0%) |
| Education Instruction & Library | 0 (0.0%) | 6 (100.0%) |
| Arts, Media & Entertainment | 10 (71.4%) | 4 (28.6%) |
| Health Diagnosing & Treating | 0 (0.0%) | 2 (100.0%) |
| Health Technologists | 0 (0.0%) | 2 (100.0%) |
| Total (Category) | 67 (73.6%) | 24 (26.4%) |
| Total (Overall) | 165 (55.6%) | 132 (44.4%) |
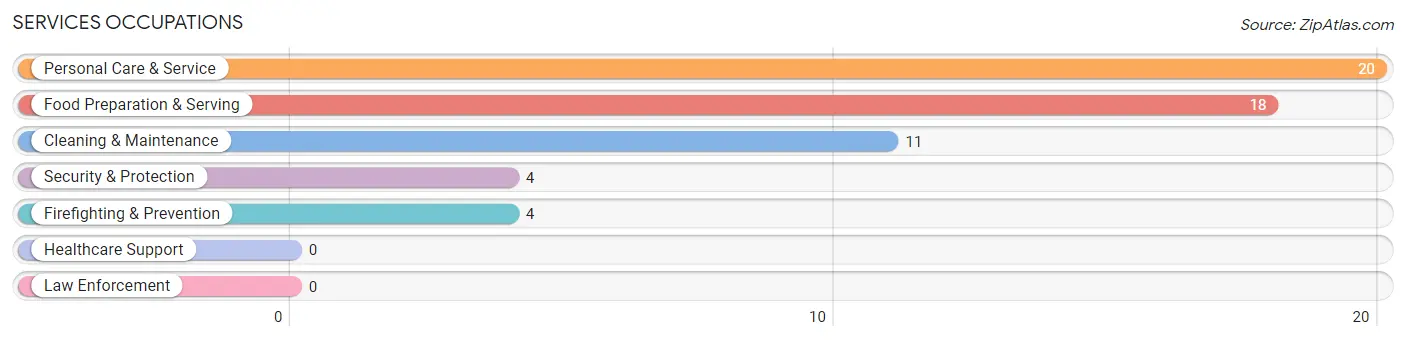
Services Occupations
The most common Services occupations in Oak City are Personal Care & Service (20 | 6.7%), Food Preparation & Serving (18 | 6.1%), Cleaning & Maintenance (11 | 3.7%), Security & Protection (4 | 1.3%), and Firefighting & Prevention (4 | 1.3%).
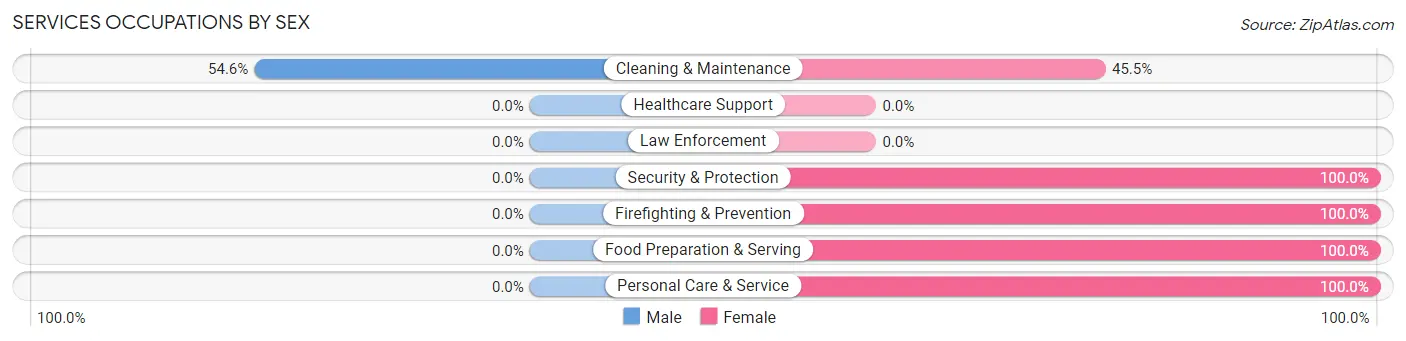
Services Occupations by Sex
| Occupation | Male | Female |
| Healthcare Support | 0 (0.0%) | 0 (0.0%) |
| Security & Protection | 0 (0.0%) | 4 (100.0%) |
| Firefighting & Prevention | 0 (0.0%) | 4 (100.0%) |
| Law Enforcement | 0 (0.0%) | 0 (0.0%) |
| Food Preparation & Serving | 0 (0.0%) | 18 (100.0%) |
| Cleaning & Maintenance | 6 (54.5%) | 5 (45.5%) |
| Personal Care & Service | 0 (0.0%) | 20 (100.0%) |
| Total (Category) | 6 (11.3%) | 47 (88.7%) |
| Total (Overall) | 165 (55.6%) | 132 (44.4%) |
Sales and Office Occupations
The most common Sales and Office occupations in Oak City are Office & Administration (51 | 17.2%), and Sales & Related (18 | 6.1%).
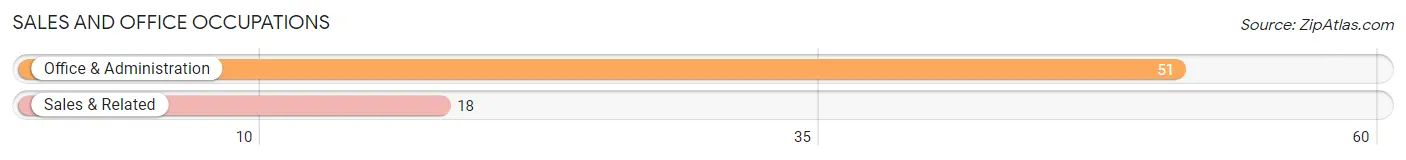
Sales and Office Occupations by Sex
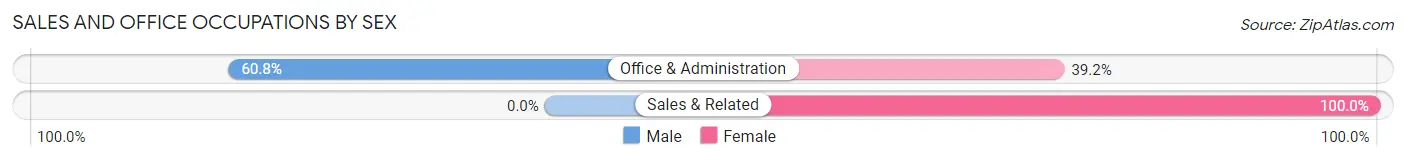
| Occupation | Male | Female |
| Sales & Related | 0 (0.0%) | 18 (100.0%) |
| Office & Administration | 31 (60.8%) | 20 (39.2%) |
| Total (Category) | 31 (44.9%) | 38 (55.1%) |
| Total (Overall) | 165 (55.6%) | 132 (44.4%) |
Natural Resources, Construction and Maintenance Occupations
The most common Natural Resources, Construction and Maintenance occupations in Oak City are Construction & Extraction (21 | 7.1%), and Installation, Maintenance & Repair (10 | 3.4%).
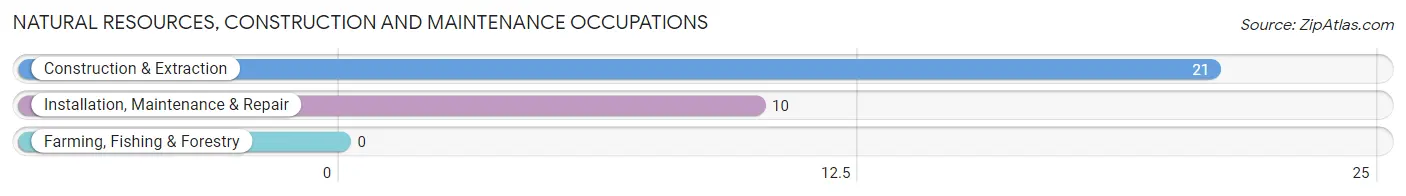
Natural Resources, Construction and Maintenance Occupations by Sex

| Occupation | Male | Female |
| Farming, Fishing & Forestry | 0 (0.0%) | 0 (0.0%) |
| Construction & Extraction | 21 (100.0%) | 0 (0.0%) |
| Installation, Maintenance & Repair | 5 (50.0%) | 5 (50.0%) |
| Total (Category) | 26 (83.9%) | 5 (16.1%) |
| Total (Overall) | 165 (55.6%) | 132 (44.4%) |
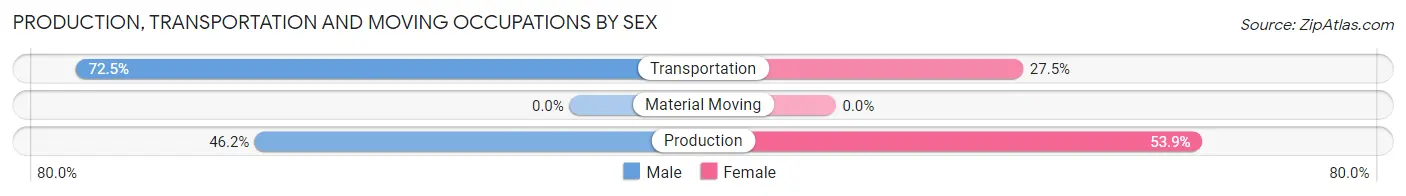
Production, Transportation and Moving Occupations
The most common Production, Transportation and Moving occupations in Oak City are Transportation (40 | 13.5%), and Production (13 | 4.4%).
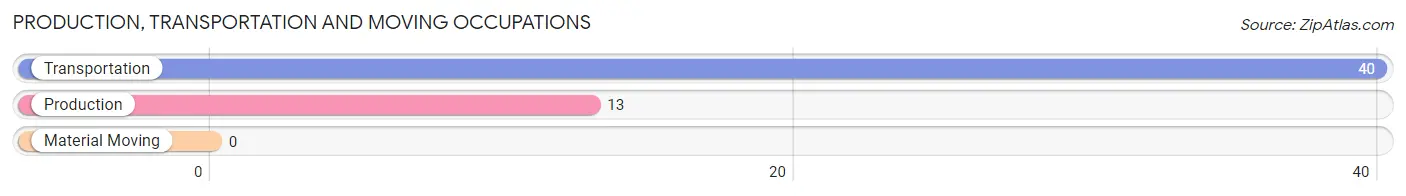
Production, Transportation and Moving Occupations by Sex
| Occupation | Male | Female |
| Production | 6 (46.2%) | 7 (53.8%) |
| Transportation | 29 (72.5%) | 11 (27.5%) |
| Material Moving | 0 (0.0%) | 0 (0.0%) |
| Total (Category) | 35 (66.0%) | 18 (34.0%) |
| Total (Overall) | 165 (55.6%) | 132 (44.4%) |
Employment Industries by Sex in Oak City
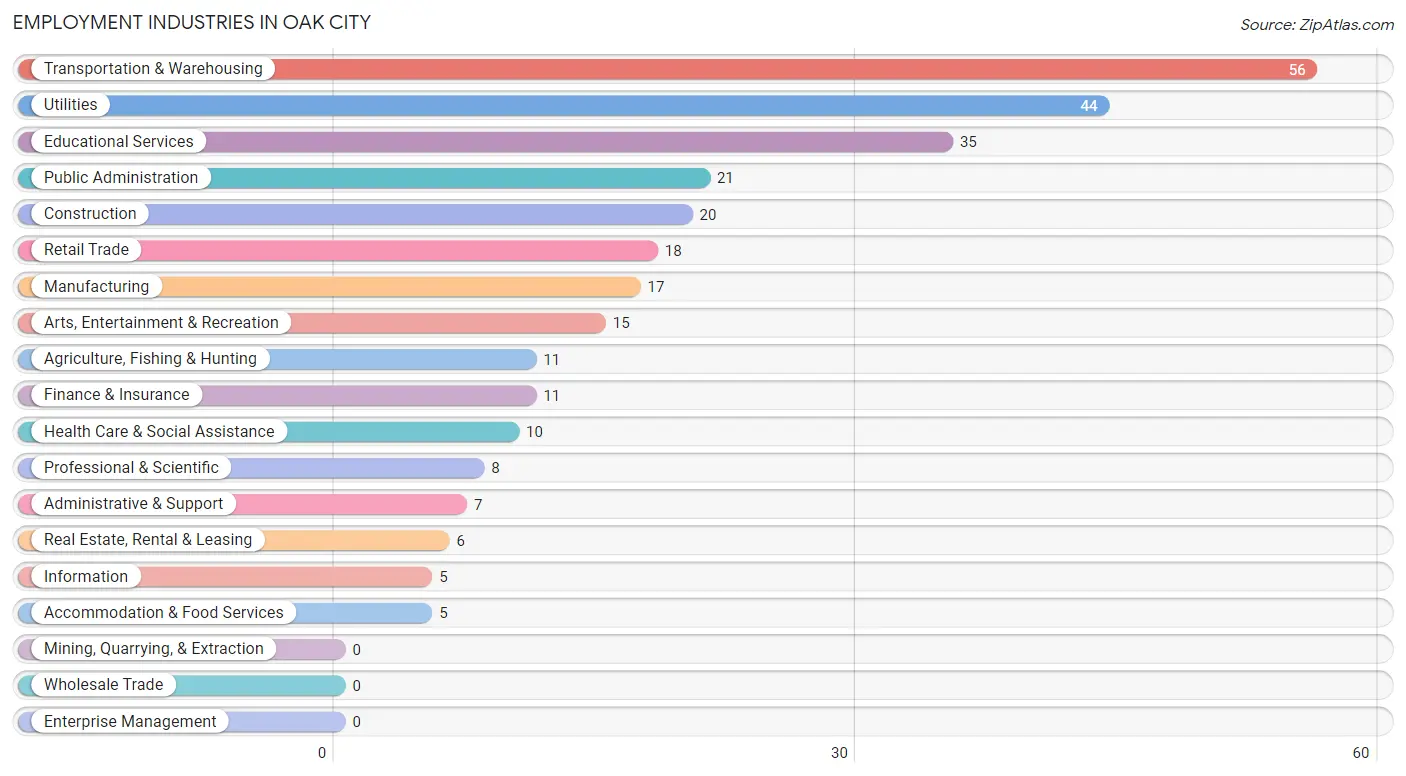
Employment Industries in Oak City
The major employment industries in Oak City include Transportation & Warehousing (56 | 18.9%), Utilities (44 | 14.8%), Educational Services (35 | 11.8%), Public Administration (21 | 7.1%), and Construction (20 | 6.7%).
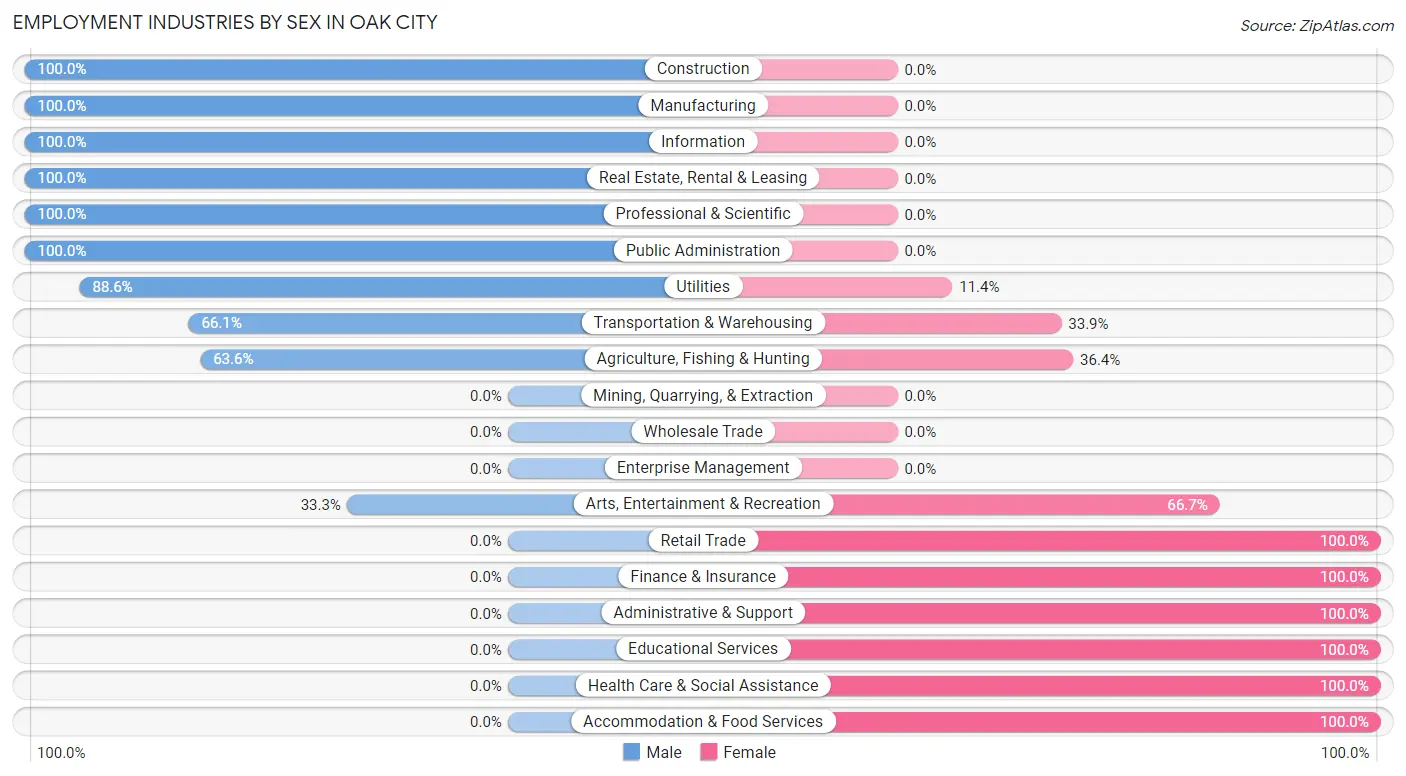
Employment Industries by Sex in Oak City
The Oak City industries that see more men than women are Construction (100.0%), Manufacturing (100.0%), and Information (100.0%), whereas the industries that tend to have a higher number of women are Retail Trade (100.0%), Finance & Insurance (100.0%), and Administrative & Support (100.0%).
| Industry | Male | Female |
| Agriculture, Fishing & Hunting | 7 (63.6%) | 4 (36.4%) |
| Mining, Quarrying, & Extraction | 0 (0.0%) | 0 (0.0%) |
| Construction | 20 (100.0%) | 0 (0.0%) |
| Manufacturing | 17 (100.0%) | 0 (0.0%) |
| Wholesale Trade | 0 (0.0%) | 0 (0.0%) |
| Retail Trade | 0 (0.0%) | 18 (100.0%) |
| Transportation & Warehousing | 37 (66.1%) | 19 (33.9%) |
| Utilities | 39 (88.6%) | 5 (11.4%) |
| Information | 5 (100.0%) | 0 (0.0%) |
| Finance & Insurance | 0 (0.0%) | 11 (100.0%) |
| Real Estate, Rental & Leasing | 6 (100.0%) | 0 (0.0%) |
| Professional & Scientific | 8 (100.0%) | 0 (0.0%) |
| Enterprise Management | 0 (0.0%) | 0 (0.0%) |
| Administrative & Support | 0 (0.0%) | 7 (100.0%) |
| Educational Services | 0 (0.0%) | 35 (100.0%) |
| Health Care & Social Assistance | 0 (0.0%) | 10 (100.0%) |
| Arts, Entertainment & Recreation | 5 (33.3%) | 10 (66.7%) |
| Accommodation & Food Services | 0 (0.0%) | 5 (100.0%) |
| Public Administration | 21 (100.0%) | 0 (0.0%) |
| Total | 165 (55.6%) | 132 (44.4%) |
Education in Oak City
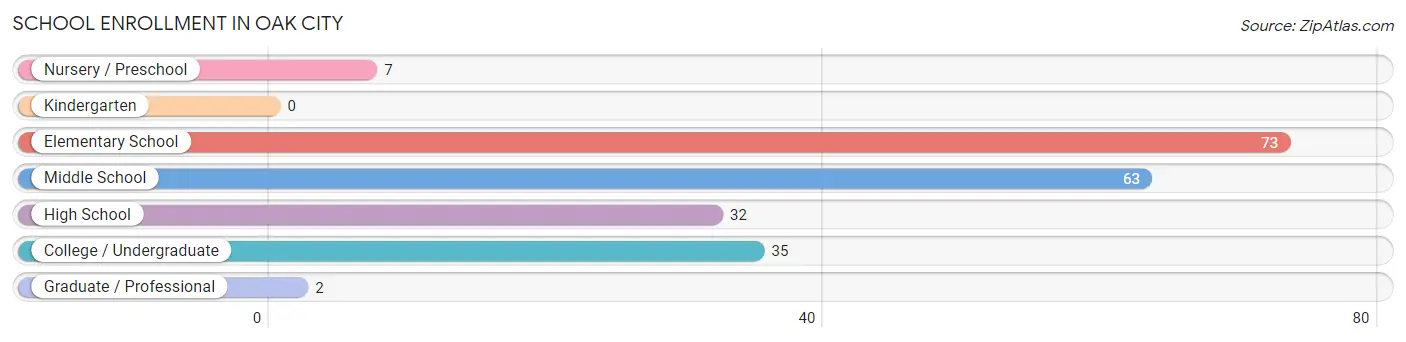
School Enrollment in Oak City
The most common levels of schooling among the 212 students in Oak City are elementary school (73 | 34.4%), middle school (63 | 29.7%), and college / undergraduate (35 | 16.5%).
| School Level | # Students | % Students |
| Nursery / Preschool | 7 | 3.3% |
| Kindergarten | 0 | 0.0% |
| Elementary School | 73 | 34.4% |
| Middle School | 63 | 29.7% |
| High School | 32 | 15.1% |
| College / Undergraduate | 35 | 16.5% |
| Graduate / Professional | 2 | 0.9% |
| Total | 212 | 100.0% |
School Enrollment by Age by Funding Source in Oak City
Out of a total of 212 students who are enrolled in schools in Oak City, 19 (9.0%) attend a private institution, while the remaining 193 (91.0%) are enrolled in public schools. The age group of 20 to 24 year olds has the highest likelihood of being enrolled in private schools, with 10 (100.0% in the age bracket) enrolled. Conversely, the age group of 5 to 9 year old has the lowest likelihood of being enrolled in a private school, with 73 (100.0% in the age bracket) attending a public institution.
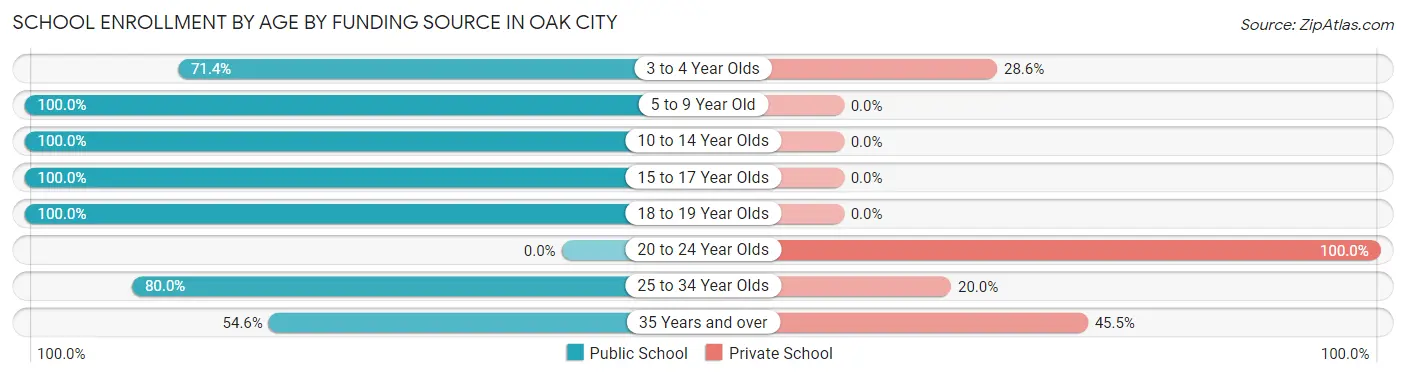
| Age Bracket | Public School | Private School |
| 3 to 4 Year Olds | 5 (71.4%) | 2 (28.6%) |
| 5 to 9 Year Old | 73 (100.0%) | 0 (0.0%) |
| 10 to 14 Year Olds | 67 (100.0%) | 0 (0.0%) |
| 15 to 17 Year Olds | 28 (100.0%) | 0 (0.0%) |
| 18 to 19 Year Olds | 6 (100.0%) | 0 (0.0%) |
| 20 to 24 Year Olds | 0 (0.0%) | 10 (100.0%) |
| 25 to 34 Year Olds | 8 (80.0%) | 2 (20.0%) |
| 35 Years and over | 6 (54.5%) | 5 (45.5%) |
| Total | 193 (91.0%) | 19 (9.0%) |
Educational Attainment by Field of Study in Oak City
Education (36 | 26.9%), business (24 | 17.9%), bio, nature & agricultural (19 | 14.2%), science & technology (11 | 8.2%), and liberal arts & history (11 | 8.2%) are the most common fields of study among 134 individuals in Oak City who have obtained a bachelor's degree or higher.
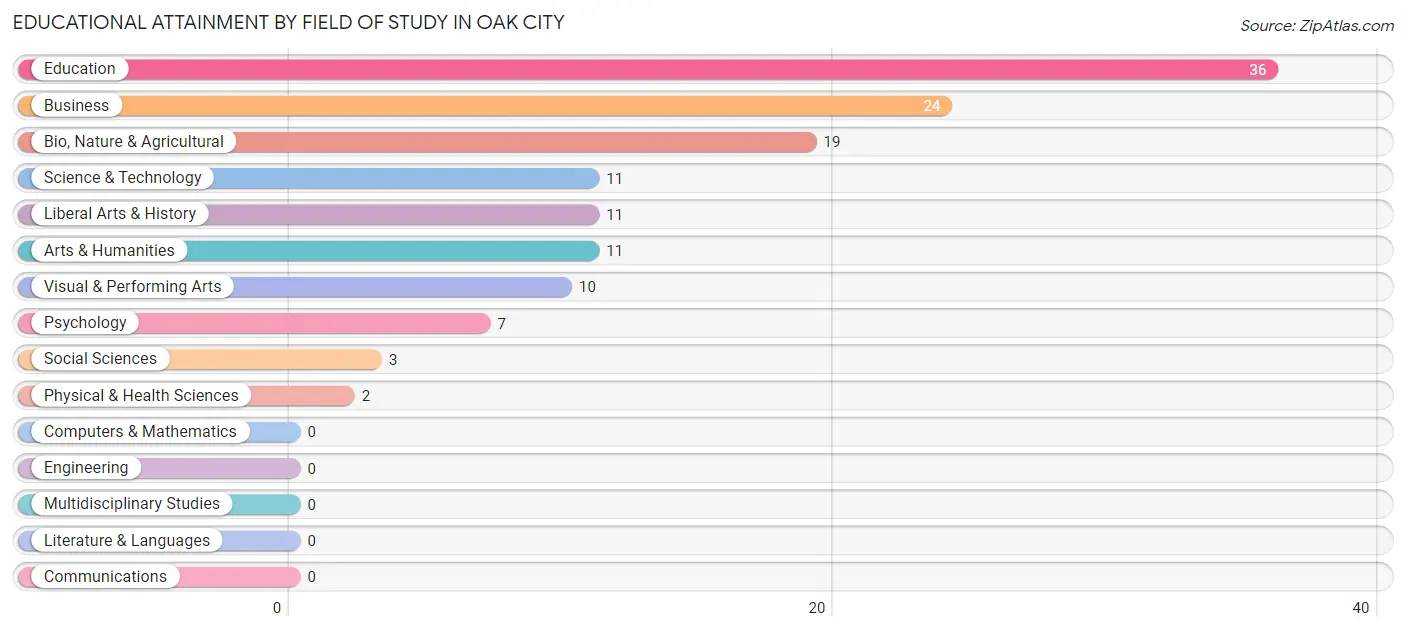
| Field of Study | # Graduates | % Graduates |
| Computers & Mathematics | 0 | 0.0% |
| Bio, Nature & Agricultural | 19 | 14.2% |
| Physical & Health Sciences | 2 | 1.5% |
| Psychology | 7 | 5.2% |
| Social Sciences | 3 | 2.2% |
| Engineering | 0 | 0.0% |
| Multidisciplinary Studies | 0 | 0.0% |
| Science & Technology | 11 | 8.2% |
| Business | 24 | 17.9% |
| Education | 36 | 26.9% |
| Literature & Languages | 0 | 0.0% |
| Liberal Arts & History | 11 | 8.2% |
| Visual & Performing Arts | 10 | 7.5% |
| Communications | 0 | 0.0% |
| Arts & Humanities | 11 | 8.2% |
| Total | 134 | 100.0% |
Transportation & Commute in Oak City
Vehicle Availability by Sex in Oak City
The most prevalent vehicle ownership categories in Oak City are males with 3 vehicles (79, accounting for 47.9%) and females with 3 vehicles (25, making up 59.9%).
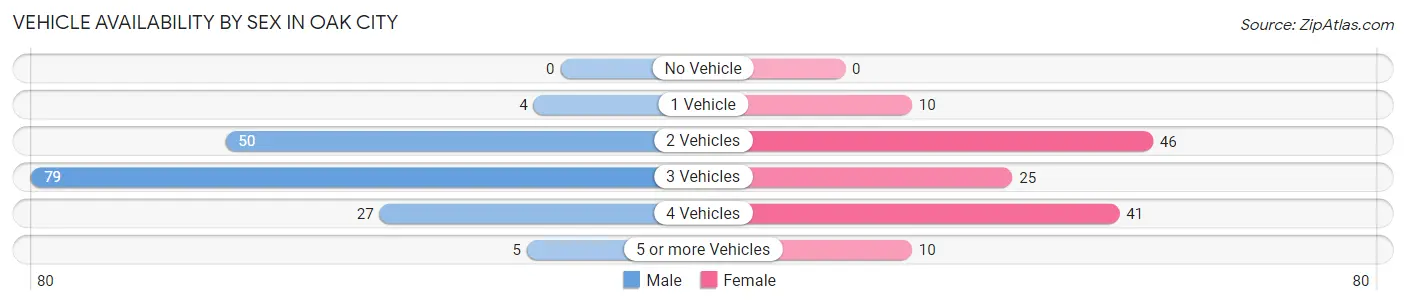
| Vehicles Available | Male | Female |
| No Vehicle | 0 (0.0%) | 0 (0.0%) |
| 1 Vehicle | 4 (2.4%) | 10 (7.6%) |
| 2 Vehicles | 50 (30.3%) | 46 (34.8%) |
| 3 Vehicles | 79 (47.9%) | 25 (18.9%) |
| 4 Vehicles | 27 (16.4%) | 41 (31.1%) |
| 5 or more Vehicles | 5 (3.0%) | 10 (7.6%) |
| Total | 165 (100.0%) | 132 (100.0%) |
Commute Time in Oak City
The most frequently occuring commute durations in Oak City are 20 to 24 minutes (81 commuters, 29.8%), 15 to 19 minutes (65 commuters, 23.9%), and 30 to 34 minutes (42 commuters, 15.4%).
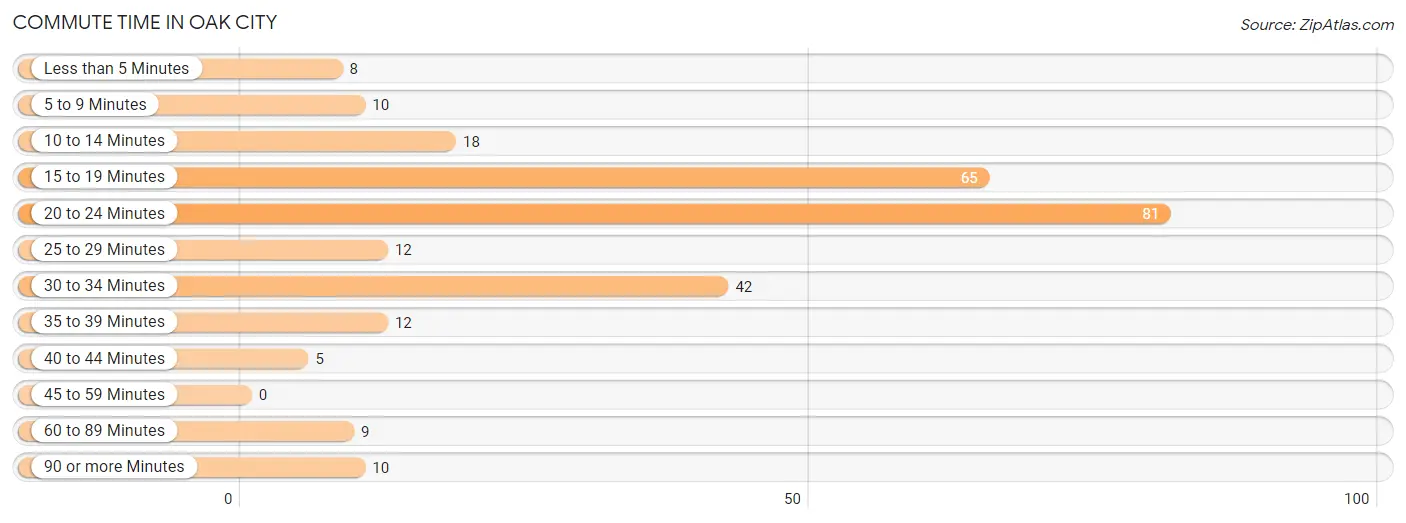
| Commute Time | # Commuters | % Commuters |
| Less than 5 Minutes | 8 | 2.9% |
| 5 to 9 Minutes | 10 | 3.7% |
| 10 to 14 Minutes | 18 | 6.6% |
| 15 to 19 Minutes | 65 | 23.9% |
| 20 to 24 Minutes | 81 | 29.8% |
| 25 to 29 Minutes | 12 | 4.4% |
| 30 to 34 Minutes | 42 | 15.4% |
| 35 to 39 Minutes | 12 | 4.4% |
| 40 to 44 Minutes | 5 | 1.8% |
| 45 to 59 Minutes | 0 | 0.0% |
| 60 to 89 Minutes | 9 | 3.3% |
| 90 or more Minutes | 10 | 3.7% |
Commute Time by Sex in Oak City
The most common commute times in Oak City are 20 to 24 minutes (47 commuters, 32.2%) for males and 15 to 19 minutes (53 commuters, 42.1%) for females.
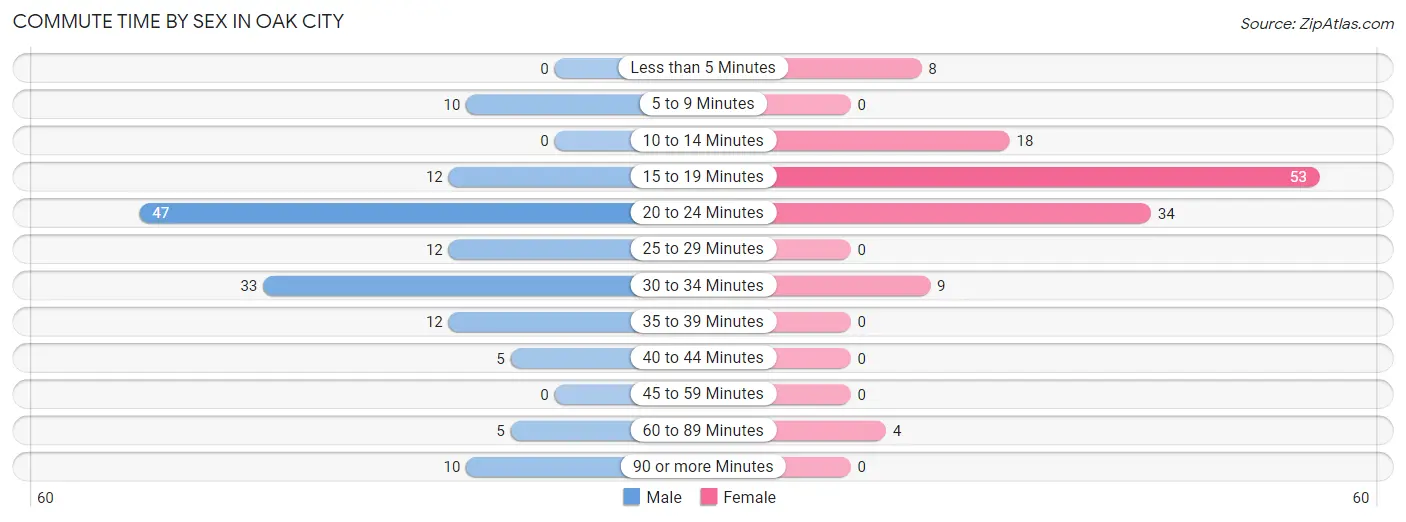
| Commute Time | Male | Female |
| Less than 5 Minutes | 0 (0.0%) | 8 (6.4%) |
| 5 to 9 Minutes | 10 (6.9%) | 0 (0.0%) |
| 10 to 14 Minutes | 0 (0.0%) | 18 (14.3%) |
| 15 to 19 Minutes | 12 (8.2%) | 53 (42.1%) |
| 20 to 24 Minutes | 47 (32.2%) | 34 (27.0%) |
| 25 to 29 Minutes | 12 (8.2%) | 0 (0.0%) |
| 30 to 34 Minutes | 33 (22.6%) | 9 (7.1%) |
| 35 to 39 Minutes | 12 (8.2%) | 0 (0.0%) |
| 40 to 44 Minutes | 5 (3.4%) | 0 (0.0%) |
| 45 to 59 Minutes | 0 (0.0%) | 0 (0.0%) |
| 60 to 89 Minutes | 5 (3.4%) | 4 (3.2%) |
| 90 or more Minutes | 10 (6.9%) | 0 (0.0%) |
Time of Departure to Work by Sex in Oak City
The most frequent times of departure to work in Oak City are 7:00 AM to 7:29 AM (29, 19.9%) for males and 7:30 AM to 7:59 AM (48, 38.1%) for females.
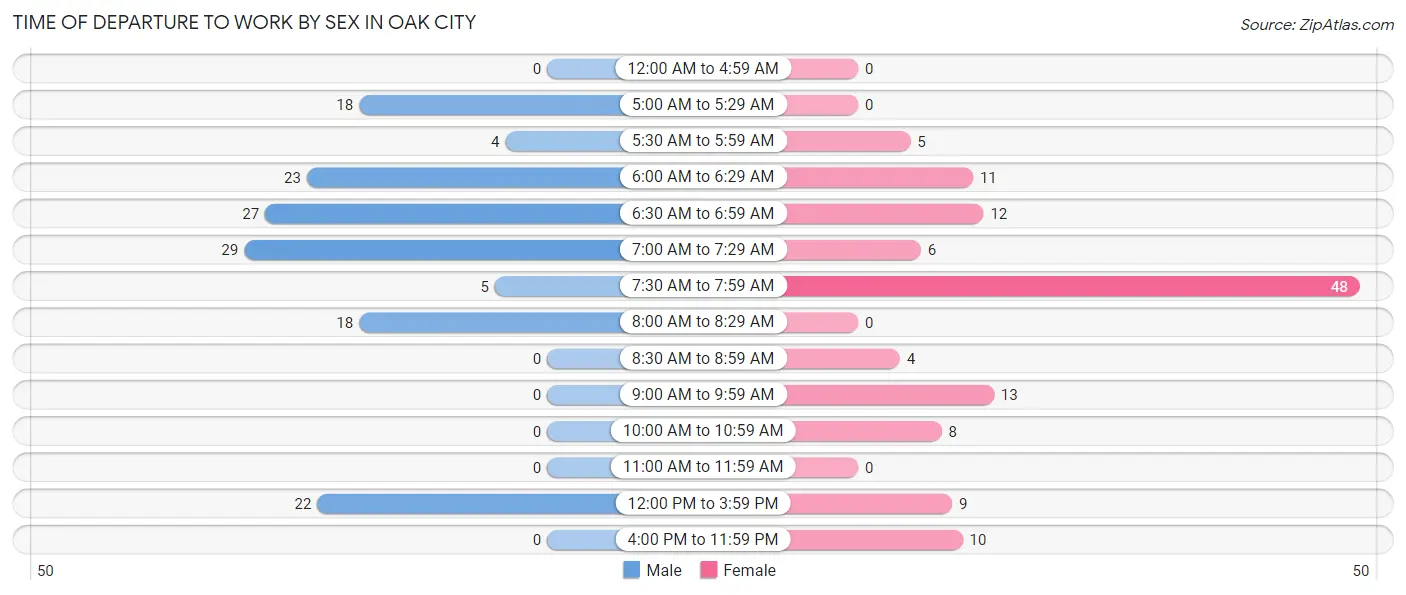
| Time of Departure | Male | Female |
| 12:00 AM to 4:59 AM | 0 (0.0%) | 0 (0.0%) |
| 5:00 AM to 5:29 AM | 18 (12.3%) | 0 (0.0%) |
| 5:30 AM to 5:59 AM | 4 (2.7%) | 5 (4.0%) |
| 6:00 AM to 6:29 AM | 23 (15.8%) | 11 (8.7%) |
| 6:30 AM to 6:59 AM | 27 (18.5%) | 12 (9.5%) |
| 7:00 AM to 7:29 AM | 29 (19.9%) | 6 (4.8%) |
| 7:30 AM to 7:59 AM | 5 (3.4%) | 48 (38.1%) |
| 8:00 AM to 8:29 AM | 18 (12.3%) | 0 (0.0%) |
| 8:30 AM to 8:59 AM | 0 (0.0%) | 4 (3.2%) |
| 9:00 AM to 9:59 AM | 0 (0.0%) | 13 (10.3%) |
| 10:00 AM to 10:59 AM | 0 (0.0%) | 8 (6.4%) |
| 11:00 AM to 11:59 AM | 0 (0.0%) | 0 (0.0%) |
| 12:00 PM to 3:59 PM | 22 (15.1%) | 9 (7.1%) |
| 4:00 PM to 11:59 PM | 0 (0.0%) | 10 (7.9%) |
| Total | 146 (100.0%) | 126 (100.0%) |
Housing Occupancy in Oak City
Occupancy by Ownership in Oak City
Of the total 266 dwellings in Oak City, owner-occupied units account for 237 (89.1%), while renter-occupied units make up 29 (10.9%).
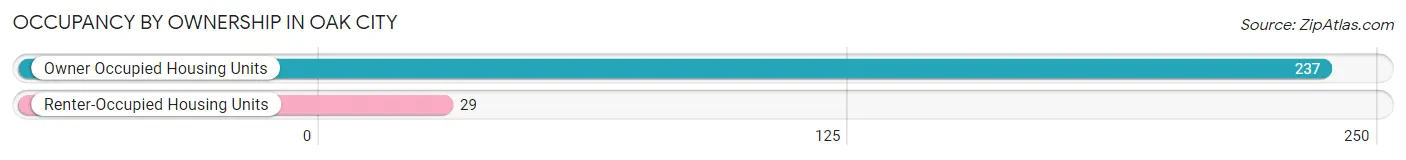
| Occupancy | # Housing Units | % Housing Units |
| Owner Occupied Housing Units | 237 | 89.1% |
| Renter-Occupied Housing Units | 29 | 10.9% |
| Total Occupied Housing Units | 266 | 100.0% |
Occupancy by Household Size in Oak City
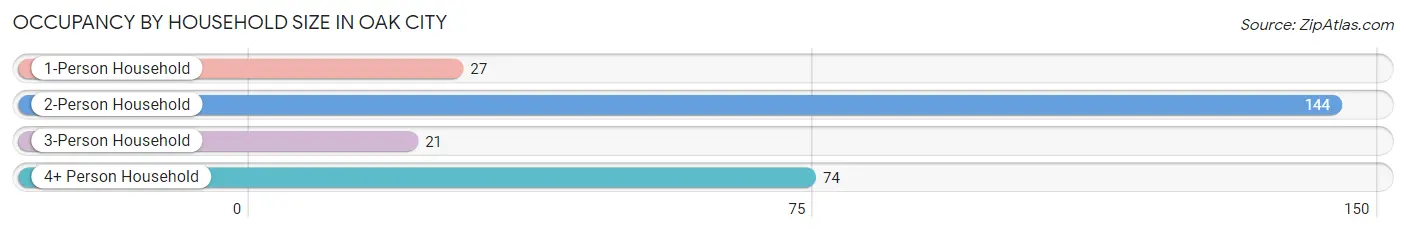
| Household Size | # Housing Units | % Housing Units |
| 1-Person Household | 27 | 10.2% |
| 2-Person Household | 144 | 54.1% |
| 3-Person Household | 21 | 7.9% |
| 4+ Person Household | 74 | 27.8% |
| Total Housing Units | 266 | 100.0% |
Occupancy by Ownership by Household Size in Oak City
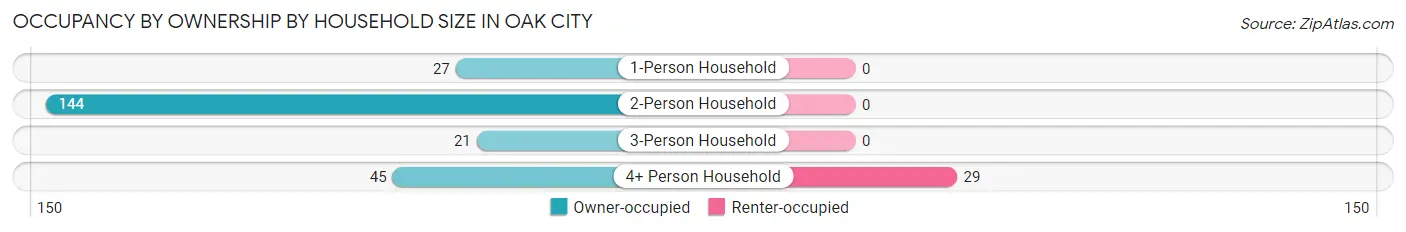
| Household Size | Owner-occupied | Renter-occupied |
| 1-Person Household | 27 (100.0%) | 0 (0.0%) |
| 2-Person Household | 144 (100.0%) | 0 (0.0%) |
| 3-Person Household | 21 (100.0%) | 0 (0.0%) |
| 4+ Person Household | 45 (60.8%) | 29 (39.2%) |
| Total Housing Units | 237 (89.1%) | 29 (10.9%) |
Occupancy by Educational Attainment in Oak City
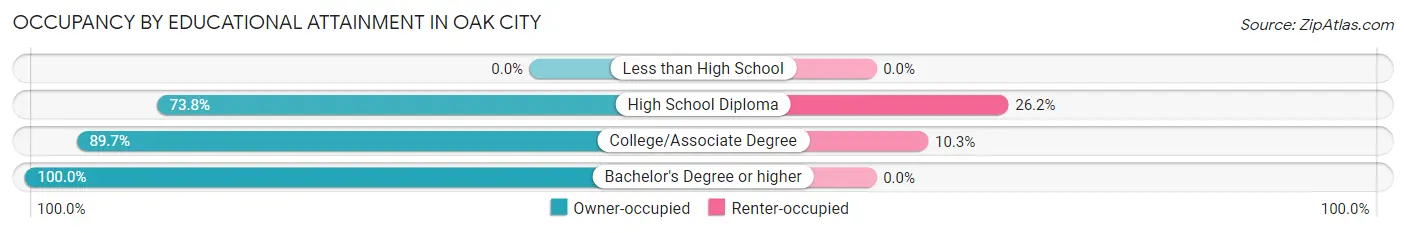
| Household Size | Owner-occupied | Renter-occupied |
| Less than High School | 0 (0.0%) | 0 (0.0%) |
| High School Diploma | 31 (73.8%) | 11 (26.2%) |
| College/Associate Degree | 157 (89.7%) | 18 (10.3%) |
| Bachelor's Degree or higher | 49 (100.0%) | 0 (0.0%) |
Occupancy by Age of Householder in Oak City
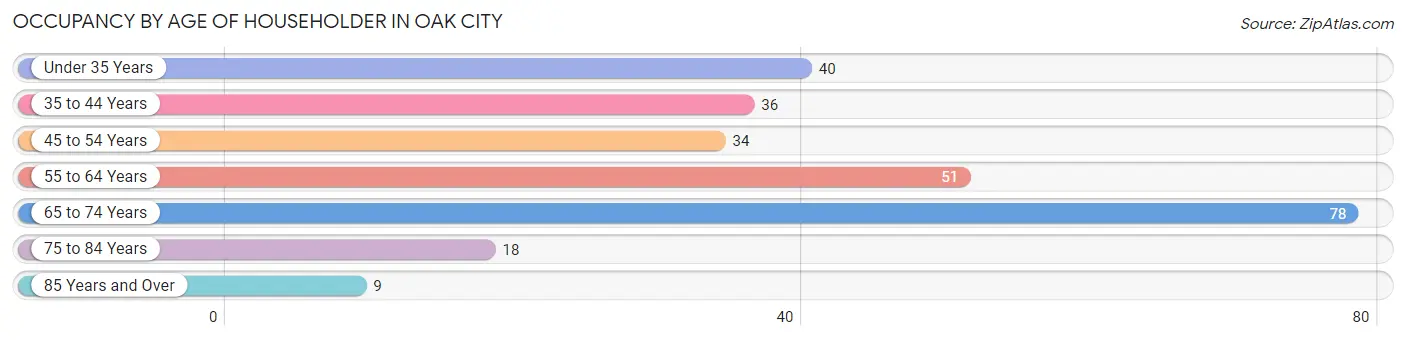
| Age Bracket | # Households | % Households |
| Under 35 Years | 40 | 15.0% |
| 35 to 44 Years | 36 | 13.5% |
| 45 to 54 Years | 34 | 12.8% |
| 55 to 64 Years | 51 | 19.2% |
| 65 to 74 Years | 78 | 29.3% |
| 75 to 84 Years | 18 | 6.8% |
| 85 Years and Over | 9 | 3.4% |
| Total | 266 | 100.0% |
Housing Finances in Oak City
Median Income by Occupancy in Oak City
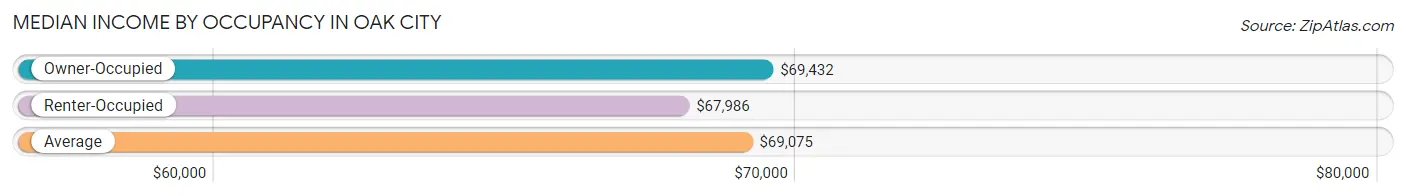
| Occupancy Type | # Households | Median Income |
| Owner-Occupied | 237 (89.1%) | $69,432 |
| Renter-Occupied | 29 (10.9%) | $67,986 |
| Average | 266 (100.0%) | $69,075 |
Occupancy by Householder Income Bracket in Oak City
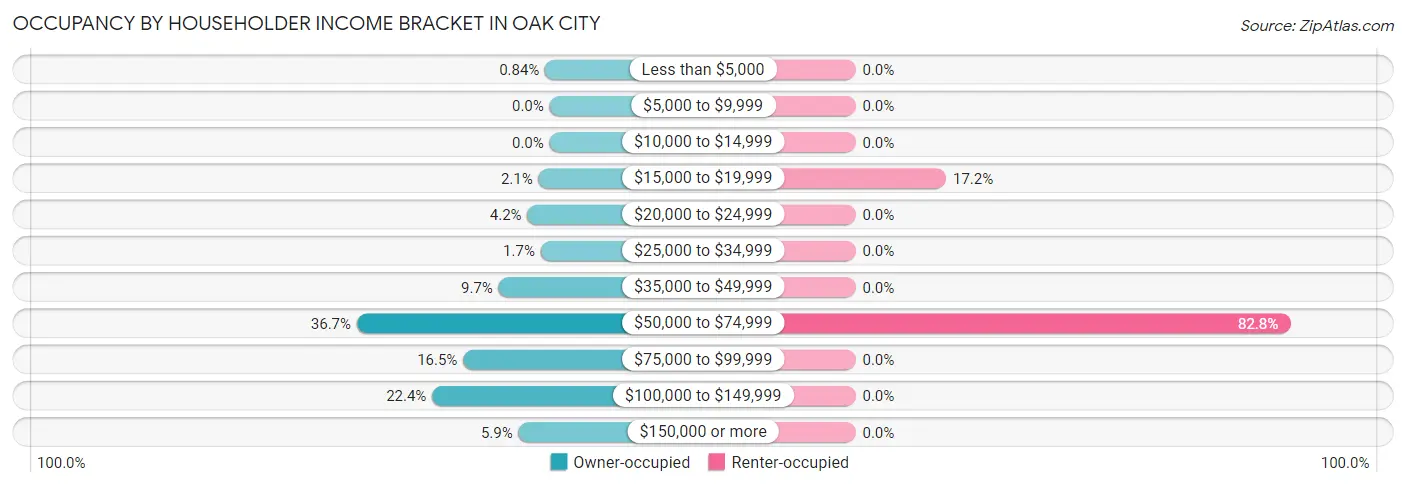
| Income Bracket | Owner-occupied | Renter-occupied |
| Less than $5,000 | 2 (0.8%) | 0 (0.0%) |
| $5,000 to $9,999 | 0 (0.0%) | 0 (0.0%) |
| $10,000 to $14,999 | 0 (0.0%) | 0 (0.0%) |
| $15,000 to $19,999 | 5 (2.1%) | 5 (17.2%) |
| $20,000 to $24,999 | 10 (4.2%) | 0 (0.0%) |
| $25,000 to $34,999 | 4 (1.7%) | 0 (0.0%) |
| $35,000 to $49,999 | 23 (9.7%) | 0 (0.0%) |
| $50,000 to $74,999 | 87 (36.7%) | 24 (82.8%) |
| $75,000 to $99,999 | 39 (16.5%) | 0 (0.0%) |
| $100,000 to $149,999 | 53 (22.4%) | 0 (0.0%) |
| $150,000 or more | 14 (5.9%) | 0 (0.0%) |
| Total | 237 (100.0%) | 29 (100.0%) |
Monthly Housing Cost Tiers in Oak City
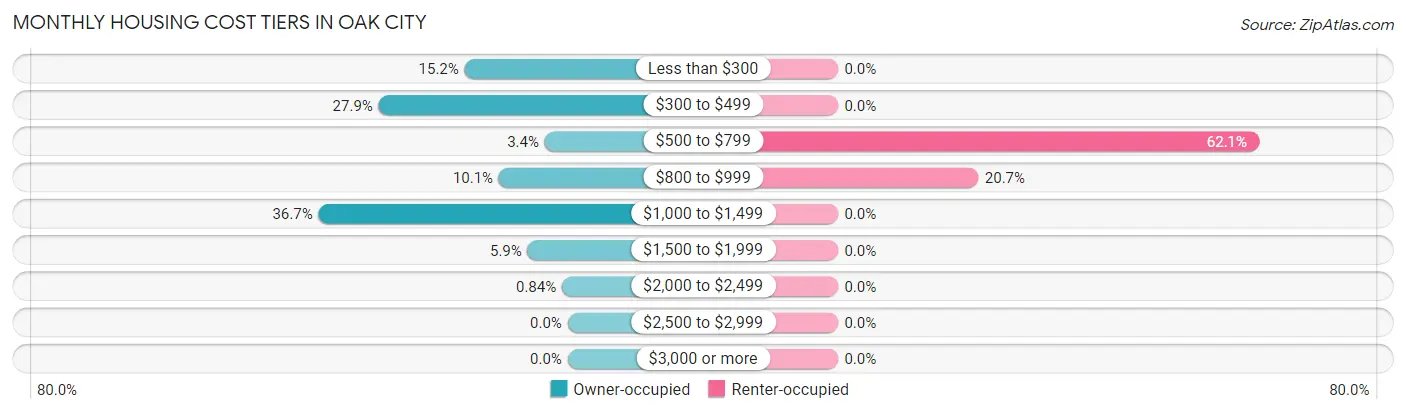
| Monthly Cost | Owner-occupied | Renter-occupied |
| Less than $300 | 36 (15.2%) | 0 (0.0%) |
| $300 to $499 | 66 (27.9%) | 0 (0.0%) |
| $500 to $799 | 8 (3.4%) | 18 (62.1%) |
| $800 to $999 | 24 (10.1%) | 6 (20.7%) |
| $1,000 to $1,499 | 87 (36.7%) | 0 (0.0%) |
| $1,500 to $1,999 | 14 (5.9%) | 0 (0.0%) |
| $2,000 to $2,499 | 2 (0.8%) | 0 (0.0%) |
| $2,500 to $2,999 | 0 (0.0%) | 0 (0.0%) |
| $3,000 or more | 0 (0.0%) | 0 (0.0%) |
| Total | 237 (100.0%) | 29 (100.0%) |
Physical Housing Characteristics in Oak City
Housing Structures in Oak City
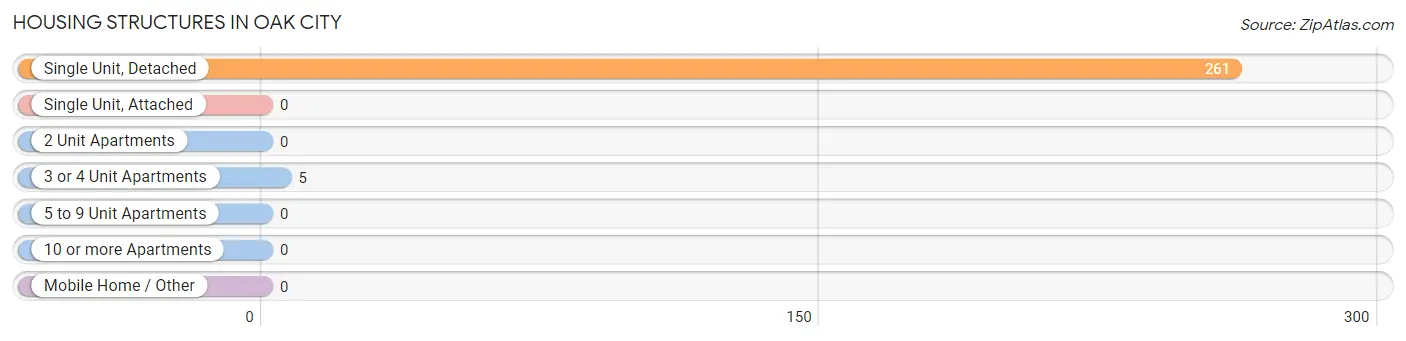
| Structure Type | # Housing Units | % Housing Units |
| Single Unit, Detached | 261 | 98.1% |
| Single Unit, Attached | 0 | 0.0% |
| 2 Unit Apartments | 0 | 0.0% |
| 3 or 4 Unit Apartments | 5 | 1.9% |
| 5 to 9 Unit Apartments | 0 | 0.0% |
| 10 or more Apartments | 0 | 0.0% |
| Mobile Home / Other | 0 | 0.0% |
| Total | 266 | 100.0% |
Housing Structures by Occupancy in Oak City
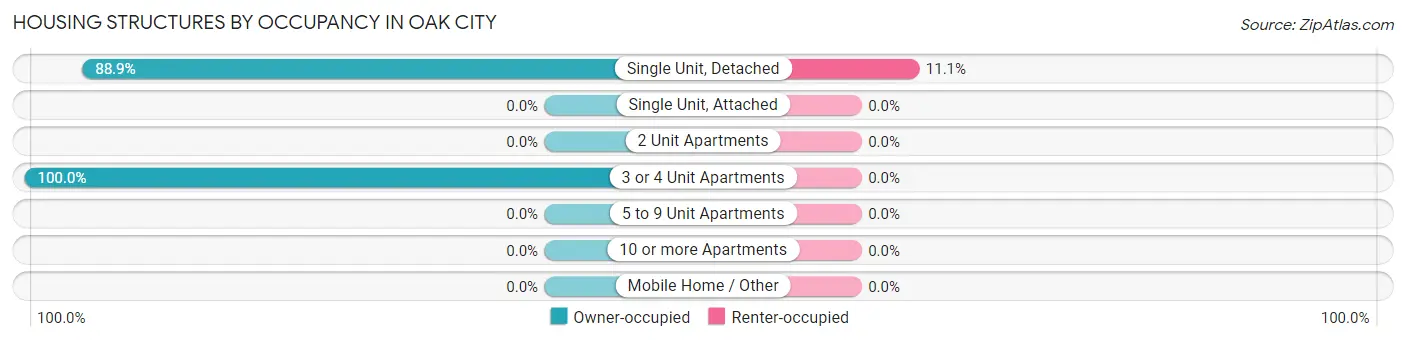
| Structure Type | Owner-occupied | Renter-occupied |
| Single Unit, Detached | 232 (88.9%) | 29 (11.1%) |
| Single Unit, Attached | 0 (0.0%) | 0 (0.0%) |
| 2 Unit Apartments | 0 (0.0%) | 0 (0.0%) |
| 3 or 4 Unit Apartments | 5 (100.0%) | 0 (0.0%) |
| 5 to 9 Unit Apartments | 0 (0.0%) | 0 (0.0%) |
| 10 or more Apartments | 0 (0.0%) | 0 (0.0%) |
| Mobile Home / Other | 0 (0.0%) | 0 (0.0%) |
| Total | 237 (89.1%) | 29 (10.9%) |
Housing Structures by Number of Rooms in Oak City
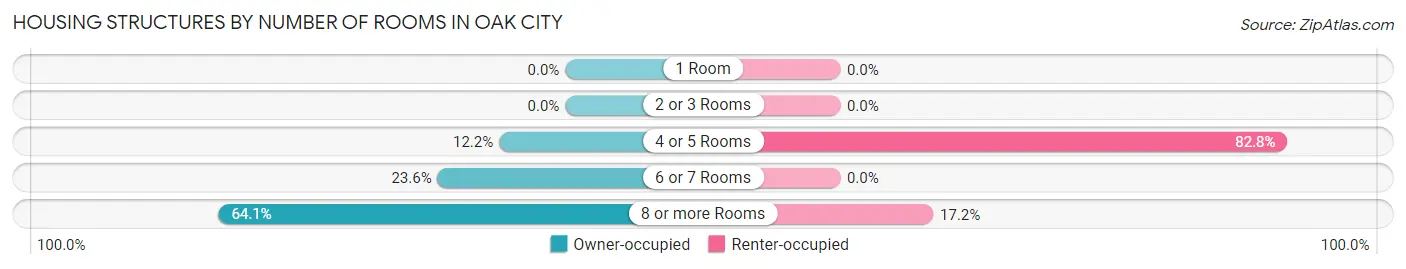
| Number of Rooms | Owner-occupied | Renter-occupied |
| 1 Room | 0 (0.0%) | 0 (0.0%) |
| 2 or 3 Rooms | 0 (0.0%) | 0 (0.0%) |
| 4 or 5 Rooms | 29 (12.2%) | 24 (82.8%) |
| 6 or 7 Rooms | 56 (23.6%) | 0 (0.0%) |
| 8 or more Rooms | 152 (64.1%) | 5 (17.2%) |
| Total | 237 (100.0%) | 29 (100.0%) |
Housing Structure by Heating Type in Oak City
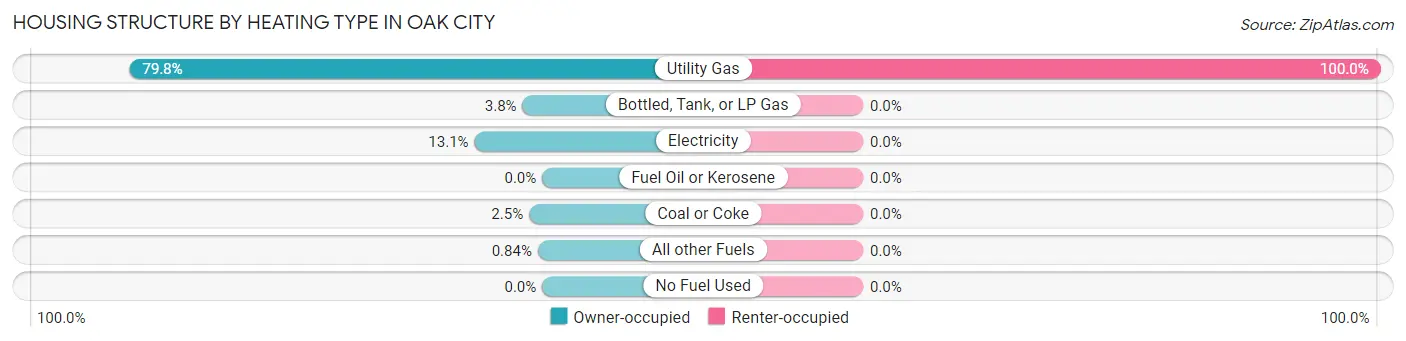
| Heating Type | Owner-occupied | Renter-occupied |
| Utility Gas | 189 (79.7%) | 29 (100.0%) |
| Bottled, Tank, or LP Gas | 9 (3.8%) | 0 (0.0%) |
| Electricity | 31 (13.1%) | 0 (0.0%) |
| Fuel Oil or Kerosene | 0 (0.0%) | 0 (0.0%) |
| Coal or Coke | 6 (2.5%) | 0 (0.0%) |
| All other Fuels | 2 (0.8%) | 0 (0.0%) |
| No Fuel Used | 0 (0.0%) | 0 (0.0%) |
| Total | 237 (100.0%) | 29 (100.0%) |
Household Vehicle Usage in Oak City
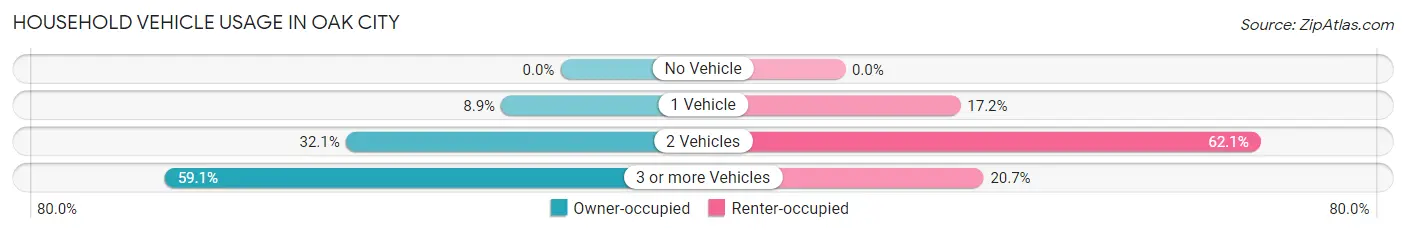
| Vehicles per Household | Owner-occupied | Renter-occupied |
| No Vehicle | 0 (0.0%) | 0 (0.0%) |
| 1 Vehicle | 21 (8.9%) | 5 (17.2%) |
| 2 Vehicles | 76 (32.1%) | 18 (62.1%) |
| 3 or more Vehicles | 140 (59.1%) | 6 (20.7%) |
| Total | 237 (100.0%) | 29 (100.0%) |
Real Estate & Mortgages in Oak City
Real Estate and Mortgage Overview in Oak City
| Characteristic | Without Mortgage | With Mortgage |
| Housing Units | 87 | 150 |
| Median Property Value | $230,200 | $191,200 |
| Median Household Income | $55,875 | $14 |
| Monthly Housing Costs | $314 | $0 |
| Real Estate Taxes | $981 | $0 |
Property Value by Mortgage Status in Oak City
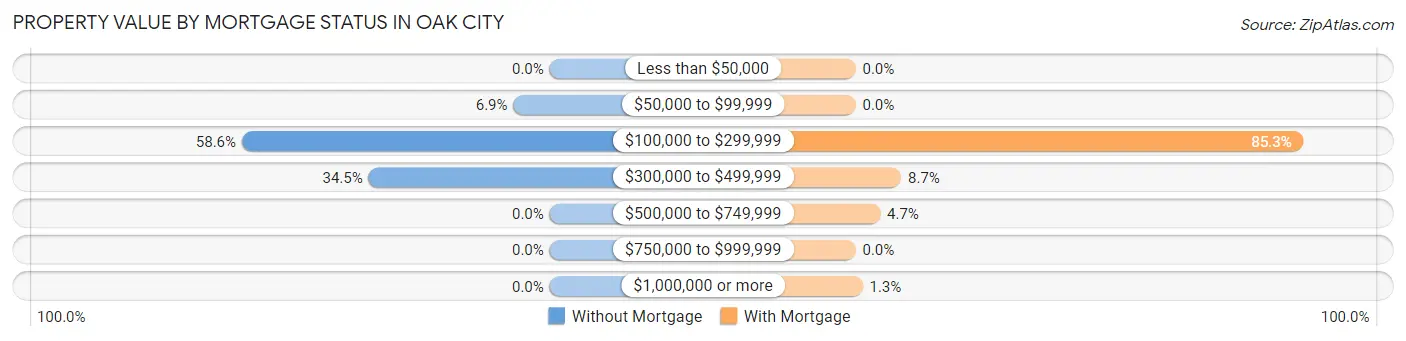
| Property Value | Without Mortgage | With Mortgage |
| Less than $50,000 | 0 (0.0%) | 0 (0.0%) |
| $50,000 to $99,999 | 6 (6.9%) | 0 (0.0%) |
| $100,000 to $299,999 | 51 (58.6%) | 128 (85.3%) |
| $300,000 to $499,999 | 30 (34.5%) | 13 (8.7%) |
| $500,000 to $749,999 | 0 (0.0%) | 7 (4.7%) |
| $750,000 to $999,999 | 0 (0.0%) | 0 (0.0%) |
| $1,000,000 or more | 0 (0.0%) | 2 (1.3%) |
| Total | 87 (100.0%) | 150 (100.0%) |
Household Income by Mortgage Status in Oak City
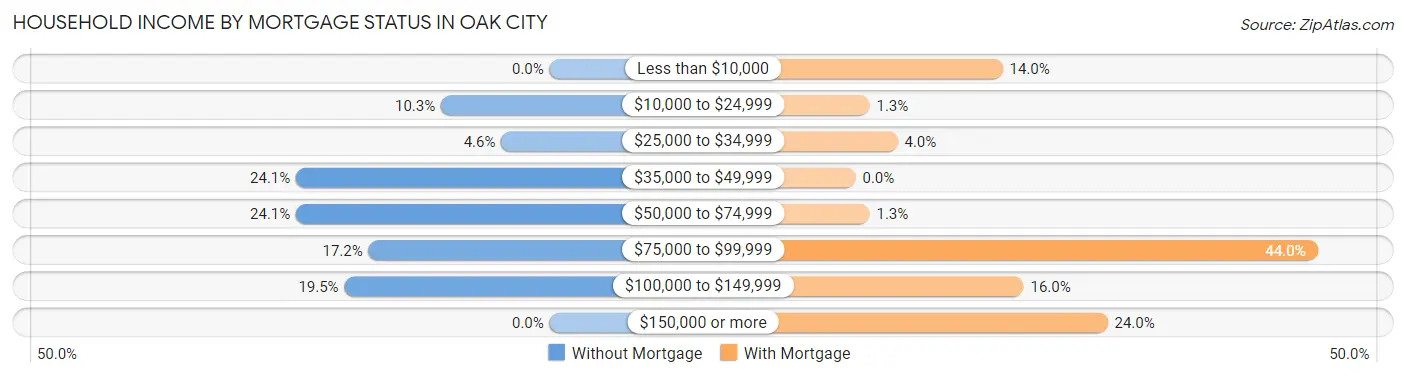
| Household Income | Without Mortgage | With Mortgage |
| Less than $10,000 | 0 (0.0%) | 21 (14.0%) |
| $10,000 to $24,999 | 9 (10.3%) | 2 (1.3%) |
| $25,000 to $34,999 | 4 (4.6%) | 6 (4.0%) |
| $35,000 to $49,999 | 21 (24.1%) | 0 (0.0%) |
| $50,000 to $74,999 | 21 (24.1%) | 2 (1.3%) |
| $75,000 to $99,999 | 15 (17.2%) | 66 (44.0%) |
| $100,000 to $149,999 | 17 (19.5%) | 24 (16.0%) |
| $150,000 or more | 0 (0.0%) | 36 (24.0%) |
| Total | 87 (100.0%) | 150 (100.0%) |
Property Value to Household Income Ratio in Oak City
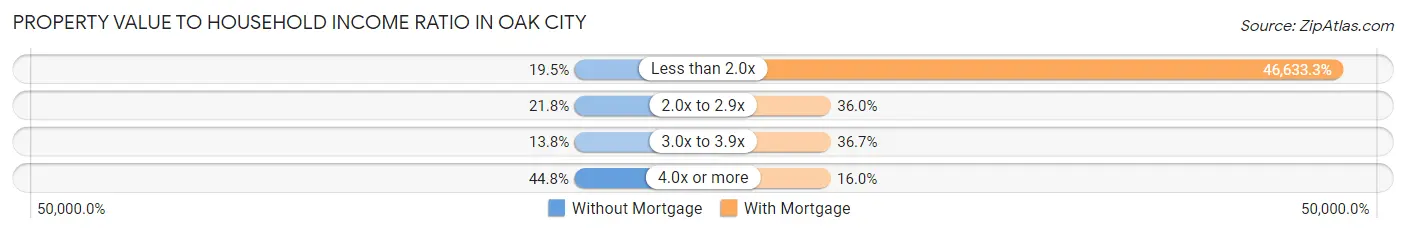
| Value-to-Income Ratio | Without Mortgage | With Mortgage |
| Less than 2.0x | 17 (19.5%) | 69,950 (46,633.3%) |
| 2.0x to 2.9x | 19 (21.8%) | 54 (36.0%) |
| 3.0x to 3.9x | 12 (13.8%) | 55 (36.7%) |
| 4.0x or more | 39 (44.8%) | 24 (16.0%) |
| Total | 87 (100.0%) | 150 (100.0%) |
Real Estate Taxes by Mortgage Status in Oak City
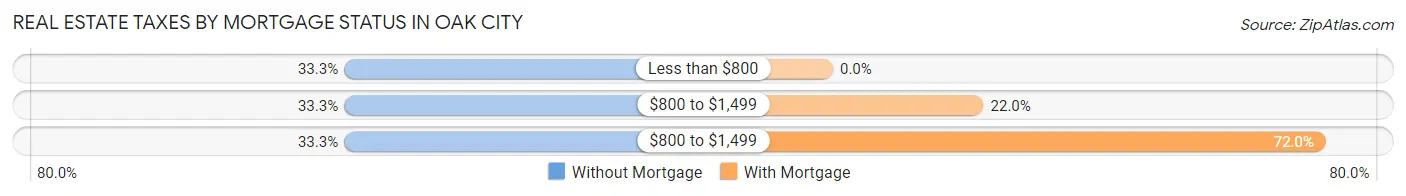
| Property Taxes | Without Mortgage | With Mortgage |
| Less than $800 | 29 (33.3%) | 0 (0.0%) |
| $800 to $1,499 | 29 (33.3%) | 33 (22.0%) |
| $800 to $1,499 | 29 (33.3%) | 108 (72.0%) |
| Total | 87 (100.0%) | 150 (100.0%) |
Health & Disability in Oak City
Health Insurance Coverage by Age in Oak City
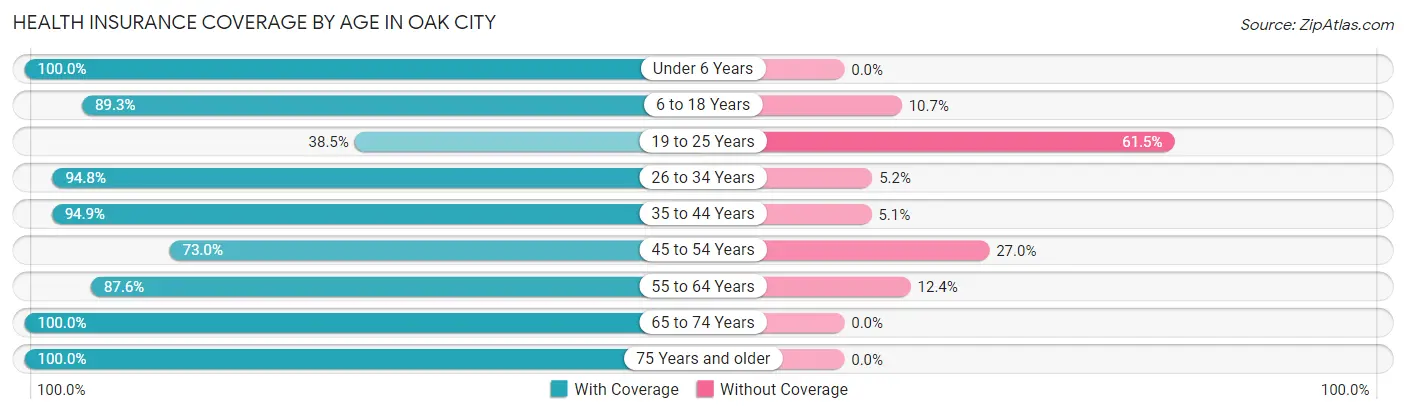
| Age Bracket | With Coverage | Without Coverage |
| Under 6 Years | 37 (100.0%) | 0 (0.0%) |
| 6 to 18 Years | 150 (89.3%) | 18 (10.7%) |
| 19 to 25 Years | 10 (38.5%) | 16 (61.5%) |
| 26 to 34 Years | 91 (94.8%) | 5 (5.2%) |
| 35 to 44 Years | 75 (94.9%) | 4 (5.1%) |
| 45 to 54 Years | 54 (73.0%) | 20 (27.0%) |
| 55 to 64 Years | 85 (87.6%) | 12 (12.4%) |
| 65 to 74 Years | 150 (100.0%) | 0 (0.0%) |
| 75 Years and older | 68 (100.0%) | 0 (0.0%) |
| Total | 720 (90.6%) | 75 (9.4%) |
Health Insurance Coverage by Citizenship Status in Oak City
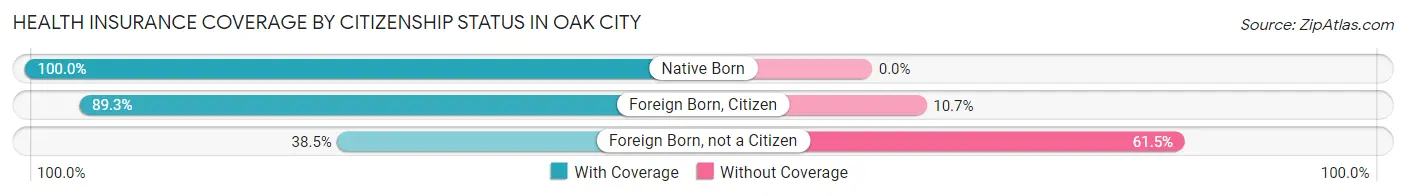
| Citizenship Status | With Coverage | Without Coverage |
| Native Born | 37 (100.0%) | 0 (0.0%) |
| Foreign Born, Citizen | 150 (89.3%) | 18 (10.7%) |
| Foreign Born, not a Citizen | 10 (38.5%) | 16 (61.5%) |
Health Insurance Coverage by Household Income in Oak City
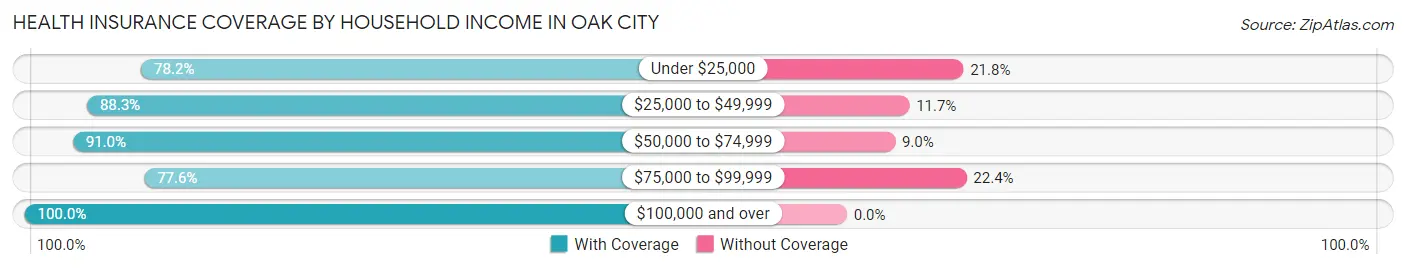
| Household Income | With Coverage | Without Coverage |
| Under $25,000 | 43 (78.2%) | 12 (21.8%) |
| $25,000 to $49,999 | 68 (88.3%) | 9 (11.7%) |
| $50,000 to $74,999 | 282 (91.0%) | 28 (9.0%) |
| $75,000 to $99,999 | 90 (77.6%) | 26 (22.4%) |
| $100,000 and over | 237 (100.0%) | 0 (0.0%) |
Public vs Private Health Insurance Coverage by Age in Oak City
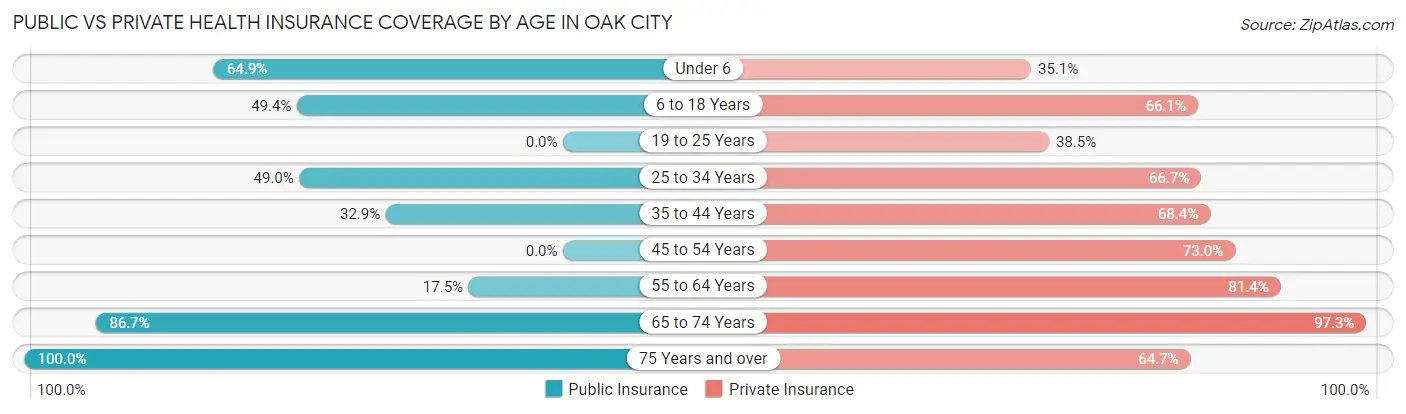
| Age Bracket | Public Insurance | Private Insurance |
| Under 6 | 24 (64.9%) | 13 (35.1%) |
| 6 to 18 Years | 83 (49.4%) | 111 (66.1%) |
| 19 to 25 Years | 0 (0.0%) | 10 (38.5%) |
| 25 to 34 Years | 47 (49.0%) | 64 (66.7%) |
| 35 to 44 Years | 26 (32.9%) | 54 (68.3%) |
| 45 to 54 Years | 0 (0.0%) | 54 (73.0%) |
| 55 to 64 Years | 17 (17.5%) | 79 (81.4%) |
| 65 to 74 Years | 130 (86.7%) | 146 (97.3%) |
| 75 Years and over | 68 (100.0%) | 44 (64.7%) |
| Total | 395 (49.7%) | 575 (72.3%) |
Disability Status by Sex by Age in Oak City
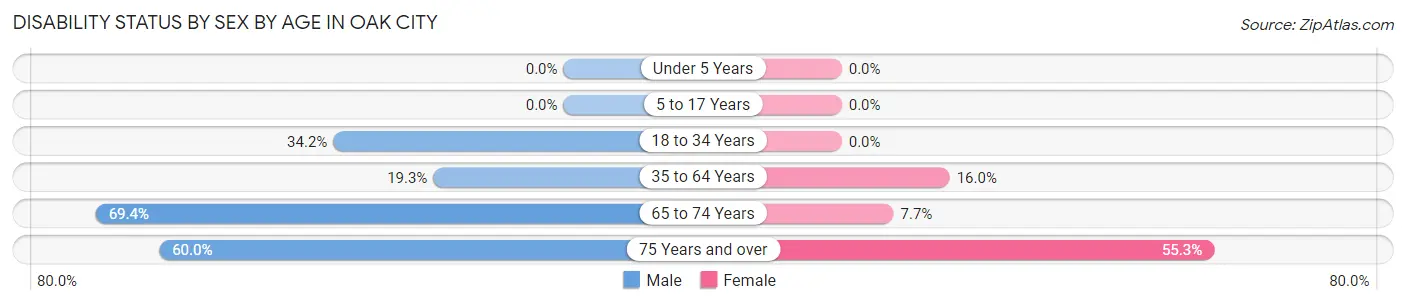
| Age Bracket | Male | Female |
| Under 5 Years | 0 (0.0%) | 0 (0.0%) |
| 5 to 17 Years | 0 (0.0%) | 0 (0.0%) |
| 18 to 34 Years | 27 (34.2%) | 0 (0.0%) |
| 35 to 64 Years | 23 (19.3%) | 21 (16.0%) |
| 65 to 74 Years | 50 (69.4%) | 6 (7.7%) |
| 75 Years and over | 18 (60.0%) | 21 (55.3%) |
Disability Class by Sex by Age in Oak City
Disability Class: Hearing Difficulty
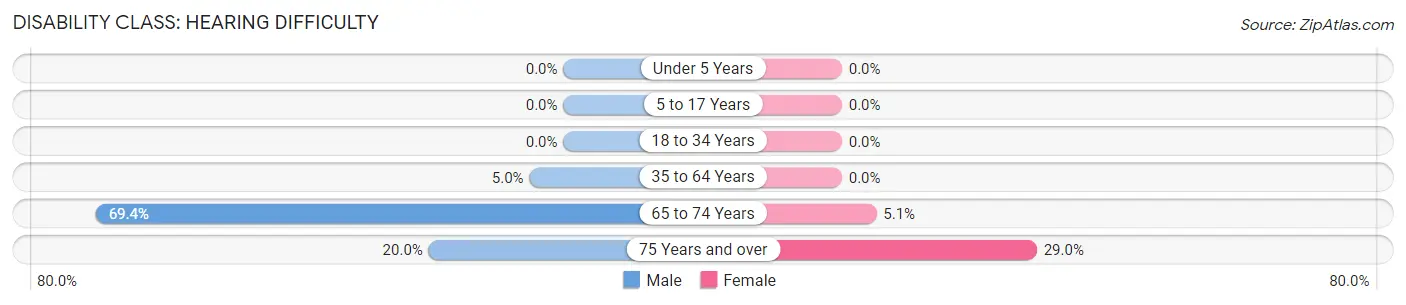
| Age Bracket | Male | Female |
| Under 5 Years | 0 (0.0%) | 0 (0.0%) |
| 5 to 17 Years | 0 (0.0%) | 0 (0.0%) |
| 18 to 34 Years | 0 (0.0%) | 0 (0.0%) |
| 35 to 64 Years | 6 (5.0%) | 0 (0.0%) |
| 65 to 74 Years | 50 (69.4%) | 4 (5.1%) |
| 75 Years and over | 6 (20.0%) | 11 (28.9%) |
Disability Class: Vision Difficulty
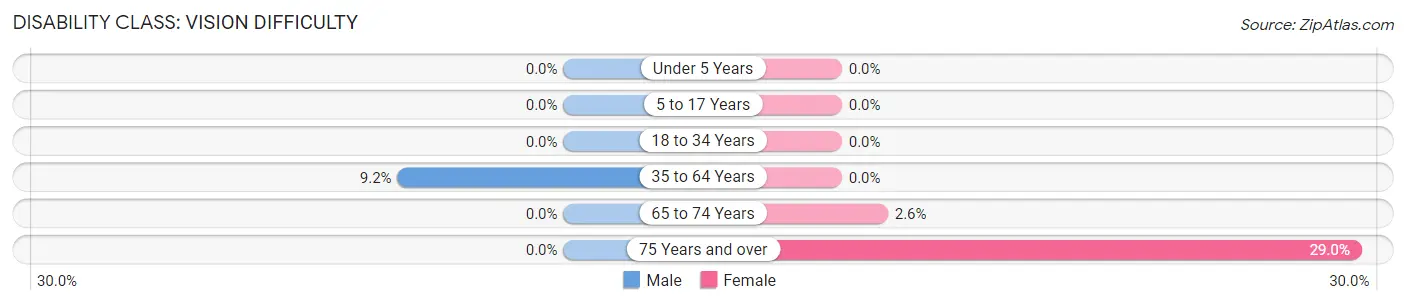
| Age Bracket | Male | Female |
| Under 5 Years | 0 (0.0%) | 0 (0.0%) |
| 5 to 17 Years | 0 (0.0%) | 0 (0.0%) |
| 18 to 34 Years | 0 (0.0%) | 0 (0.0%) |
| 35 to 64 Years | 11 (9.2%) | 0 (0.0%) |
| 65 to 74 Years | 0 (0.0%) | 2 (2.6%) |
| 75 Years and over | 0 (0.0%) | 11 (28.9%) |
Disability Class: Cognitive Difficulty
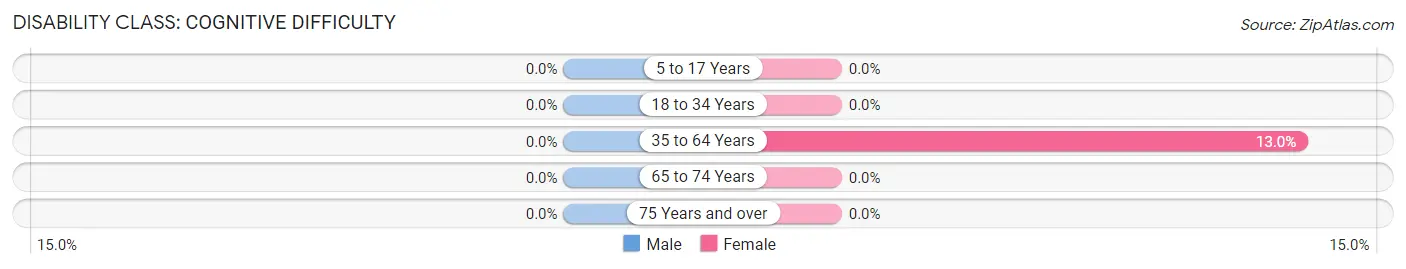
| Age Bracket | Male | Female |
| 5 to 17 Years | 0 (0.0%) | 0 (0.0%) |
| 18 to 34 Years | 0 (0.0%) | 0 (0.0%) |
| 35 to 64 Years | 0 (0.0%) | 17 (13.0%) |
| 65 to 74 Years | 0 (0.0%) | 0 (0.0%) |
| 75 Years and over | 0 (0.0%) | 0 (0.0%) |
Disability Class: Ambulatory Difficulty
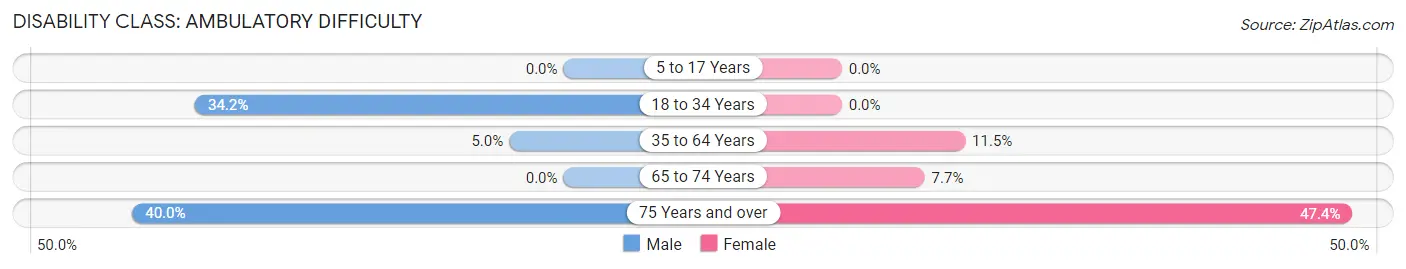
| Age Bracket | Male | Female |
| 5 to 17 Years | 0 (0.0%) | 0 (0.0%) |
| 18 to 34 Years | 27 (34.2%) | 0 (0.0%) |
| 35 to 64 Years | 6 (5.0%) | 15 (11.5%) |
| 65 to 74 Years | 0 (0.0%) | 6 (7.7%) |
| 75 Years and over | 12 (40.0%) | 18 (47.4%) |
Disability Class: Self-Care Difficulty
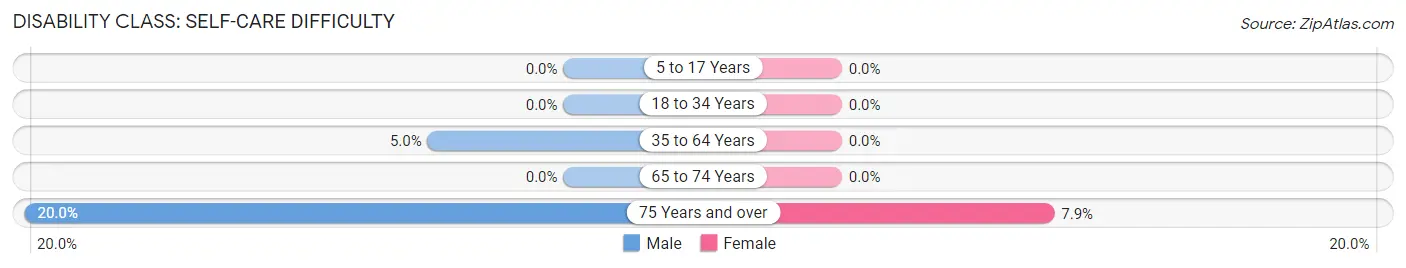
| Age Bracket | Male | Female |
| 5 to 17 Years | 0 (0.0%) | 0 (0.0%) |
| 18 to 34 Years | 0 (0.0%) | 0 (0.0%) |
| 35 to 64 Years | 6 (5.0%) | 0 (0.0%) |
| 65 to 74 Years | 0 (0.0%) | 0 (0.0%) |
| 75 Years and over | 6 (20.0%) | 3 (7.9%) |
Technology Access in Oak City
Computing Device Access in Oak City
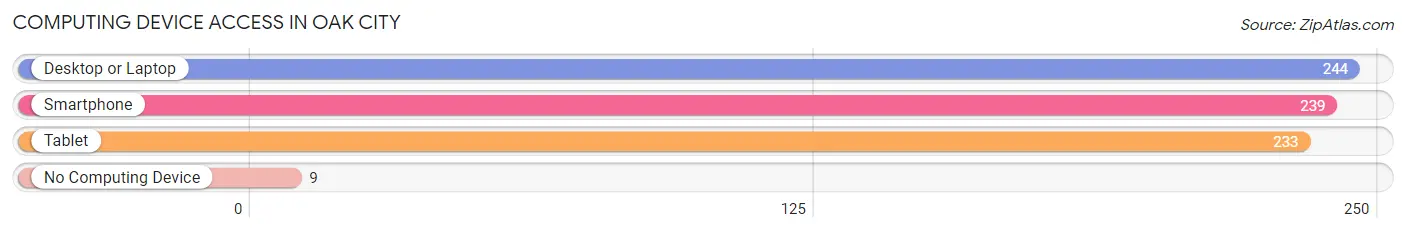
| Device Type | # Households | % Households |
| Desktop or Laptop | 244 | 91.7% |
| Smartphone | 239 | 89.8% |
| Tablet | 233 | 87.6% |
| No Computing Device | 9 | 3.4% |
| Total | 266 | 100.0% |
Internet Access in Oak City
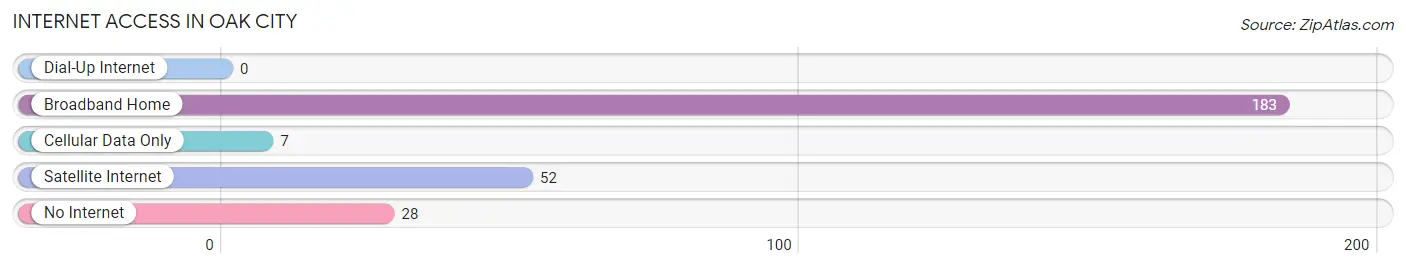
| Internet Type | # Households | % Households |
| Dial-Up Internet | 0 | 0.0% |
| Broadband Home | 183 | 68.8% |
| Cellular Data Only | 7 | 2.6% |
| Satellite Internet | 52 | 19.6% |
| No Internet | 28 | 10.5% |
| Total | 266 | 100.0% |
Oak City Summary
City of Oak City
Oak City is a small city located in the southeastern corner of Utah, United States. It is the county seat of Millard County and is located in the Great Basin region of the state. The city is situated at the base of the Wasatch Mountains and is surrounded by the Sevier Desert. The city is home to a population of approximately 1,500 people and is the largest city in Millard County.
History
Oak City was founded in 1864 by a group of Mormon settlers led by John D. Lee. The settlers were looking for a place to settle and build a community. The area was chosen because of its proximity to the Sevier River, which provided a reliable source of water for the settlers. The settlers named the town after the oak trees that grew in the area.
The town quickly grew and by 1868, it had become the county seat of Millard County. The town was incorporated in 1872 and the first mayor was elected in 1873.
In the late 1800s, Oak City was a thriving agricultural community. The town was known for its production of hay, grain, and livestock. The town also had a thriving lumber industry and was home to several sawmills.
In the early 1900s, the town began to experience a decline in population as many of the residents moved away to larger cities. The Great Depression also had a negative impact on the town and many of the businesses closed.
In the 1950s, the town began to experience a resurgence in population as many of the residents returned to the area. The town also began to experience an economic boom as the nearby oil fields began to produce oil.
Geography
Oak City is located in the southeastern corner of Utah, United States. It is situated at the base of the Wasatch Mountains and is surrounded by the Sevier Desert. The city is located at an elevation of 4,890 feet above sea level.
The city has a total area of 1.3 square miles, all of which is land. The city is located in a semi-arid climate zone and experiences hot summers and cold winters. The average annual temperature is 54 degrees Fahrenheit.
Economy
Oak City’s economy is largely based on agriculture and oil production. The city is home to several farms and ranches that produce hay, grain, and livestock. The city is also home to several oil fields that produce oil and natural gas.
The city is also home to several businesses that provide goods and services to the local population. These businesses include restaurants, retail stores, and auto repair shops.
Demographics
As of the 2010 census, Oak City had a population of 1,500 people. The racial makeup of the city was 95.3% White, 0.7% Native American, 0.3% Asian, 0.2% Pacific Islander, 0.2% from other races, and 3.3% from two or more races. Hispanic or Latino of any race were 2.7% of the population.
The median household income in Oak City was $37,500 and the median family income was $41,250. The per capita income for the city was $17,500. About 11.7% of families and 14.3% of the population were below the poverty line, including 18.2% of those under age 18 and 8.3% of those age 65 or over.
Common Questions
What is Per Capita Income in Oak City?
Per Capita income in Oak City is $28,561.
What is the Median Family Income in Oak City?
Median Family Income in Oak City is $69,081.
What is the Median Household income in Oak City?
Median Household Income in Oak City is $69,075.
What is Inequality or Gini Index in Oak City?
Inequality or Gini Index in Oak City is 0.27.
What is the Total Population of Oak City?
Total Population of Oak City is 795.
What is the Total Male Population of Oak City?
Total Male Population of Oak City is 407.
What is the Total Female Population of Oak City?
Total Female Population of Oak City is 388.
What is the Ratio of Males per 100 Females in Oak City?
There are 104.90 Males per 100 Females in Oak City.
What is the Ratio of Females per 100 Males in Oak City?
There are 95.33 Females per 100 Males in Oak City.
What is the Median Population Age in Oak City?
Median Population Age in Oak City is 43.7 Years.
What is the Average Family Size in Oak City
Average Family Size in Oak City is 3.2 People.
What is the Average Household Size in Oak City
Average Household Size in Oak City is 3.0 People.
How Large is the Labor Force in Oak City?
There are 302 People in the Labor Forcein in Oak City.
What is the Percentage of People in the Labor Force in Oak City?
49.7% of People are in the Labor Force in Oak City.
What is the Unemployment Rate in Oak City?
Unemployment Rate in Oak City is 1.7%.