Kingston, UT Map & Demographics
Kingston Map
Kingston Overview
$16,219
PER CAPITA INCOME
53.9%
WAGE / INCOME GAP [ % ]
46.1¢/ $1
WAGE / INCOME GAP [ $ ]
0.46
INEQUALITY / GINI INDEX
362
TOTAL POPULATION
240
MALE POPULATION
122
FEMALE POPULATION
196.72
MALES / 100 FEMALES
50.83
FEMALES / 100 MALES
36.5
MEDIAN AGE
4.8
AVG FAMILY SIZE
3.9
AVG HOUSEHOLD SIZE
137
LABOR FORCE [ PEOPLE ]
46.0%
PERCENT IN LABOR FORCE
21.9%
UNEMPLOYMENT RATE
Kingston Zip Codes
Kingston Area Codes
Income in Kingston
Income Overview in Kingston
| Characteristic | Number | Measure |
| Per Capita Income | 362 | $16,219 |
| Median Family Income | 71 | $0 |
| Mean Family Income | 71 | $43,714 |
| Median Household Income | 93 | $0 |
| Mean Household Income | 93 | $46,605 |
| Income Deficit | 71 | $0 |
| Wage / Income Gap (%) | 362 | 53.86% |
| Wage / Income Gap ($) | 362 | 46.14¢ per $1 |
| Gini / Inequality Index | 362 | 0.46 |
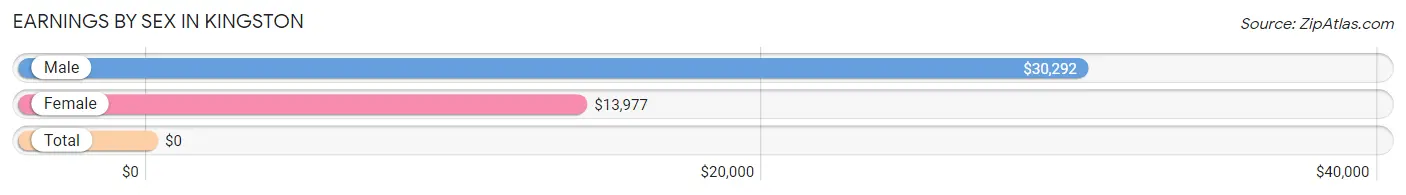
Earnings by Sex in Kingston
| Sex | Number | Average Earnings |
| Male | 119 (82.1%) | $30,292 |
| Female | 26 (17.9%) | $13,977 |
| Total | 145 (100.0%) | $0 |
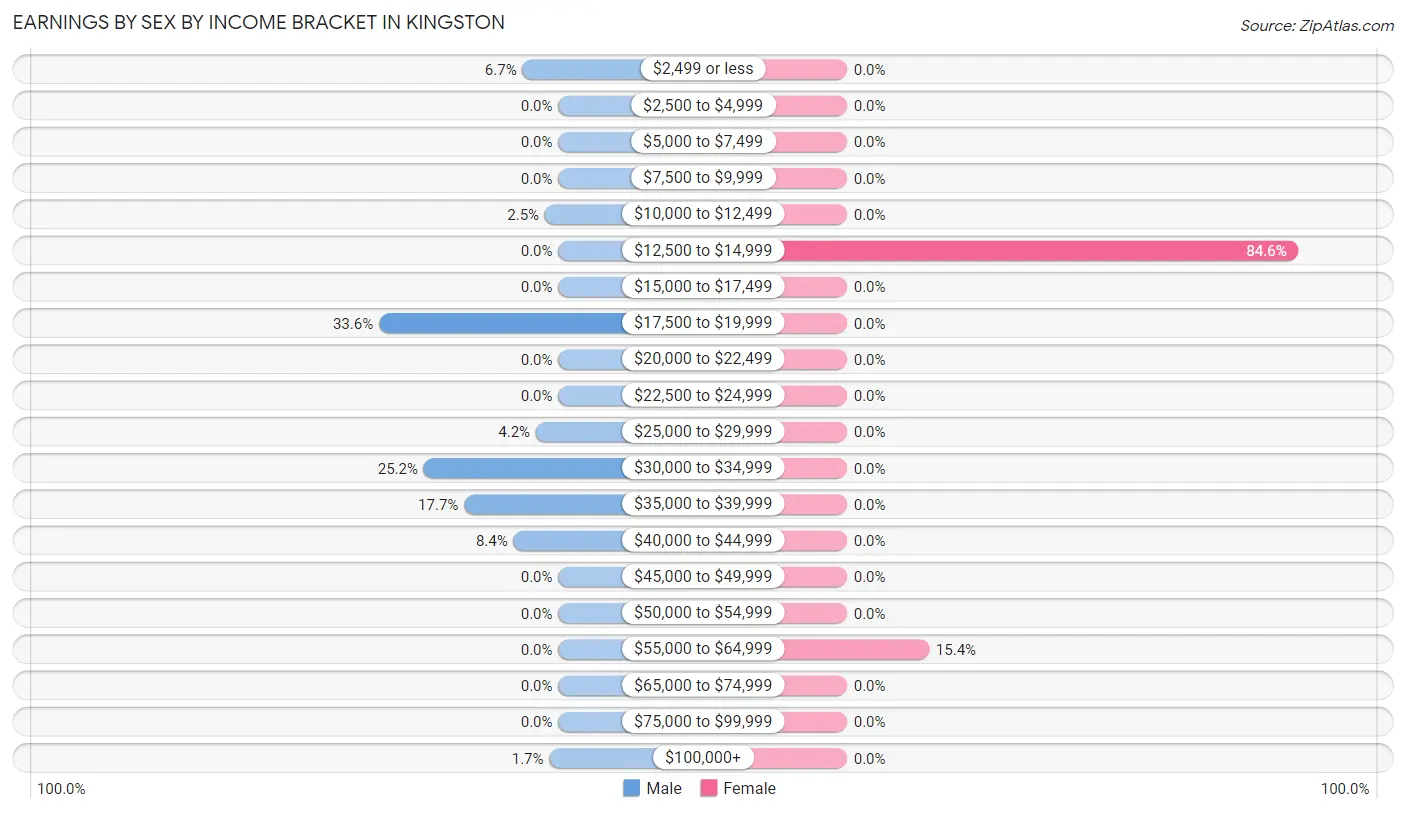
Earnings by Sex by Income Bracket in Kingston
The most common earnings brackets in Kingston are $17,500 to $19,999 for men (40 | 33.6%) and $12,500 to $14,999 for women (22 | 84.6%).
| Income | Male | Female |
| $2,499 or less | 8 (6.7%) | 0 (0.0%) |
| $2,500 to $4,999 | 0 (0.0%) | 0 (0.0%) |
| $5,000 to $7,499 | 0 (0.0%) | 0 (0.0%) |
| $7,500 to $9,999 | 0 (0.0%) | 0 (0.0%) |
| $10,000 to $12,499 | 3 (2.5%) | 0 (0.0%) |
| $12,500 to $14,999 | 0 (0.0%) | 22 (84.6%) |
| $15,000 to $17,499 | 0 (0.0%) | 0 (0.0%) |
| $17,500 to $19,999 | 40 (33.6%) | 0 (0.0%) |
| $20,000 to $22,499 | 0 (0.0%) | 0 (0.0%) |
| $22,500 to $24,999 | 0 (0.0%) | 0 (0.0%) |
| $25,000 to $29,999 | 5 (4.2%) | 0 (0.0%) |
| $30,000 to $34,999 | 30 (25.2%) | 0 (0.0%) |
| $35,000 to $39,999 | 21 (17.6%) | 0 (0.0%) |
| $40,000 to $44,999 | 10 (8.4%) | 0 (0.0%) |
| $45,000 to $49,999 | 0 (0.0%) | 0 (0.0%) |
| $50,000 to $54,999 | 0 (0.0%) | 0 (0.0%) |
| $55,000 to $64,999 | 0 (0.0%) | 4 (15.4%) |
| $65,000 to $74,999 | 0 (0.0%) | 0 (0.0%) |
| $75,000 to $99,999 | 0 (0.0%) | 0 (0.0%) |
| $100,000+ | 2 (1.7%) | 0 (0.0%) |
| Total | 119 (100.0%) | 26 (100.0%) |
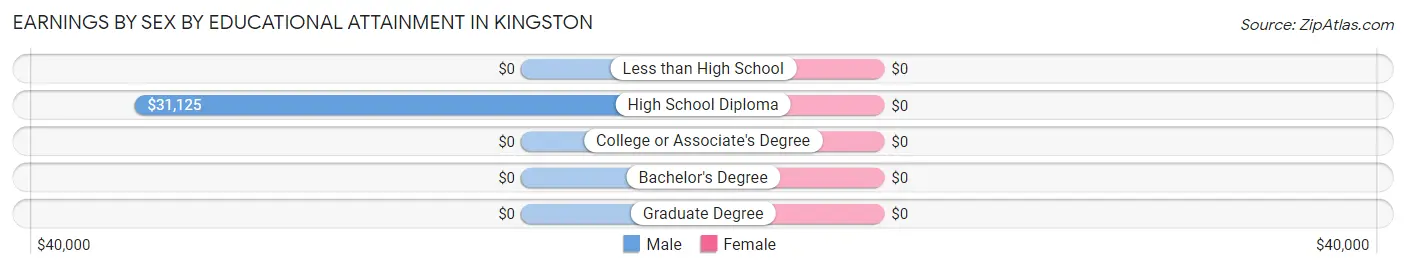
Earnings by Sex by Educational Attainment in Kingston
| Educational Attainment | Male Income | Female Income |
| Less than High School | - | - |
| High School Diploma | $31,125 | $0 |
| College or Associate's Degree | - | - |
| Bachelor's Degree | - | - |
| Graduate Degree | - | - |
| Total | $32,417 | $13,977 |
Family Income in Kingston
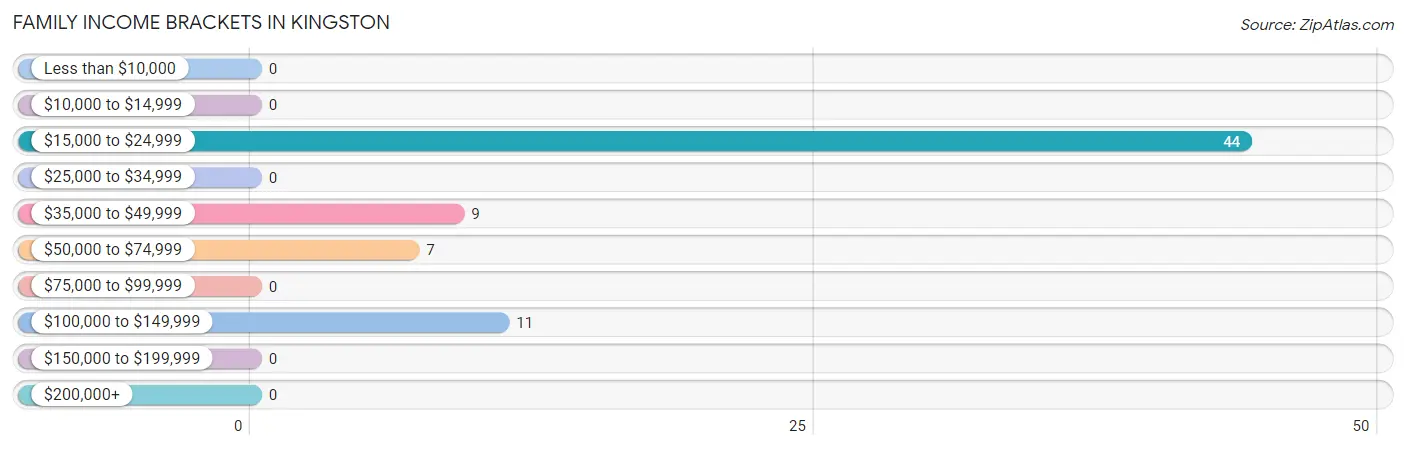
Family Income Brackets in Kingston
According to the Kingston family income data, there are 44 families falling into the $15,000 to $24,999 income range, which is the most common income bracket and makes up 62.0% of all families.
| Income Bracket | # Families | % Families |
| Less than $10,000 | 0 | 0.0% |
| $10,000 to $14,999 | 0 | 0.0% |
| $15,000 to $24,999 | 44 | 62.0% |
| $25,000 to $34,999 | 0 | 0.0% |
| $35,000 to $49,999 | 9 | 12.7% |
| $50,000 to $74,999 | 7 | 9.9% |
| $75,000 to $99,999 | 0 | 0.0% |
| $100,000 to $149,999 | 11 | 15.5% |
| $150,000 to $199,999 | 0 | 0.0% |
| $200,000+ | 0 | 0.0% |
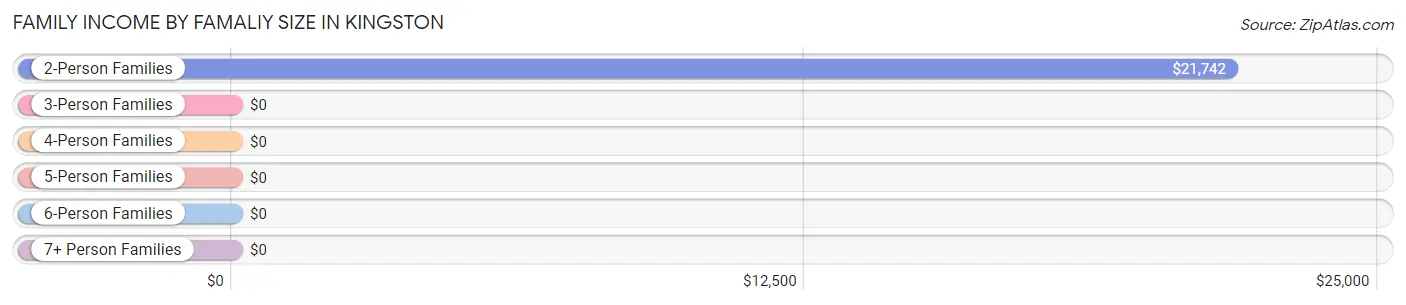
Family Income by Famaliy Size in Kingston
2-person families (46 | 64.8%) account for the highest median family income in Kingston with $21,742 per family, while 2-person families (46 | 64.8%) have the highest median income of $10,871 per family member.
| Income Bracket | # Families | Median Income |
| 2-Person Families | 46 (64.8%) | $21,742 |
| 3-Person Families | 3 (4.2%) | $0 |
| 4-Person Families | 0 (0.0%) | $0 |
| 5-Person Families | 0 (0.0%) | $0 |
| 6-Person Families | 11 (15.5%) | $0 |
| 7+ Person Families | 11 (15.5%) | $0 |
| Total | 71 (100.0%) | $0 |
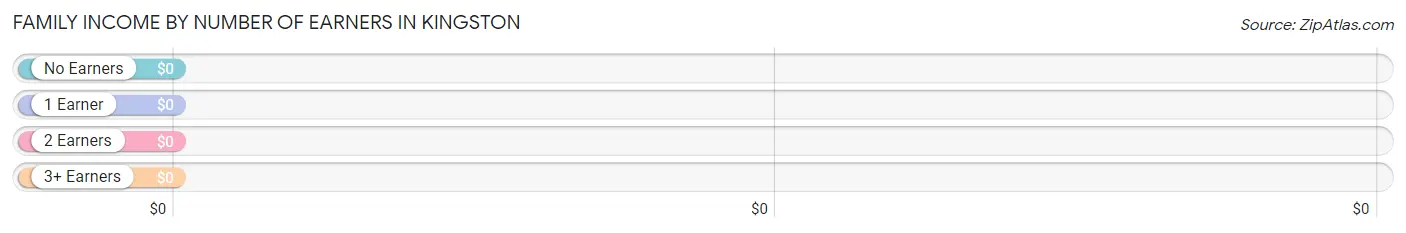
Family Income by Number of Earners in Kingston
| Number of Earners | # Families | Median Income |
| No Earners | 35 (49.3%) | $0 |
| 1 Earner | 11 (15.5%) | $0 |
| 2 Earners | 14 (19.7%) | $0 |
| 3+ Earners | 11 (15.5%) | $0 |
| Total | 71 (100.0%) | $0 |
Household Income in Kingston
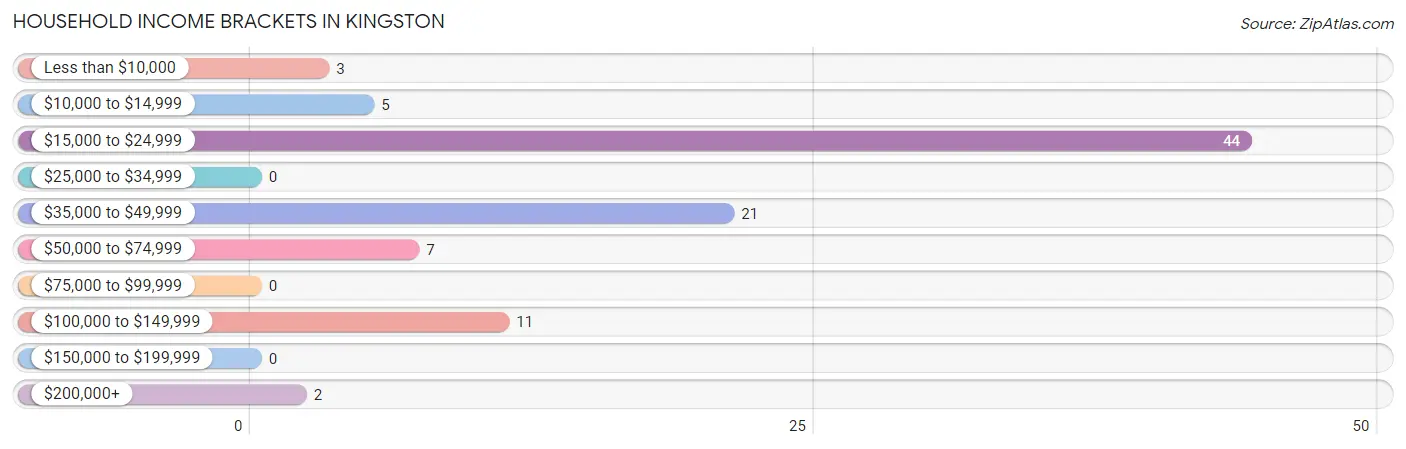
Household Income Brackets in Kingston
With 44 households falling in the category, the $15,000 to $24,999 income range is the most frequent in Kingston, accounting for 47.3% of all households.
| Income Bracket | # Households | % Households |
| Less than $10,000 | 3 | 3.2% |
| $10,000 to $14,999 | 5 | 5.4% |
| $15,000 to $24,999 | 44 | 47.3% |
| $25,000 to $34,999 | 0 | 0.0% |
| $35,000 to $49,999 | 21 | 22.6% |
| $50,000 to $74,999 | 7 | 7.5% |
| $75,000 to $99,999 | 0 | 0.0% |
| $100,000 to $149,999 | 11 | 11.8% |
| $150,000 to $199,999 | 0 | 0.0% |
| $200,000+ | 2 | 2.2% |
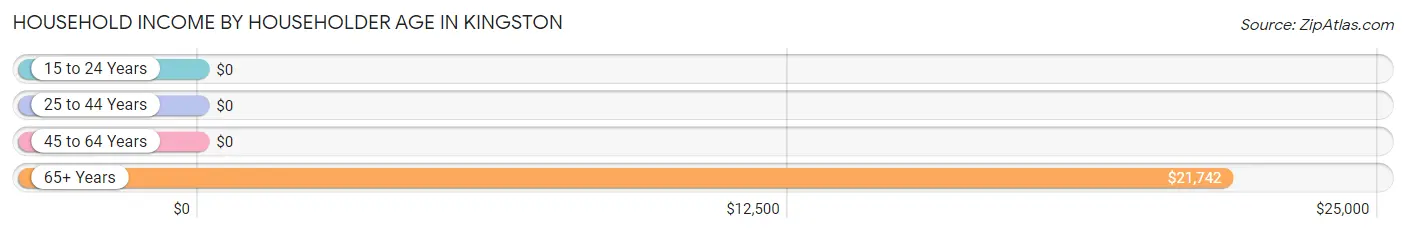
Household Income by Householder Age in Kingston
The median household income in Kingston is $0, with the highest median household income of $21,742 found in the 65+ years age bracket for the primary householder. A total of 62 households (66.7%) fall into this category.
| Income Bracket | # Households | Median Income |
| 15 to 24 Years | 0 (0.0%) | $0 |
| 25 to 44 Years | 5 (5.4%) | $0 |
| 45 to 64 Years | 26 (28.0%) | $0 |
| 65+ Years | 62 (66.7%) | $21,742 |
| Total | 93 (100.0%) | $0 |
Poverty in Kingston
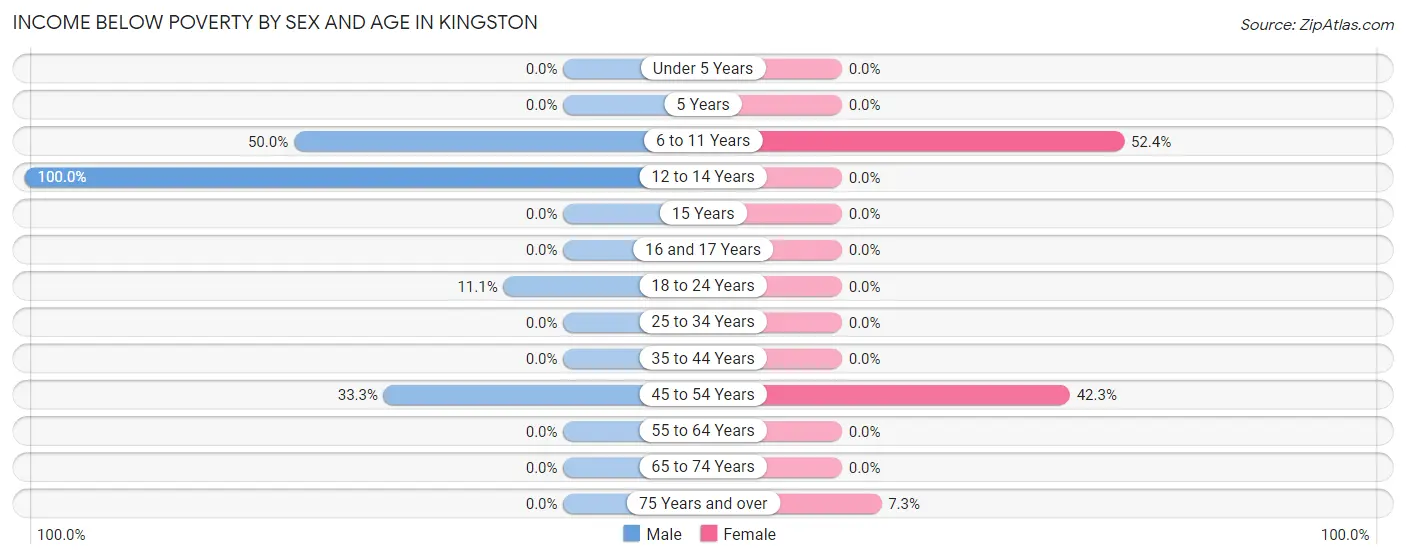
Income Below Poverty by Sex and Age in Kingston
With 17.1% poverty level for males and 20.5% for females among the residents of Kingston, 12 to 14 year old males and 6 to 11 year old females are the most vulnerable to poverty, with 11 males (100.0%) and 11 females (52.4%) in their respective age groups living below the poverty level.
| Age Bracket | Male | Female |
| Under 5 Years | 0 (0.0%) | 0 (0.0%) |
| 5 Years | 0 (0.0%) | 0 (0.0%) |
| 6 to 11 Years | 11 (50.0%) | 11 (52.4%) |
| 12 to 14 Years | 11 (100.0%) | 0 (0.0%) |
| 15 Years | 0 (0.0%) | 0 (0.0%) |
| 16 and 17 Years | 0 (0.0%) | 0 (0.0%) |
| 18 to 24 Years | 8 (11.1%) | 0 (0.0%) |
| 25 to 34 Years | 0 (0.0%) | 0 (0.0%) |
| 35 to 44 Years | 0 (0.0%) | 0 (0.0%) |
| 45 to 54 Years | 11 (33.3%) | 11 (42.3%) |
| 55 to 64 Years | 0 (0.0%) | 0 (0.0%) |
| 65 to 74 Years | 0 (0.0%) | 0 (0.0%) |
| 75 Years and over | 0 (0.0%) | 3 (7.3%) |
| Total | 41 (17.1%) | 25 (20.5%) |
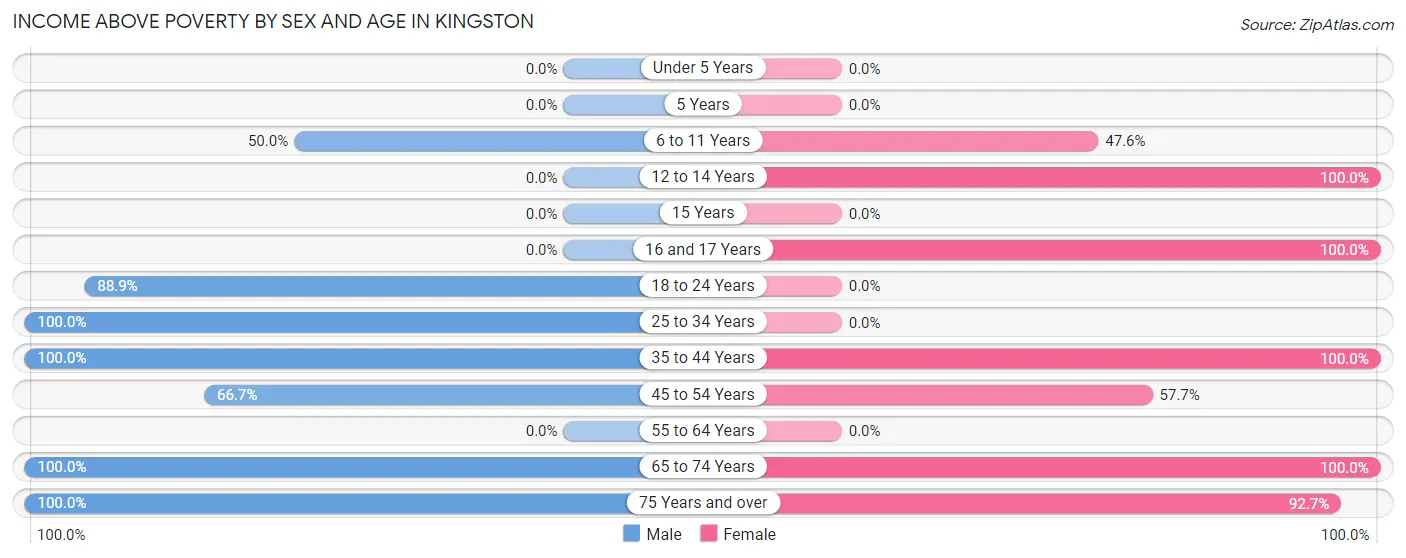
Income Above Poverty by Sex and Age in Kingston
According to the poverty statistics in Kingston, males aged 25 to 34 years and females aged 12 to 14 years are the age groups that are most secure financially, with 100.0% of males and 100.0% of females in these age groups living above the poverty line.
| Age Bracket | Male | Female |
| Under 5 Years | 0 (0.0%) | 0 (0.0%) |
| 5 Years | 0 (0.0%) | 0 (0.0%) |
| 6 to 11 Years | 11 (50.0%) | 10 (47.6%) |
| 12 to 14 Years | 0 (0.0%) | 10 (100.0%) |
| 15 Years | 0 (0.0%) | 0 (0.0%) |
| 16 and 17 Years | 0 (0.0%) | 7 (100.0%) |
| 18 to 24 Years | 64 (88.9%) | 0 (0.0%) |
| 25 to 34 Years | 23 (100.0%) | 0 (0.0%) |
| 35 to 44 Years | 30 (100.0%) | 3 (100.0%) |
| 45 to 54 Years | 22 (66.7%) | 15 (57.7%) |
| 55 to 64 Years | 0 (0.0%) | 0 (0.0%) |
| 65 to 74 Years | 11 (100.0%) | 14 (100.0%) |
| 75 Years and over | 38 (100.0%) | 38 (92.7%) |
| Total | 199 (82.9%) | 97 (79.5%) |
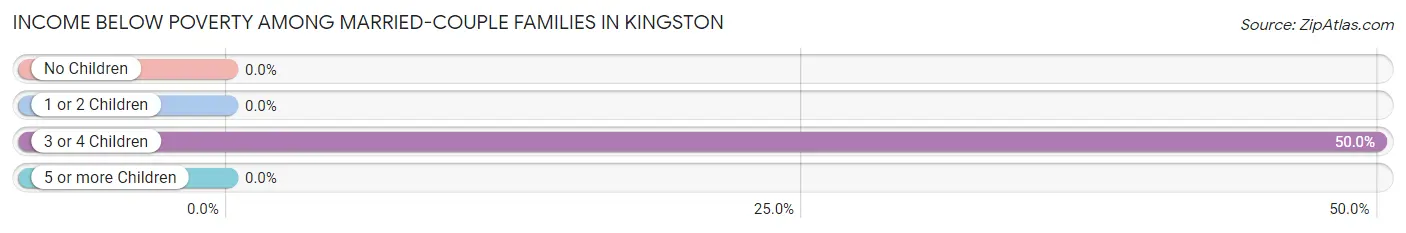
Income Below Poverty Among Married-Couple Families in Kingston
The poverty statistics for married-couple families in Kingston show that 17.2% or 11 of the total 64 families live below the poverty line. Families with 3 or 4 children have the highest poverty rate of 50.0%, comprising of 11 families. On the other hand, families with no children have the lowest poverty rate of 0.0%, which includes 0 families.
| Children | Above Poverty | Below Poverty |
| No Children | 42 (100.0%) | 0 (0.0%) |
| 1 or 2 Children | 0 (0.0%) | 0 (0.0%) |
| 3 or 4 Children | 11 (50.0%) | 11 (50.0%) |
| 5 or more Children | 0 (0.0%) | 0 (0.0%) |
| Total | 53 (82.8%) | 11 (17.2%) |
Income Below Poverty Among Single-Parent Households in Kingston
| Children | Single Father | Single Mother |
| No Children | 0 (0.0%) | 0 (0.0%) |
| 1 or 2 Children | 0 (0.0%) | 0 (0.0%) |
| 3 or 4 Children | 0 (0.0%) | 0 (0.0%) |
| 5 or more Children | 0 (0.0%) | 0 (0.0%) |
| Total | 0 (0.0%) | 0 (0.0%) |
Income Below Poverty Among Married-Couple vs Single-Parent Households in Kingston
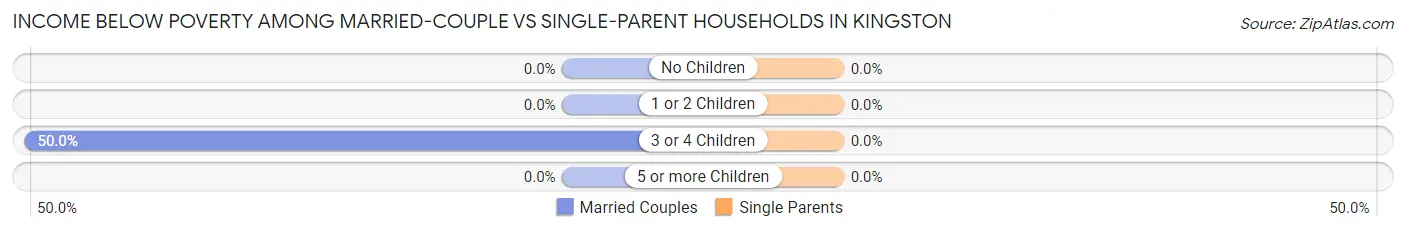
| Children | Married-Couple Families | Single-Parent Households |
| No Children | 0 (0.0%) | 0 (0.0%) |
| 1 or 2 Children | 0 (0.0%) | 0 (0.0%) |
| 3 or 4 Children | 11 (50.0%) | 0 (0.0%) |
| 5 or more Children | 0 (0.0%) | 0 (0.0%) |
| Total | 11 (17.2%) | 0 (0.0%) |
Race in Kingston
The most populous races in Kingston are , and White / Caucasian (362 | 100.0%).
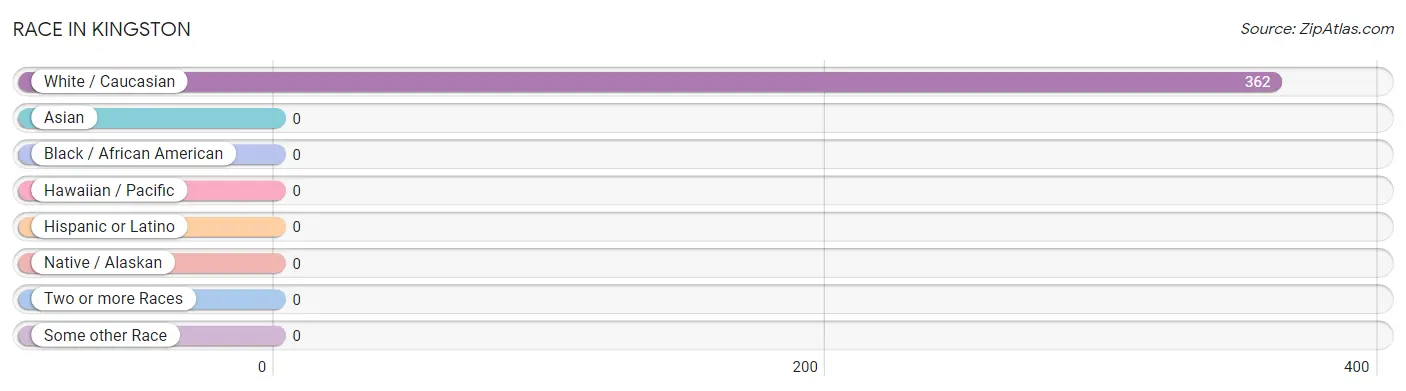
| Race | # Population | % Population |
| Asian | 0 | 0.0% |
| Black / African American | 0 | 0.0% |
| Hawaiian / Pacific | 0 | 0.0% |
| Hispanic or Latino | 0 | 0.0% |
| Native / Alaskan | 0 | 0.0% |
| White / Caucasian | 362 | 100.0% |
| Two or more Races | 0 | 0.0% |
| Some other Race | 0 | 0.0% |
| Total | 362 | 100.0% |
Ancestry in Kingston
The most populous ancestries reported in Kingston are English (227 | 62.7%), Danish (57 | 15.8%), Polish (52 | 14.4%), Irish (41 | 11.3%), and French (11 | 3.0%), together accounting for 107.2% of all Kingston residents.
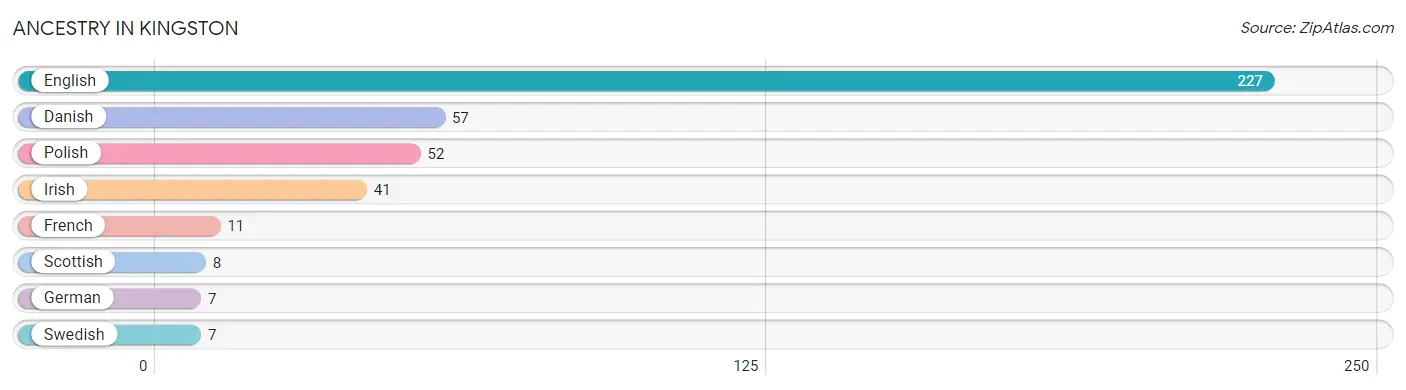
| Ancestry | # Population | % Population |
| Danish | 57 | 15.8% |
| English | 227 | 62.7% |
| French | 11 | 3.0% |
| German | 7 | 1.9% |
| Irish | 41 | 11.3% |
| Polish | 52 | 14.4% |
| Scottish | 8 | 2.2% |
| Swedish | 7 | 1.9% | View All 8 Rows |
Immigrants in Kingston

| Immigration Origin | # Population | % Population | View All 0 Rows |
Sex and Age in Kingston
Sex and Age in Kingston
The most populous age groups in Kingston are 20 to 24 Years (61 | 25.4%) for men and 75 to 79 Years (38 | 31.1%) for women.
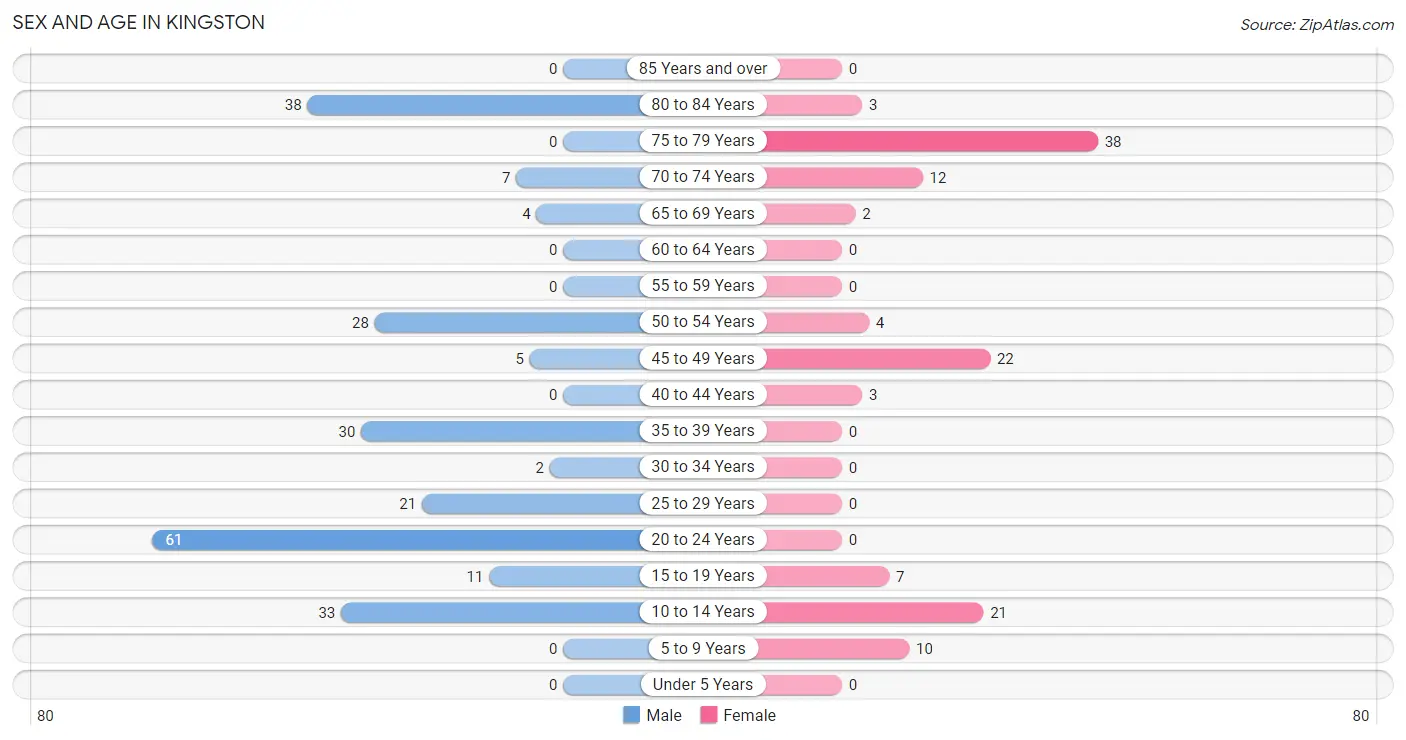
| Age Bracket | Male | Female |
| Under 5 Years | 0 (0.0%) | 0 (0.0%) |
| 5 to 9 Years | 0 (0.0%) | 10 (8.2%) |
| 10 to 14 Years | 33 (13.8%) | 21 (17.2%) |
| 15 to 19 Years | 11 (4.6%) | 7 (5.7%) |
| 20 to 24 Years | 61 (25.4%) | 0 (0.0%) |
| 25 to 29 Years | 21 (8.7%) | 0 (0.0%) |
| 30 to 34 Years | 2 (0.8%) | 0 (0.0%) |
| 35 to 39 Years | 30 (12.5%) | 0 (0.0%) |
| 40 to 44 Years | 0 (0.0%) | 3 (2.5%) |
| 45 to 49 Years | 5 (2.1%) | 22 (18.0%) |
| 50 to 54 Years | 28 (11.7%) | 4 (3.3%) |
| 55 to 59 Years | 0 (0.0%) | 0 (0.0%) |
| 60 to 64 Years | 0 (0.0%) | 0 (0.0%) |
| 65 to 69 Years | 4 (1.7%) | 2 (1.6%) |
| 70 to 74 Years | 7 (2.9%) | 12 (9.8%) |
| 75 to 79 Years | 0 (0.0%) | 38 (31.1%) |
| 80 to 84 Years | 38 (15.8%) | 3 (2.5%) |
| 85 Years and over | 0 (0.0%) | 0 (0.0%) |
| Total | 240 (100.0%) | 122 (100.0%) |
Families and Households in Kingston
Median Family Size in Kingston
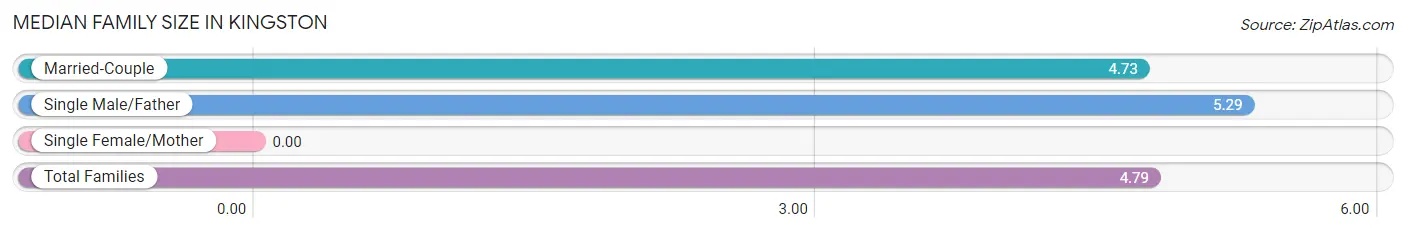
| Family Type | # Families | Family Size |
| Married-Couple | 64 (90.1%) | 4.73 |
| Single Male/Father | 7 (9.9%) | 5.29 |
| Single Female/Mother | 0 (0.0%) | - |
| Total Families | 71 (100.0%) | 4.79 |
Median Household Size in Kingston
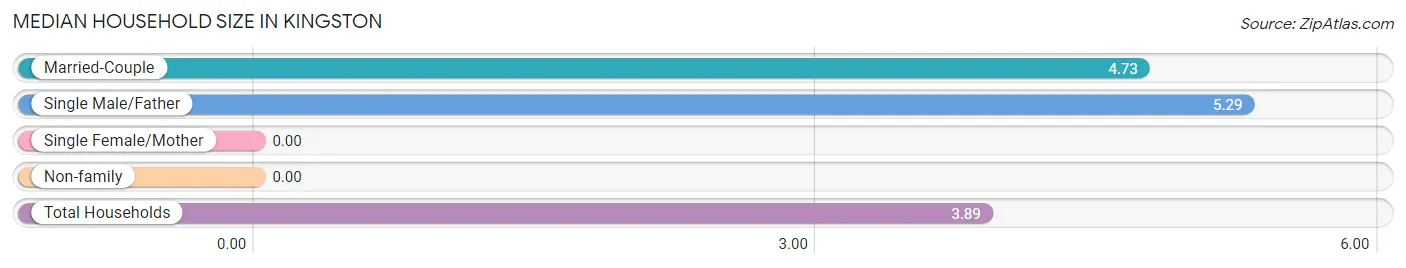
| Household Type | # Households | Household Size |
| Married-Couple | 64 (68.8%) | 4.73 |
| Single Male/Father | 7 (7.5%) | 5.29 |
| Single Female/Mother | 0 (0.0%) | - |
| Non-family | 22 (23.7%) | - |
| Total Households | 93 (100.0%) | 3.89 |
Household Size by Marriage Status in Kingston
Out of a total of 93 households in Kingston, 71 (76.3%) are family households, while 22 (23.7%) are nonfamily households. The most numerous type of family households are 2-person households, comprising 46, and the most common type of nonfamily households are 1-person households, comprising 22.
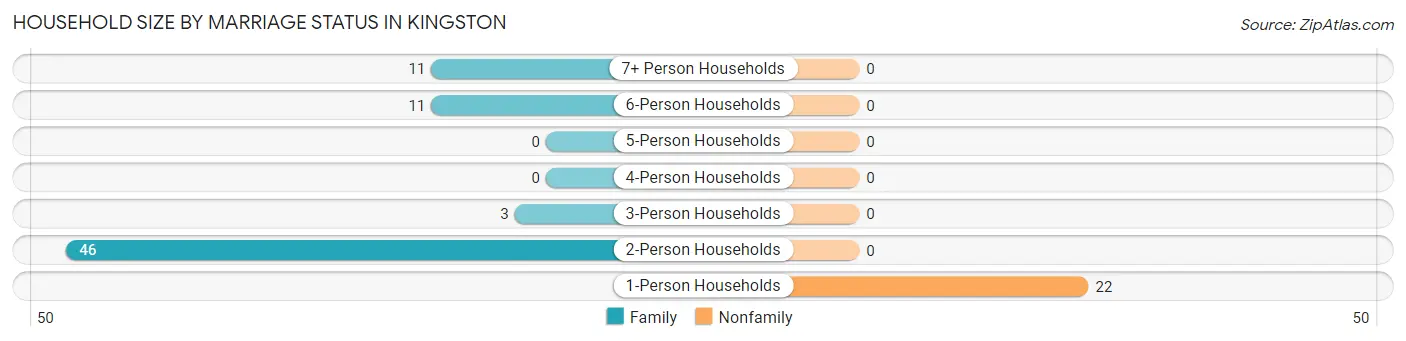
| Household Size | Family Households | Nonfamily Households |
| 1-Person Households | - | 22 (23.7%) |
| 2-Person Households | 46 (49.5%) | 0 (0.0%) |
| 3-Person Households | 3 (3.2%) | 0 (0.0%) |
| 4-Person Households | 0 (0.0%) | 0 (0.0%) |
| 5-Person Households | 0 (0.0%) | 0 (0.0%) |
| 6-Person Households | 11 (11.8%) | 0 (0.0%) |
| 7+ Person Households | 11 (11.8%) | 0 (0.0%) |
| Total | 71 (76.3%) | 22 (23.7%) |
Female Fertility in Kingston
Fertility by Age in Kingston
| Age Bracket | Women with Births | Births / 1,000 Women |
| 15 to 19 years | 0 (0.0%) | 0.0 |
| 20 to 34 years | 0 (0.0%) | 0.0 |
| 35 to 50 years | 0 (0.0%) | 0.0 |
| Total | 0 (0.0%) | 0.0 |
Fertility by Age by Marriage Status in Kingston
| Age Bracket | Married | Unmarried |
| 15 to 19 years | 0 (0.0%) | 0 (0.0%) |
| 20 to 34 years | 0 (0.0%) | 0 (0.0%) |
| 35 to 50 years | 0 (0.0%) | 0 (0.0%) |
| Total | 0 (0.0%) | 0 (0.0%) |
Fertility by Education in Kingston
| Educational Attainment | Women with Births | Births / 1,000 Women |
| Less than High School | 0 (0.0%) | 0.0 |
| High School Diploma | 0 (0.0%) | 0.0 |
| College or Associate's Degree | 0 (0.0%) | 0.0 |
| Bachelor's Degree | 0 (0.0%) | 0.0 |
| Graduate Degree | 0 (0.0%) | 0.0 |
| Total | 0 (0.0%) | 0.0 |
Fertility by Education by Marriage Status in Kingston
| Educational Attainment | Married | Unmarried |
| Less than High School | 0 (0.0%) | 0 (0.0%) |
| High School Diploma | 0 (0.0%) | 0 (0.0%) |
| College or Associate's Degree | 0 (0.0%) | 0 (0.0%) |
| Bachelor's Degree | 0 (0.0%) | 0 (0.0%) |
| Graduate Degree | 0 (0.0%) | 0 (0.0%) |
| Total | 0 (0.0%) | 0 (0.0%) |
Employment Characteristics in Kingston
Employment by Class of Employer in Kingston
Among the 107 employed individuals in Kingston, private company employees (105 | 98.1%), and unpaid family workers (2 | 1.9%) make up the most common classes of employment.
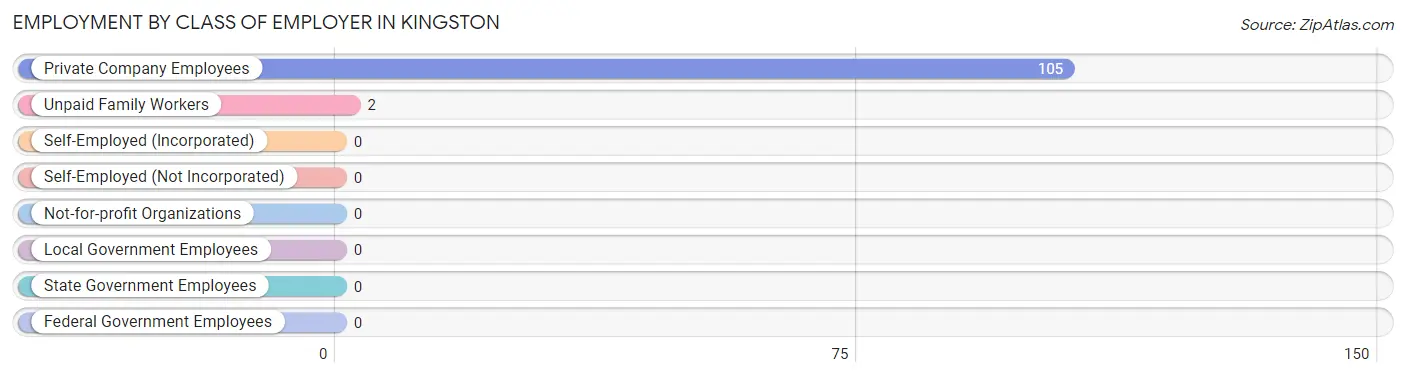
| Employer Class | # Employees | % Employees |
| Private Company Employees | 105 | 98.1% |
| Self-Employed (Incorporated) | 0 | 0.0% |
| Self-Employed (Not Incorporated) | 0 | 0.0% |
| Not-for-profit Organizations | 0 | 0.0% |
| Local Government Employees | 0 | 0.0% |
| State Government Employees | 0 | 0.0% |
| Federal Government Employees | 0 | 0.0% |
| Unpaid Family Workers | 2 | 1.9% |
| Total | 107 | 100.0% |
Employment Status by Age in Kingston
According to the labor force statistics for Kingston, out of the total population over 16 years of age (298), 46.0% or 137 individuals are in the labor force, with 21.9% or 30 of them unemployed. The age group with the highest labor force participation rate is 25 to 29 years, with 100.0% or 21 individuals in the labor force. Within the labor force, the 35 to 44 years age range has the highest percentage of unemployed individuals, with 100.0% or 30 of them being unemployed.
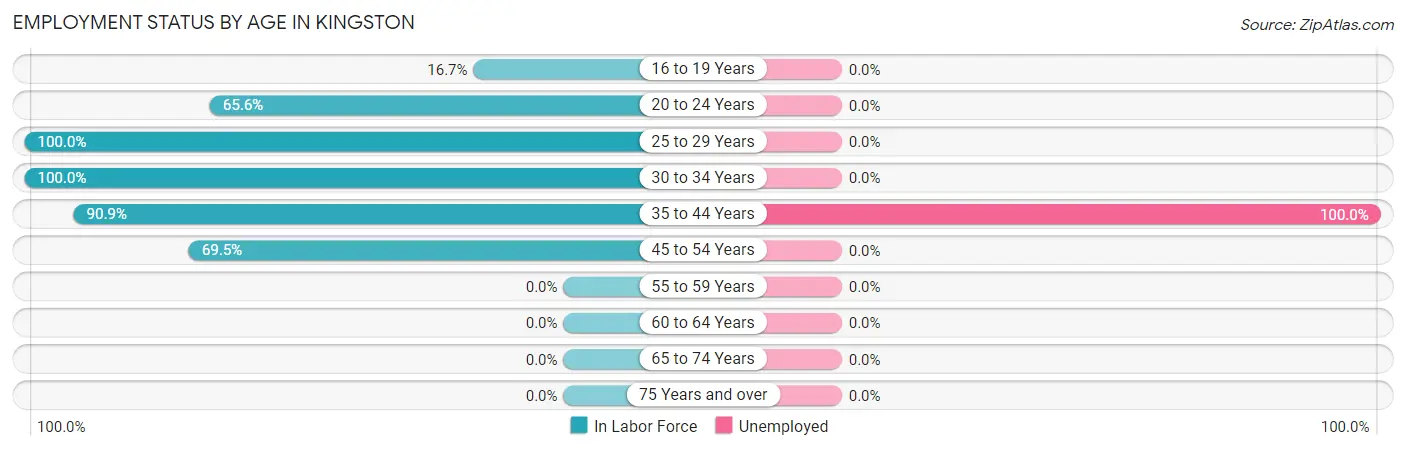
| Age Bracket | In Labor Force | Unemployed |
| 16 to 19 Years | 3 (16.7%) | 0 (0.0%) |
| 20 to 24 Years | 40 (65.6%) | 0 (0.0%) |
| 25 to 29 Years | 21 (100.0%) | 0 (0.0%) |
| 30 to 34 Years | 2 (100.0%) | 0 (0.0%) |
| 35 to 44 Years | 30 (90.9%) | 30 (100.0%) |
| 45 to 54 Years | 41 (69.5%) | 0 (0.0%) |
| 55 to 59 Years | 0 (0.0%) | 0 (0.0%) |
| 60 to 64 Years | 0 (0.0%) | 0 (0.0%) |
| 65 to 74 Years | 0 (0.0%) | 0 (0.0%) |
| 75 Years and over | 0 (0.0%) | 0 (0.0%) |
| Total | 137 (46.0%) | 30 (21.9%) |
Employment Status by Educational Attainment in Kingston
According to labor force statistics for Kingston, 81.7% of individuals (94) out of the total population between 25 and 64 years of age (115) are in the labor force, with 31.9% or 30 of them being unemployed. The group with the highest labor force participation rate are those with the educational attainment of less than high school, with 100.0% or 32 individuals in the labor force. Within the labor force, individuals with high school diploma education have the highest percentage of unemployment, with 81.1% or 30 of them being unemployed.
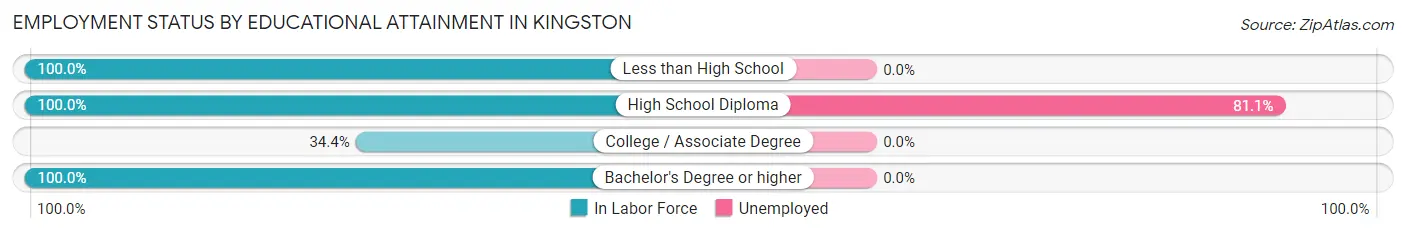
| Educational Attainment | In Labor Force | Unemployed |
| Less than High School | 32 (100.0%) | 0 (0.0%) |
| High School Diploma | 37 (100.0%) | 30 (81.1%) |
| College / Associate Degree | 11 (34.4%) | 0 (0.0%) |
| Bachelor's Degree or higher | 14 (100.0%) | 0 (0.0%) |
| Total | 94 (81.7%) | 37 (31.9%) |
Employment Occupations by Sex in Kingston
Management, Business, Science and Arts Occupations
The most common Management, Business, Science and Arts occupations in Kingston are Community & Social Service (4 | 3.7%), and Education Instruction & Library (4 | 3.7%).
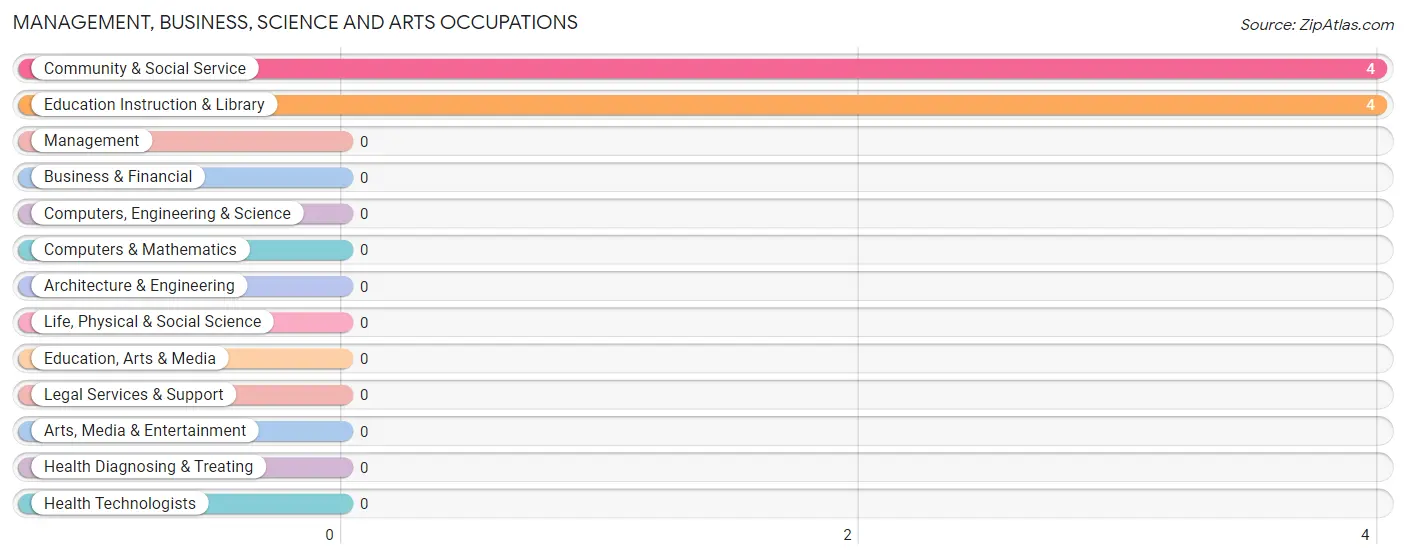
Management, Business, Science and Arts Occupations by Sex
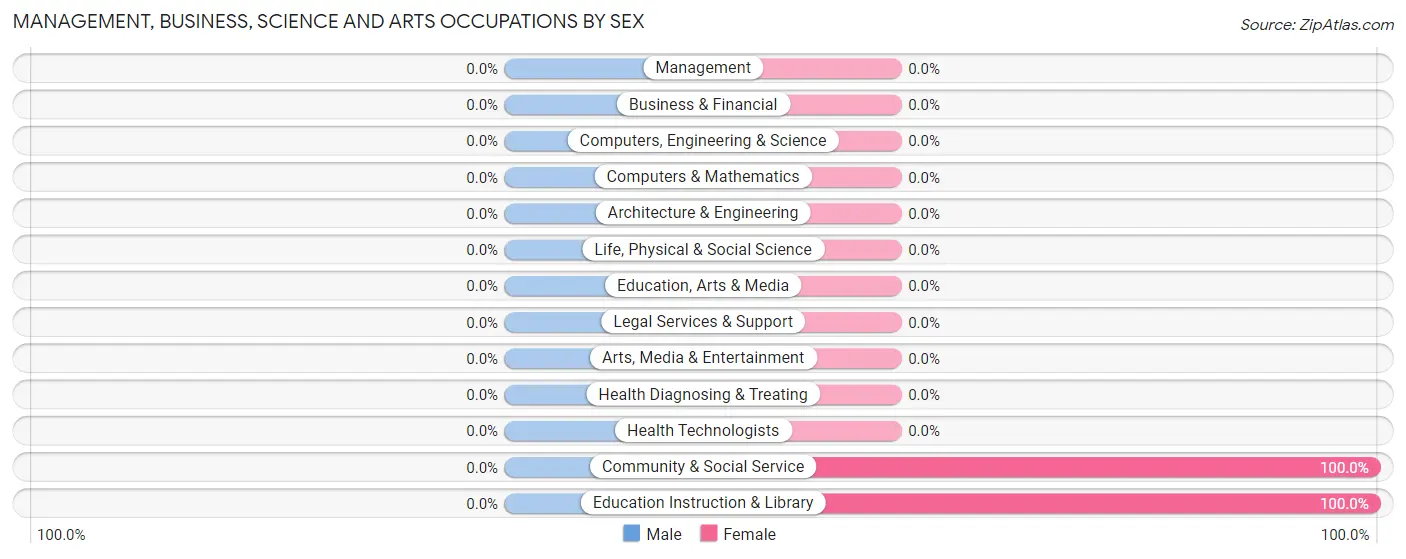
| Occupation | Male | Female |
| Management | 0 (0.0%) | 0 (0.0%) |
| Business & Financial | 0 (0.0%) | 0 (0.0%) |
| Computers, Engineering & Science | 0 (0.0%) | 0 (0.0%) |
| Computers & Mathematics | 0 (0.0%) | 0 (0.0%) |
| Architecture & Engineering | 0 (0.0%) | 0 (0.0%) |
| Life, Physical & Social Science | 0 (0.0%) | 0 (0.0%) |
| Community & Social Service | 0 (0.0%) | 4 (100.0%) |
| Education, Arts & Media | 0 (0.0%) | 0 (0.0%) |
| Legal Services & Support | 0 (0.0%) | 0 (0.0%) |
| Education Instruction & Library | 0 (0.0%) | 4 (100.0%) |
| Arts, Media & Entertainment | 0 (0.0%) | 0 (0.0%) |
| Health Diagnosing & Treating | 0 (0.0%) | 0 (0.0%) |
| Health Technologists | 0 (0.0%) | 0 (0.0%) |
| Total (Category) | 0 (0.0%) | 4 (100.0%) |
| Total (Overall) | 81 (75.7%) | 26 (24.3%) |
Services Occupations
The most common Services occupations in Kingston are , and Cleaning & Maintenance (11 | 10.3%).
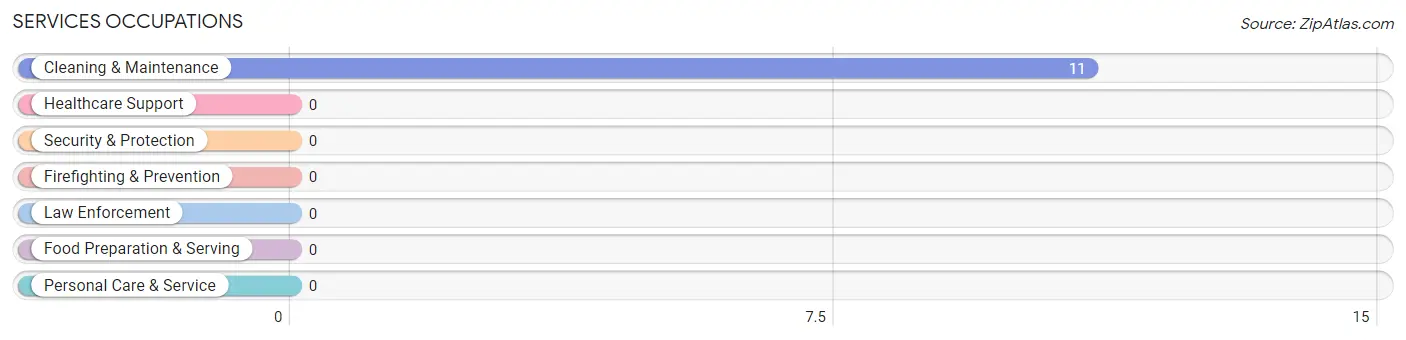
Services Occupations by Sex
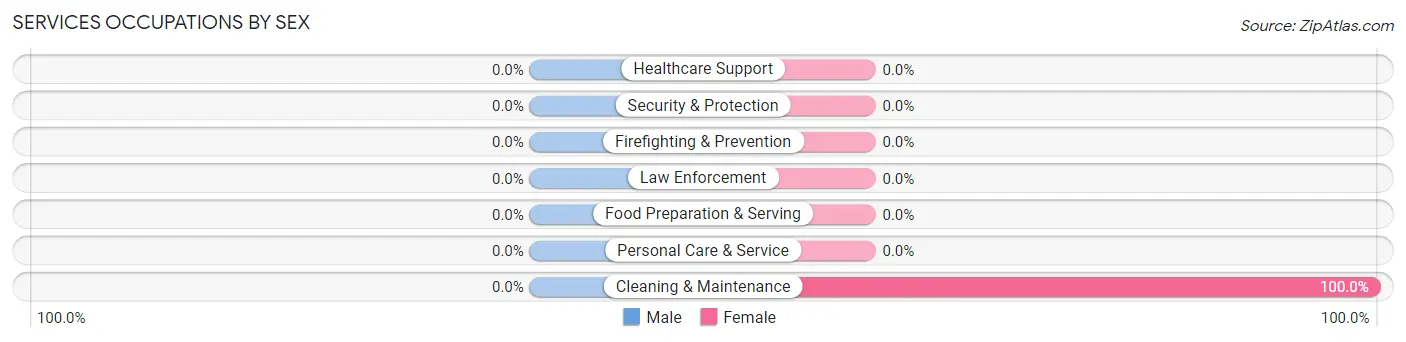
| Occupation | Male | Female |
| Healthcare Support | 0 (0.0%) | 0 (0.0%) |
| Security & Protection | 0 (0.0%) | 0 (0.0%) |
| Firefighting & Prevention | 0 (0.0%) | 0 (0.0%) |
| Law Enforcement | 0 (0.0%) | 0 (0.0%) |
| Food Preparation & Serving | 0 (0.0%) | 0 (0.0%) |
| Cleaning & Maintenance | 0 (0.0%) | 11 (100.0%) |
| Personal Care & Service | 0 (0.0%) | 0 (0.0%) |
| Total (Category) | 0 (0.0%) | 11 (100.0%) |
| Total (Overall) | 81 (75.7%) | 26 (24.3%) |
Sales and Office Occupations
The most common Sales and Office occupations in Kingston are , and Office & Administration (11 | 10.3%).
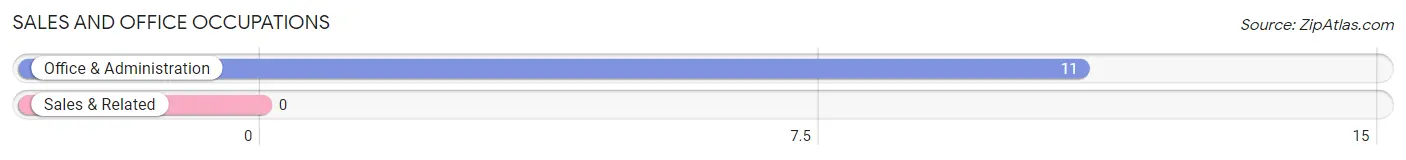
Sales and Office Occupations by Sex
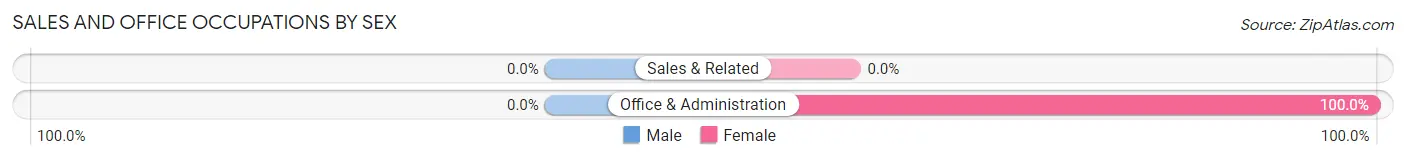
| Occupation | Male | Female |
| Sales & Related | 0 (0.0%) | 0 (0.0%) |
| Office & Administration | 0 (0.0%) | 11 (100.0%) |
| Total (Category) | 0 (0.0%) | 11 (100.0%) |
| Total (Overall) | 81 (75.7%) | 26 (24.3%) |
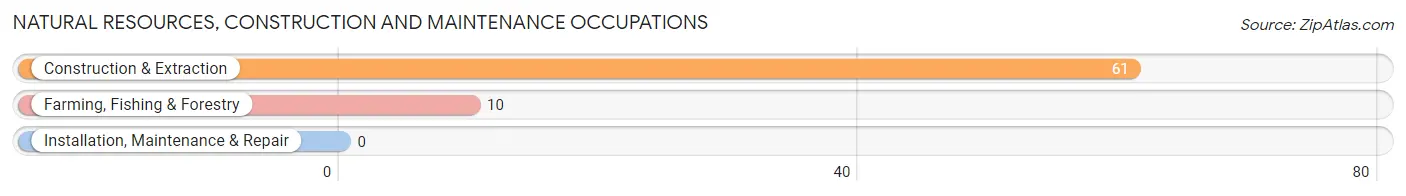
Natural Resources, Construction and Maintenance Occupations
The most common Natural Resources, Construction and Maintenance occupations in Kingston are Construction & Extraction (61 | 57.0%), and Farming, Fishing & Forestry (10 | 9.3%).
Natural Resources, Construction and Maintenance Occupations by Sex
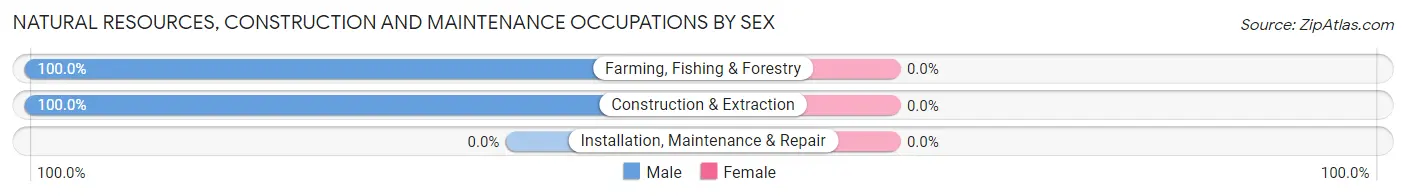
| Occupation | Male | Female |
| Farming, Fishing & Forestry | 10 (100.0%) | 0 (0.0%) |
| Construction & Extraction | 61 (100.0%) | 0 (0.0%) |
| Installation, Maintenance & Repair | 0 (0.0%) | 0 (0.0%) |
| Total (Category) | 71 (100.0%) | 0 (0.0%) |
| Total (Overall) | 81 (75.7%) | 26 (24.3%) |
Production, Transportation and Moving Occupations
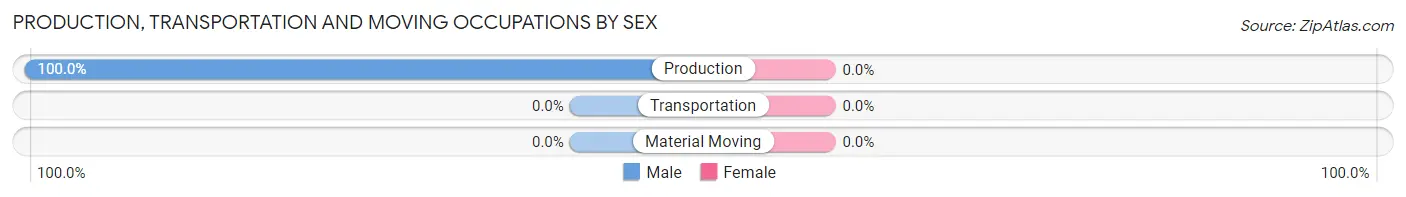
The most common Production, Transportation and Moving occupations in Kingston are , and Production (10 | 9.3%).
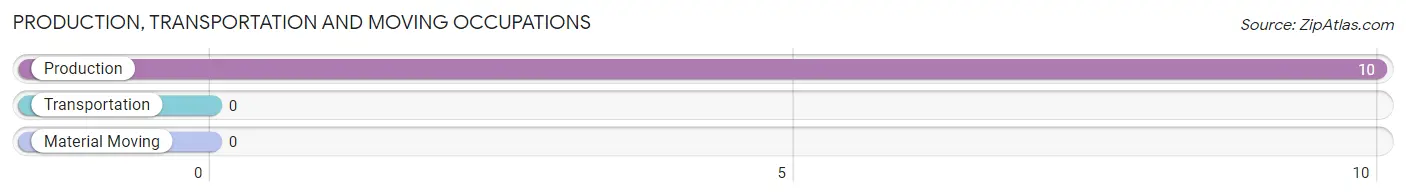
Production, Transportation and Moving Occupations by Sex
| Occupation | Male | Female |
| Production | 10 (100.0%) | 0 (0.0%) |
| Transportation | 0 (0.0%) | 0 (0.0%) |
| Material Moving | 0 (0.0%) | 0 (0.0%) |
| Total (Category) | 10 (100.0%) | 0 (0.0%) |
| Total (Overall) | 81 (75.7%) | 26 (24.3%) |
Employment Industries by Sex in Kingston
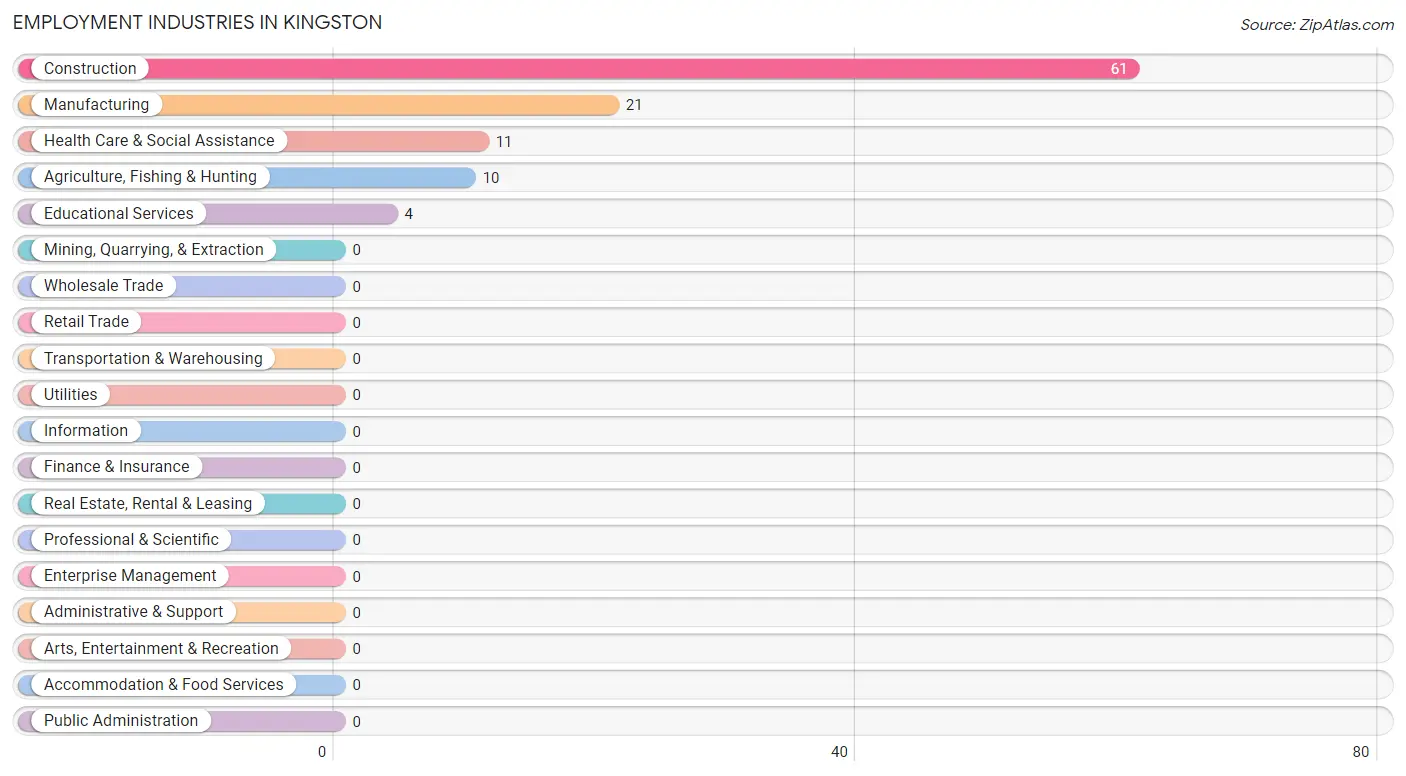
Employment Industries in Kingston
The major employment industries in Kingston include Construction (61 | 57.0%), Manufacturing (21 | 19.6%), Health Care & Social Assistance (11 | 10.3%), Agriculture, Fishing & Hunting (10 | 9.3%), and Educational Services (4 | 3.7%).
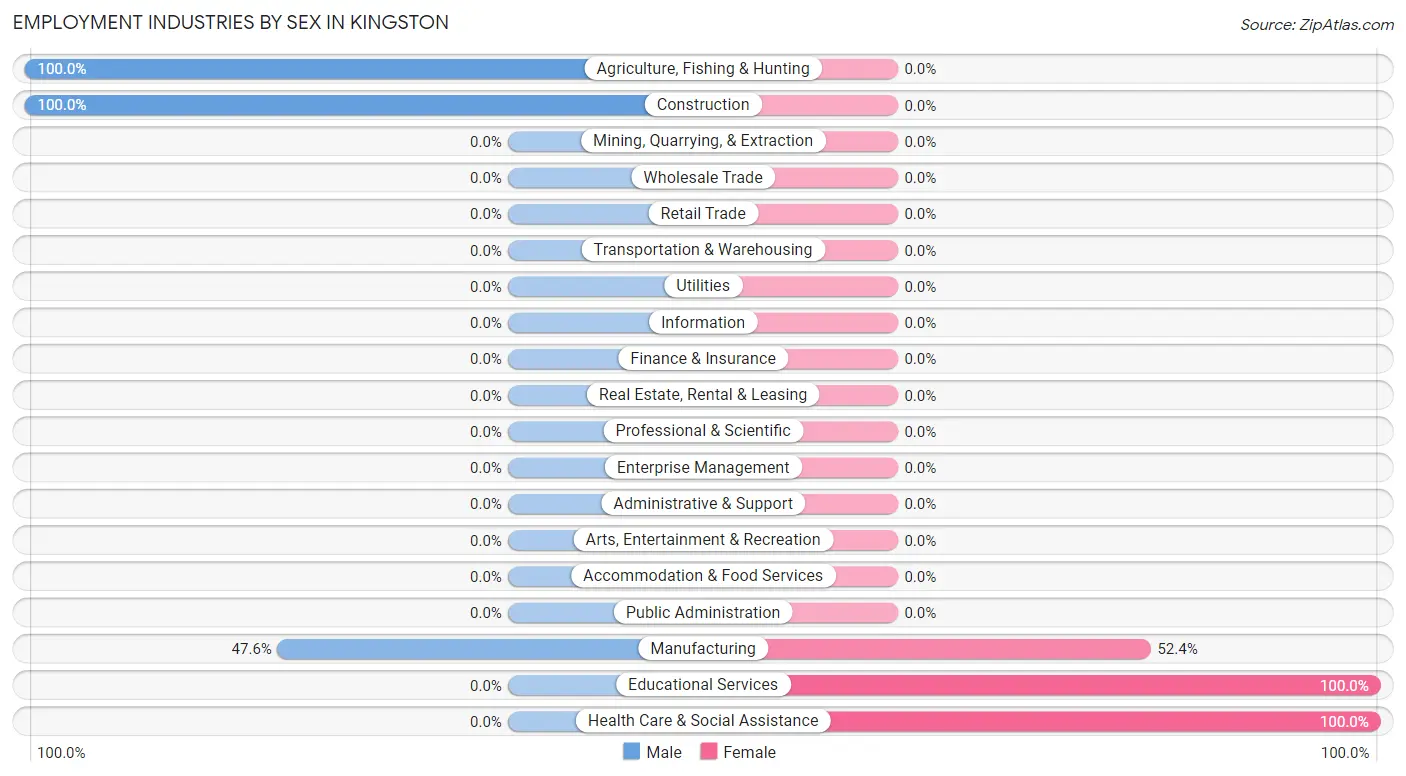
Employment Industries by Sex in Kingston
The Kingston industries that see more men than women are Agriculture, Fishing & Hunting (100.0%), Construction (100.0%), and Manufacturing (47.6%), whereas the industries that tend to have a higher number of women are Educational Services (100.0%), Health Care & Social Assistance (100.0%), and Manufacturing (52.4%).
| Industry | Male | Female |
| Agriculture, Fishing & Hunting | 10 (100.0%) | 0 (0.0%) |
| Mining, Quarrying, & Extraction | 0 (0.0%) | 0 (0.0%) |
| Construction | 61 (100.0%) | 0 (0.0%) |
| Manufacturing | 10 (47.6%) | 11 (52.4%) |
| Wholesale Trade | 0 (0.0%) | 0 (0.0%) |
| Retail Trade | 0 (0.0%) | 0 (0.0%) |
| Transportation & Warehousing | 0 (0.0%) | 0 (0.0%) |
| Utilities | 0 (0.0%) | 0 (0.0%) |
| Information | 0 (0.0%) | 0 (0.0%) |
| Finance & Insurance | 0 (0.0%) | 0 (0.0%) |
| Real Estate, Rental & Leasing | 0 (0.0%) | 0 (0.0%) |
| Professional & Scientific | 0 (0.0%) | 0 (0.0%) |
| Enterprise Management | 0 (0.0%) | 0 (0.0%) |
| Administrative & Support | 0 (0.0%) | 0 (0.0%) |
| Educational Services | 0 (0.0%) | 4 (100.0%) |
| Health Care & Social Assistance | 0 (0.0%) | 11 (100.0%) |
| Arts, Entertainment & Recreation | 0 (0.0%) | 0 (0.0%) |
| Accommodation & Food Services | 0 (0.0%) | 0 (0.0%) |
| Public Administration | 0 (0.0%) | 0 (0.0%) |
| Total | 81 (75.7%) | 26 (24.3%) |
Education in Kingston
School Enrollment in Kingston
The most common levels of schooling among the 79 students in Kingston are high school (36 | 45.6%), middle school (22 | 27.9%), and elementary school (21 | 26.6%).
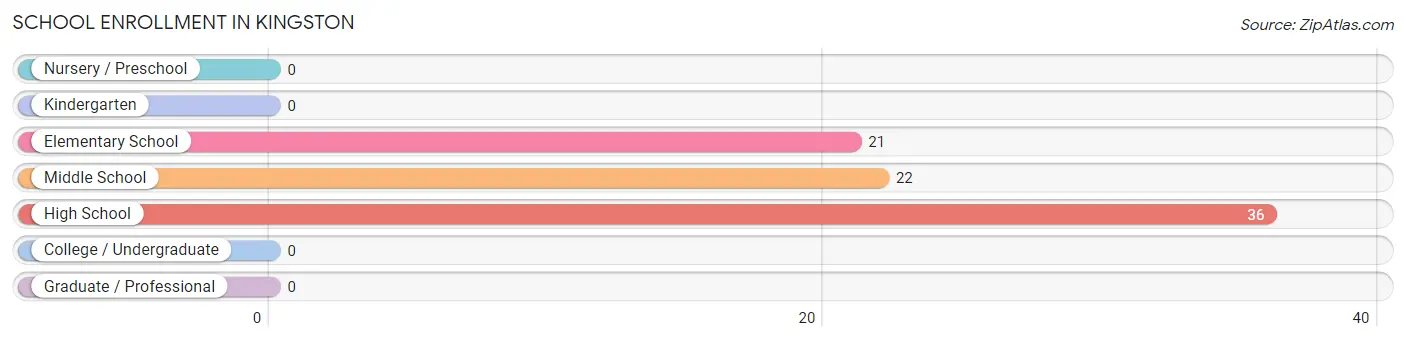
| School Level | # Students | % Students |
| Nursery / Preschool | 0 | 0.0% |
| Kindergarten | 0 | 0.0% |
| Elementary School | 21 | 26.6% |
| Middle School | 22 | 27.9% |
| High School | 36 | 45.6% |
| College / Undergraduate | 0 | 0.0% |
| Graduate / Professional | 0 | 0.0% |
| Total | 79 | 100.0% |
School Enrollment by Age by Funding Source in Kingston
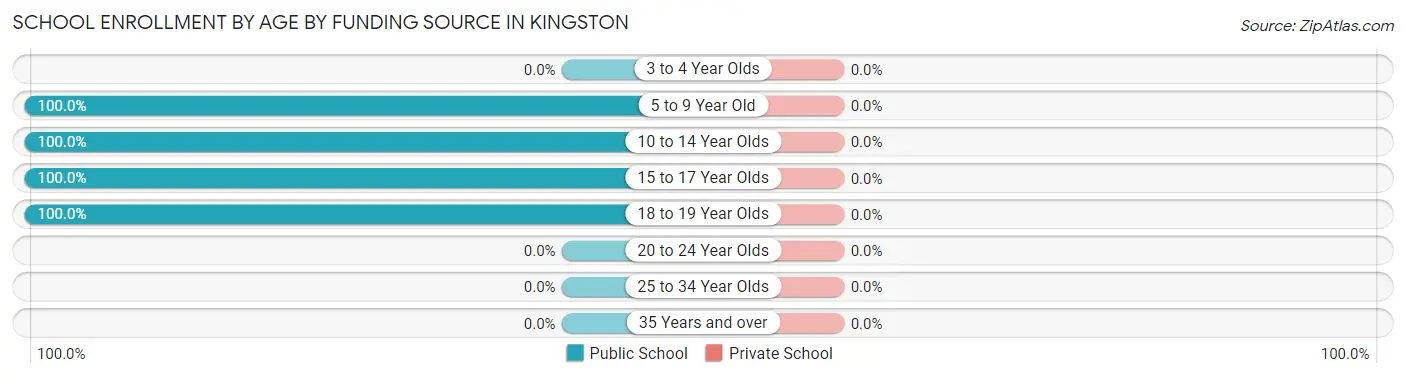
| Age Bracket | Public School | Private School |
| 3 to 4 Year Olds | 0 (0.0%) | 0 (0.0%) |
| 5 to 9 Year Old | 10 (100.0%) | 0 (0.0%) |
| 10 to 14 Year Olds | 54 (100.0%) | 0 (0.0%) |
| 15 to 17 Year Olds | 7 (100.0%) | 0 (0.0%) |
| 18 to 19 Year Olds | 8 (100.0%) | 0 (0.0%) |
| 20 to 24 Year Olds | 0 (0.0%) | 0 (0.0%) |
| 25 to 34 Year Olds | 0 (0.0%) | 0 (0.0%) |
| 35 Years and over | 0 (0.0%) | 0 (0.0%) |
| Total | 79 (100.0%) | 0 (0.0%) |
Educational Attainment by Field of Study in Kingston
Computers & mathematics (10 | 71.4%), and science & technology (4 | 28.6%) are the most common fields of study among 14 individuals in Kingston who have obtained a bachelor's degree or higher.
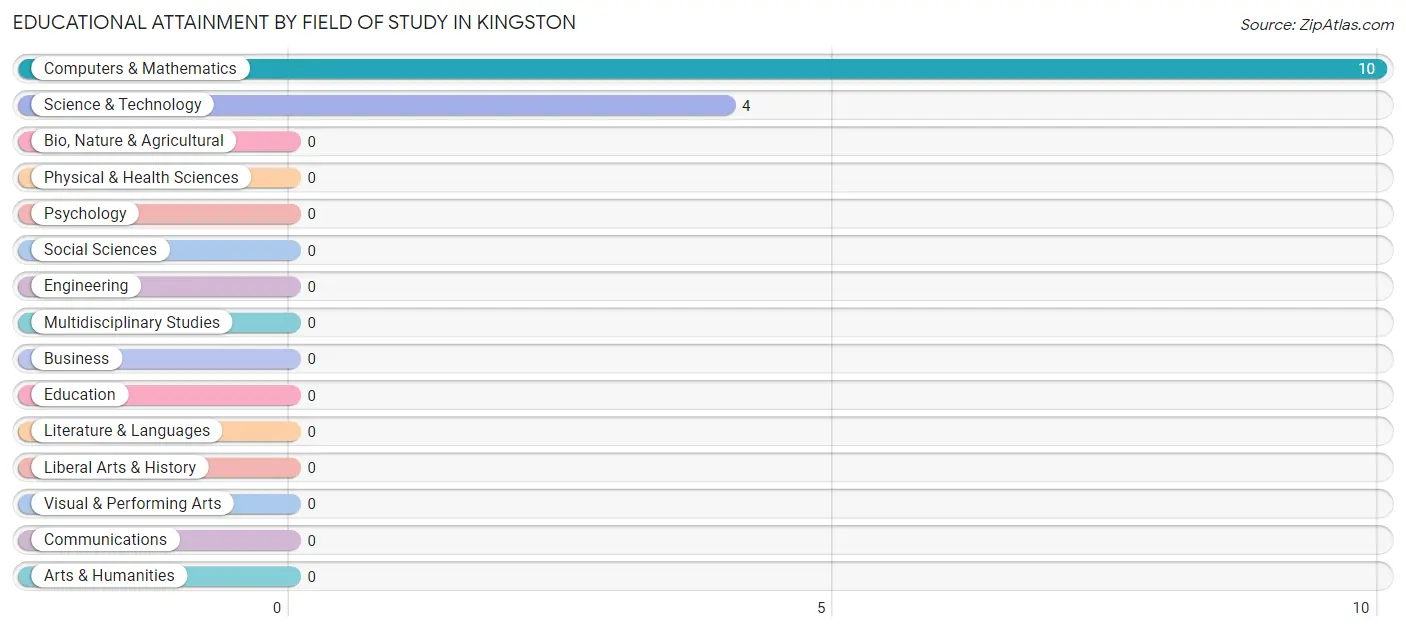
| Field of Study | # Graduates | % Graduates |
| Computers & Mathematics | 10 | 71.4% |
| Bio, Nature & Agricultural | 0 | 0.0% |
| Physical & Health Sciences | 0 | 0.0% |
| Psychology | 0 | 0.0% |
| Social Sciences | 0 | 0.0% |
| Engineering | 0 | 0.0% |
| Multidisciplinary Studies | 0 | 0.0% |
| Science & Technology | 4 | 28.6% |
| Business | 0 | 0.0% |
| Education | 0 | 0.0% |
| Literature & Languages | 0 | 0.0% |
| Liberal Arts & History | 0 | 0.0% |
| Visual & Performing Arts | 0 | 0.0% |
| Communications | 0 | 0.0% |
| Arts & Humanities | 0 | 0.0% |
| Total | 14 | 100.0% |
Transportation & Commute in Kingston
Vehicle Availability by Sex in Kingston
The most prevalent vehicle ownership categories in Kingston are males with 5 or more vehicles (79, accounting for 97.5%) and females with 5 or more vehicles (15, making up 303.8%).
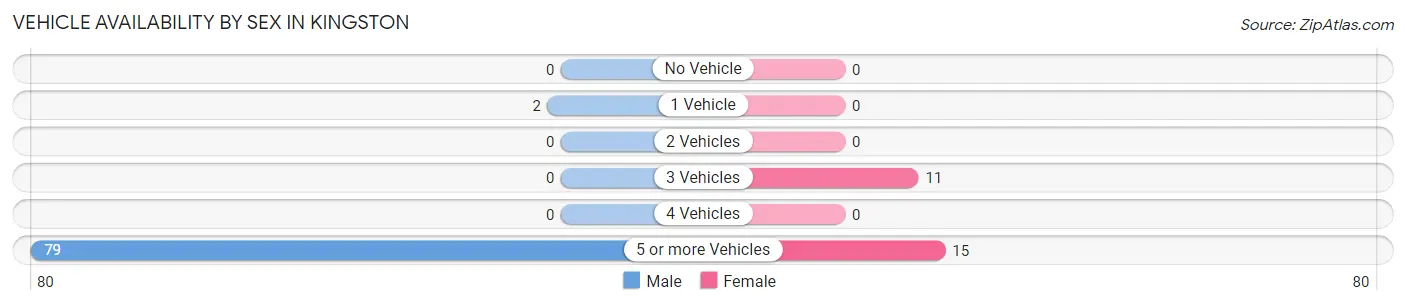
| Vehicles Available | Male | Female |
| No Vehicle | 0 (0.0%) | 0 (0.0%) |
| 1 Vehicle | 2 (2.5%) | 0 (0.0%) |
| 2 Vehicles | 0 (0.0%) | 0 (0.0%) |
| 3 Vehicles | 0 (0.0%) | 11 (42.3%) |
| 4 Vehicles | 0 (0.0%) | 0 (0.0%) |
| 5 or more Vehicles | 79 (97.5%) | 15 (57.7%) |
| Total | 81 (100.0%) | 26 (100.0%) |
Commute Time in Kingston
The most frequently occuring commute durations in Kingston are less than 5 minutes (15 commuters, 48.4%), 30 to 34 minutes (11 commuters, 35.5%), and 15 to 19 minutes (3 commuters, 9.7%).
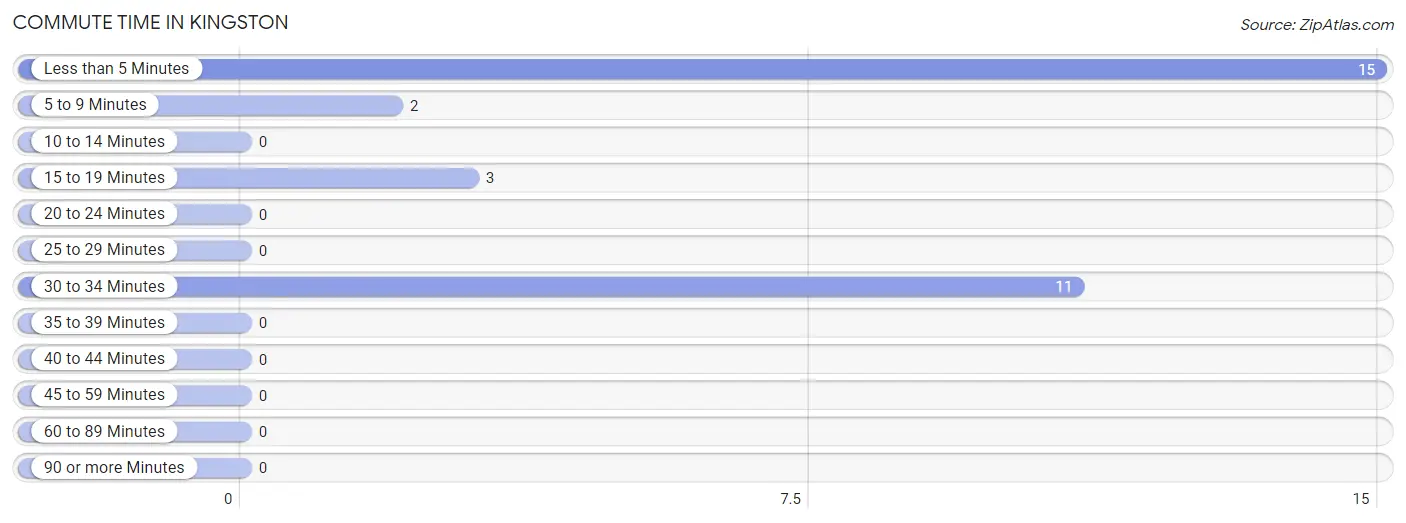
| Commute Time | # Commuters | % Commuters |
| Less than 5 Minutes | 15 | 48.4% |
| 5 to 9 Minutes | 2 | 6.5% |
| 10 to 14 Minutes | 0 | 0.0% |
| 15 to 19 Minutes | 3 | 9.7% |
| 20 to 24 Minutes | 0 | 0.0% |
| 25 to 29 Minutes | 0 | 0.0% |
| 30 to 34 Minutes | 11 | 35.5% |
| 35 to 39 Minutes | 0 | 0.0% |
| 40 to 44 Minutes | 0 | 0.0% |
| 45 to 59 Minutes | 0 | 0.0% |
| 60 to 89 Minutes | 0 | 0.0% |
| 90 or more Minutes | 0 | 0.0% |
Commute Time by Sex in Kingston
The most common commute times in Kingston are less than 5 minutes (15 commuters, 75.0%) for males and 30 to 34 minutes (11 commuters, 100.0%) for females.
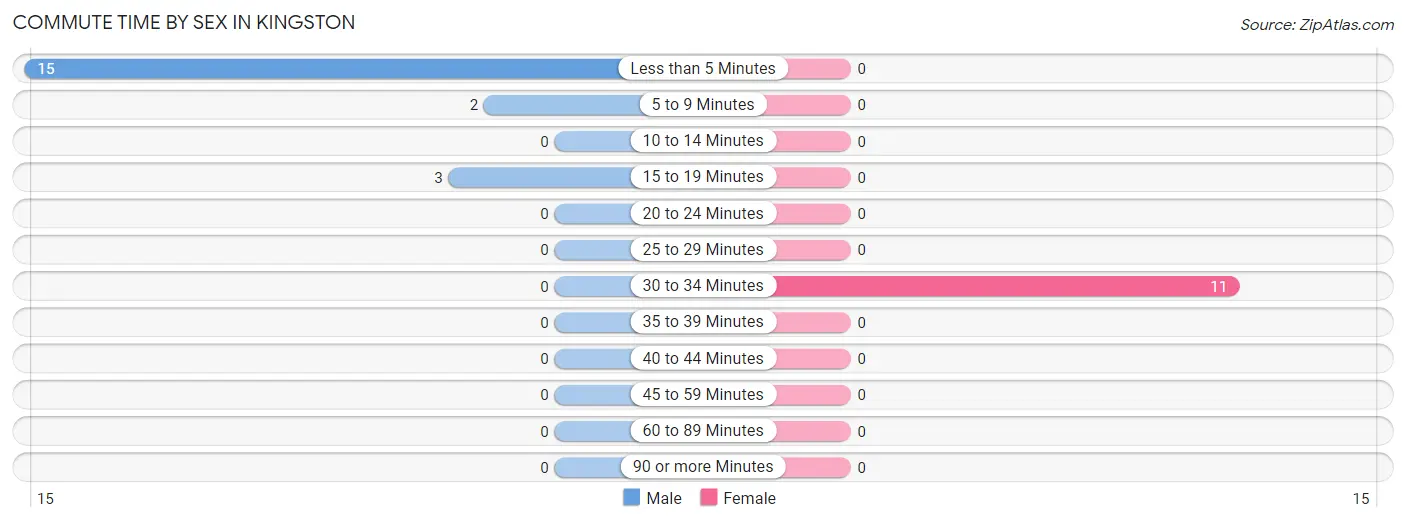
| Commute Time | Male | Female |
| Less than 5 Minutes | 15 (75.0%) | 0 (0.0%) |
| 5 to 9 Minutes | 2 (10.0%) | 0 (0.0%) |
| 10 to 14 Minutes | 0 (0.0%) | 0 (0.0%) |
| 15 to 19 Minutes | 3 (15.0%) | 0 (0.0%) |
| 20 to 24 Minutes | 0 (0.0%) | 0 (0.0%) |
| 25 to 29 Minutes | 0 (0.0%) | 0 (0.0%) |
| 30 to 34 Minutes | 0 (0.0%) | 11 (100.0%) |
| 35 to 39 Minutes | 0 (0.0%) | 0 (0.0%) |
| 40 to 44 Minutes | 0 (0.0%) | 0 (0.0%) |
| 45 to 59 Minutes | 0 (0.0%) | 0 (0.0%) |
| 60 to 89 Minutes | 0 (0.0%) | 0 (0.0%) |
| 90 or more Minutes | 0 (0.0%) | 0 (0.0%) |
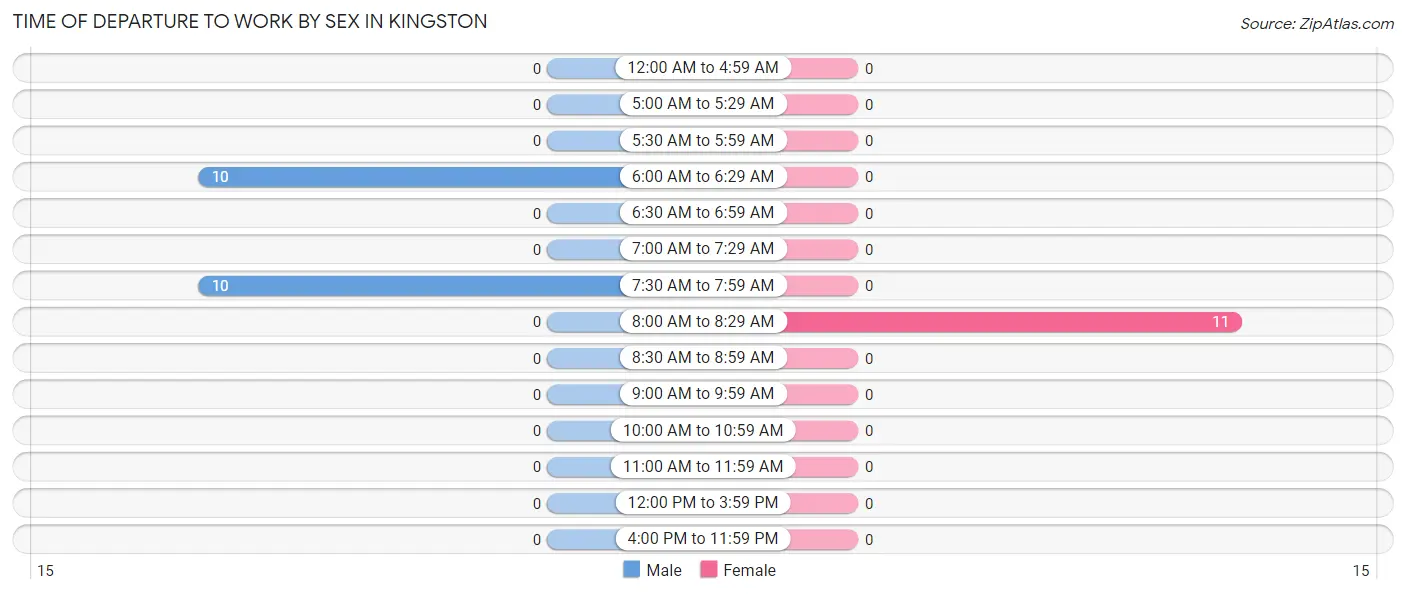
Time of Departure to Work by Sex in Kingston
The most frequent times of departure to work in Kingston are 6:00 AM to 6:29 AM (10, 50.0%) for males and 8:00 AM to 8:29 AM (11, 100.0%) for females.
| Time of Departure | Male | Female |
| 12:00 AM to 4:59 AM | 0 (0.0%) | 0 (0.0%) |
| 5:00 AM to 5:29 AM | 0 (0.0%) | 0 (0.0%) |
| 5:30 AM to 5:59 AM | 0 (0.0%) | 0 (0.0%) |
| 6:00 AM to 6:29 AM | 10 (50.0%) | 0 (0.0%) |
| 6:30 AM to 6:59 AM | 0 (0.0%) | 0 (0.0%) |
| 7:00 AM to 7:29 AM | 0 (0.0%) | 0 (0.0%) |
| 7:30 AM to 7:59 AM | 10 (50.0%) | 0 (0.0%) |
| 8:00 AM to 8:29 AM | 0 (0.0%) | 11 (100.0%) |
| 8:30 AM to 8:59 AM | 0 (0.0%) | 0 (0.0%) |
| 9:00 AM to 9:59 AM | 0 (0.0%) | 0 (0.0%) |
| 10:00 AM to 10:59 AM | 0 (0.0%) | 0 (0.0%) |
| 11:00 AM to 11:59 AM | 0 (0.0%) | 0 (0.0%) |
| 12:00 PM to 3:59 PM | 0 (0.0%) | 0 (0.0%) |
| 4:00 PM to 11:59 PM | 0 (0.0%) | 0 (0.0%) |
| Total | 20 (100.0%) | 11 (100.0%) |
Housing Occupancy in Kingston
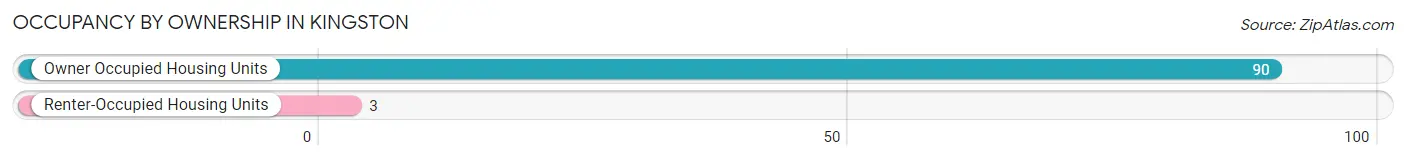
Occupancy by Ownership in Kingston
Of the total 93 dwellings in Kingston, owner-occupied units account for 90 (96.8%), while renter-occupied units make up 3 (3.2%).
| Occupancy | # Housing Units | % Housing Units |
| Owner Occupied Housing Units | 90 | 96.8% |
| Renter-Occupied Housing Units | 3 | 3.2% |
| Total Occupied Housing Units | 93 | 100.0% |
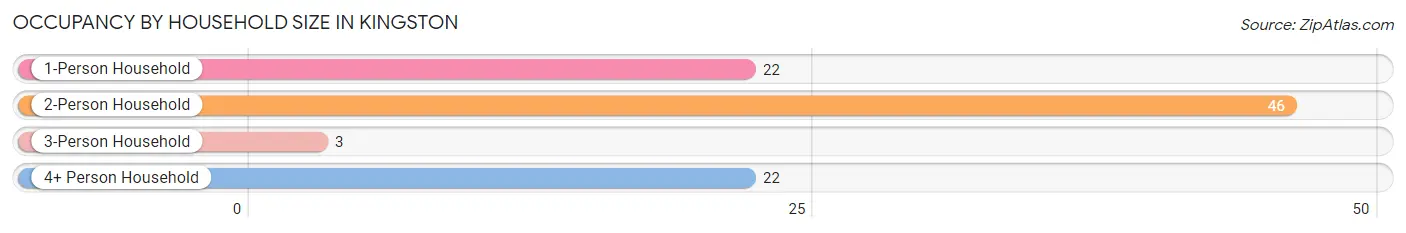
Occupancy by Household Size in Kingston
| Household Size | # Housing Units | % Housing Units |
| 1-Person Household | 22 | 23.7% |
| 2-Person Household | 46 | 49.5% |
| 3-Person Household | 3 | 3.2% |
| 4+ Person Household | 22 | 23.7% |
| Total Housing Units | 93 | 100.0% |
Occupancy by Ownership by Household Size in Kingston
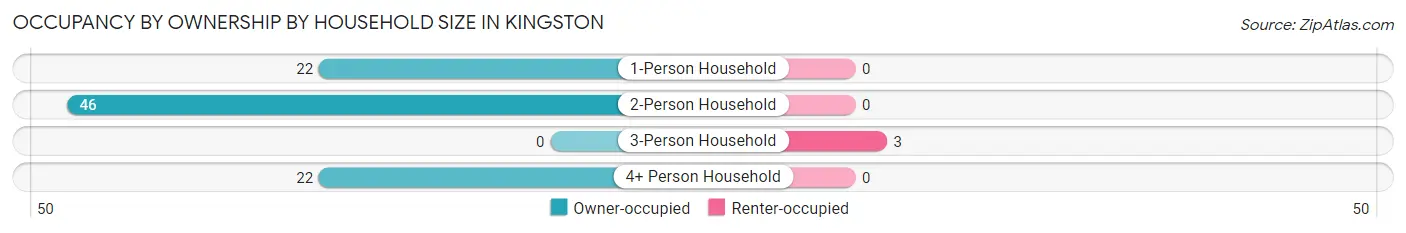
| Household Size | Owner-occupied | Renter-occupied |
| 1-Person Household | 22 (100.0%) | 0 (0.0%) |
| 2-Person Household | 46 (100.0%) | 0 (0.0%) |
| 3-Person Household | 0 (0.0%) | 3 (100.0%) |
| 4+ Person Household | 22 (100.0%) | 0 (0.0%) |
| Total Housing Units | 90 (96.8%) | 3 (3.2%) |
Occupancy by Educational Attainment in Kingston
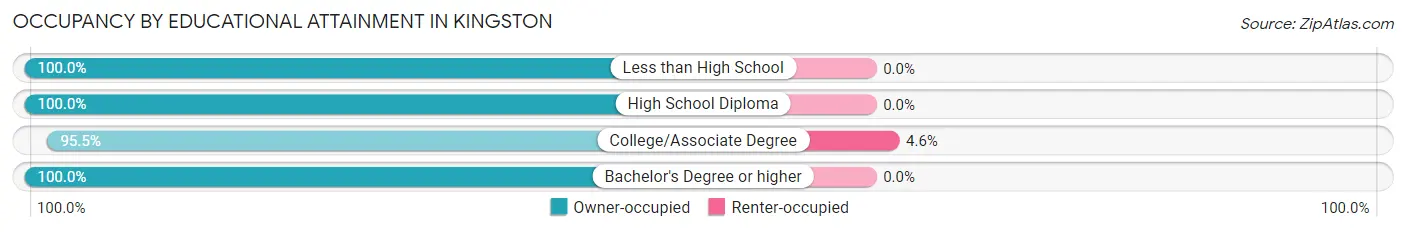
| Household Size | Owner-occupied | Renter-occupied |
| Less than High School | 11 (100.0%) | 0 (0.0%) |
| High School Diploma | 12 (100.0%) | 0 (0.0%) |
| College/Associate Degree | 63 (95.5%) | 3 (4.5%) |
| Bachelor's Degree or higher | 4 (100.0%) | 0 (0.0%) |
Occupancy by Age of Householder in Kingston
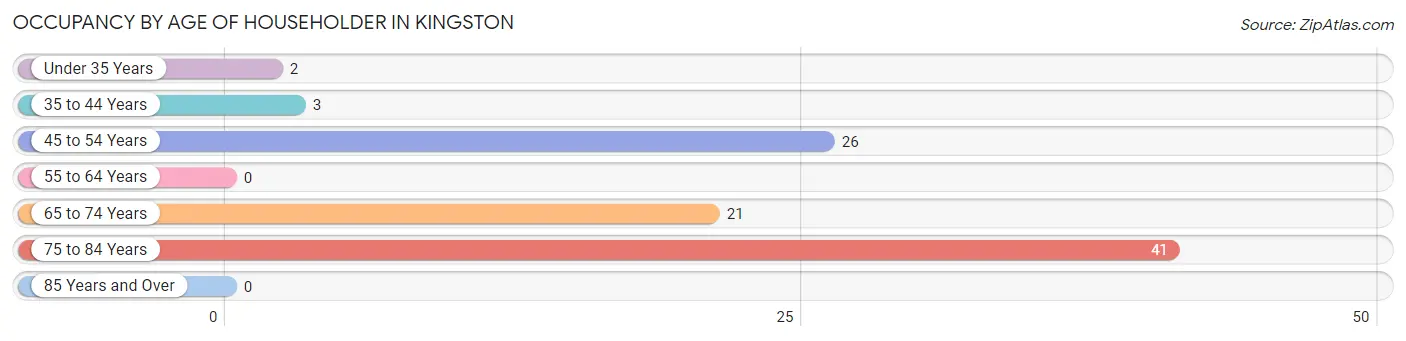
| Age Bracket | # Households | % Households |
| Under 35 Years | 2 | 2.1% |
| 35 to 44 Years | 3 | 3.2% |
| 45 to 54 Years | 26 | 28.0% |
| 55 to 64 Years | 0 | 0.0% |
| 65 to 74 Years | 21 | 22.6% |
| 75 to 84 Years | 41 | 44.1% |
| 85 Years and Over | 0 | 0.0% |
| Total | 93 | 100.0% |
Housing Finances in Kingston
Median Income by Occupancy in Kingston
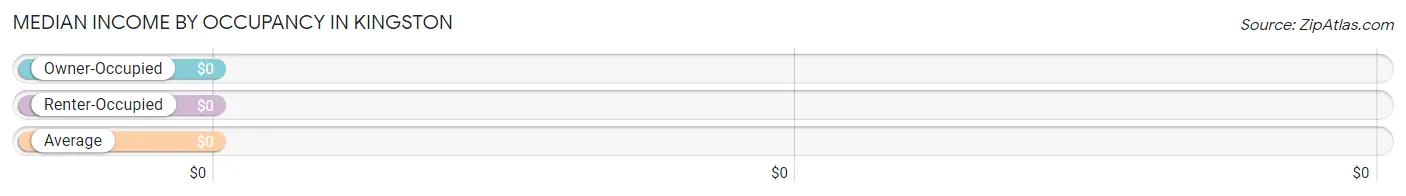
| Occupancy Type | # Households | Median Income |
| Owner-Occupied | 90 (96.8%) | $0 |
| Renter-Occupied | 3 (3.2%) | $0 |
| Average | 93 (100.0%) | $0 |
Occupancy by Householder Income Bracket in Kingston
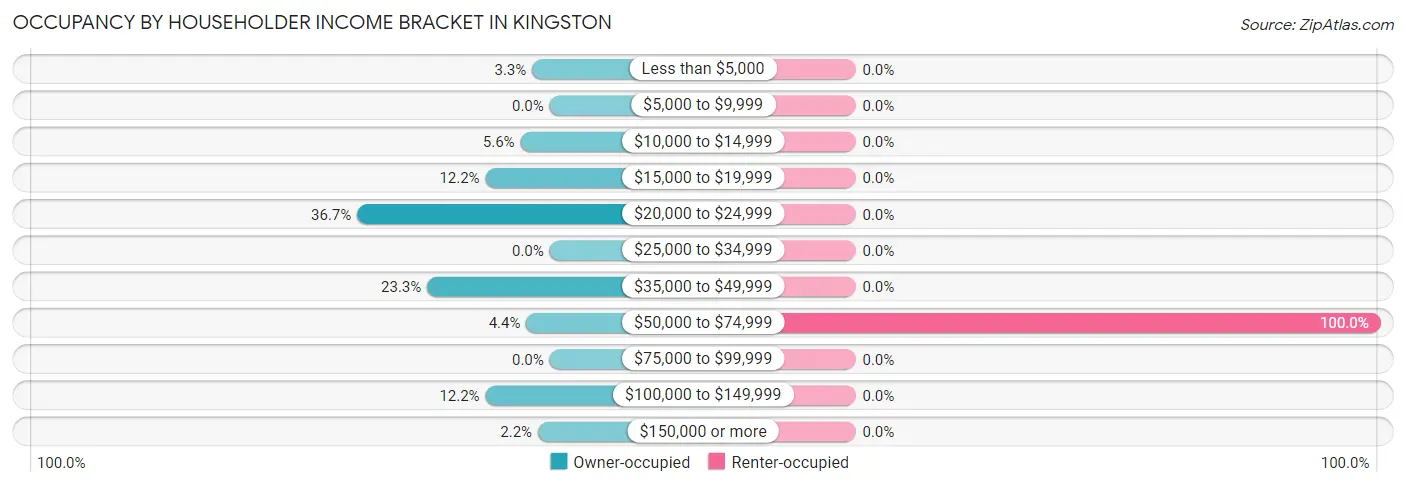
| Income Bracket | Owner-occupied | Renter-occupied |
| Less than $5,000 | 3 (3.3%) | 0 (0.0%) |
| $5,000 to $9,999 | 0 (0.0%) | 0 (0.0%) |
| $10,000 to $14,999 | 5 (5.6%) | 0 (0.0%) |
| $15,000 to $19,999 | 11 (12.2%) | 0 (0.0%) |
| $20,000 to $24,999 | 33 (36.7%) | 0 (0.0%) |
| $25,000 to $34,999 | 0 (0.0%) | 0 (0.0%) |
| $35,000 to $49,999 | 21 (23.3%) | 0 (0.0%) |
| $50,000 to $74,999 | 4 (4.4%) | 3 (100.0%) |
| $75,000 to $99,999 | 0 (0.0%) | 0 (0.0%) |
| $100,000 to $149,999 | 11 (12.2%) | 0 (0.0%) |
| $150,000 or more | 2 (2.2%) | 0 (0.0%) |
| Total | 90 (100.0%) | 3 (100.0%) |
Monthly Housing Cost Tiers in Kingston
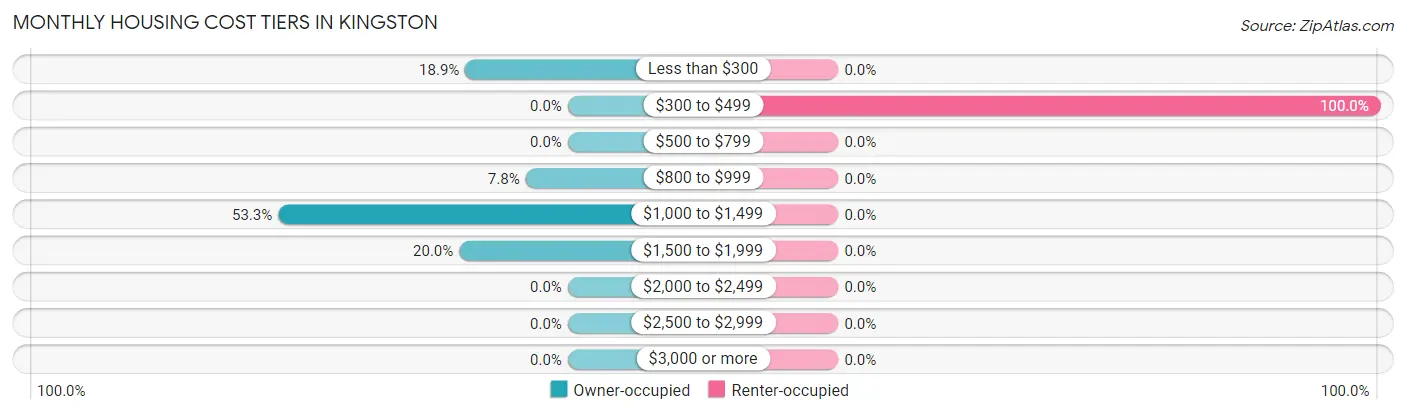
| Monthly Cost | Owner-occupied | Renter-occupied |
| Less than $300 | 17 (18.9%) | 0 (0.0%) |
| $300 to $499 | 0 (0.0%) | 3 (100.0%) |
| $500 to $799 | 0 (0.0%) | 0 (0.0%) |
| $800 to $999 | 7 (7.8%) | 0 (0.0%) |
| $1,000 to $1,499 | 48 (53.3%) | 0 (0.0%) |
| $1,500 to $1,999 | 18 (20.0%) | 0 (0.0%) |
| $2,000 to $2,499 | 0 (0.0%) | 0 (0.0%) |
| $2,500 to $2,999 | 0 (0.0%) | 0 (0.0%) |
| $3,000 or more | 0 (0.0%) | 0 (0.0%) |
| Total | 90 (100.0%) | 3 (100.0%) |
Physical Housing Characteristics in Kingston
Housing Structures in Kingston
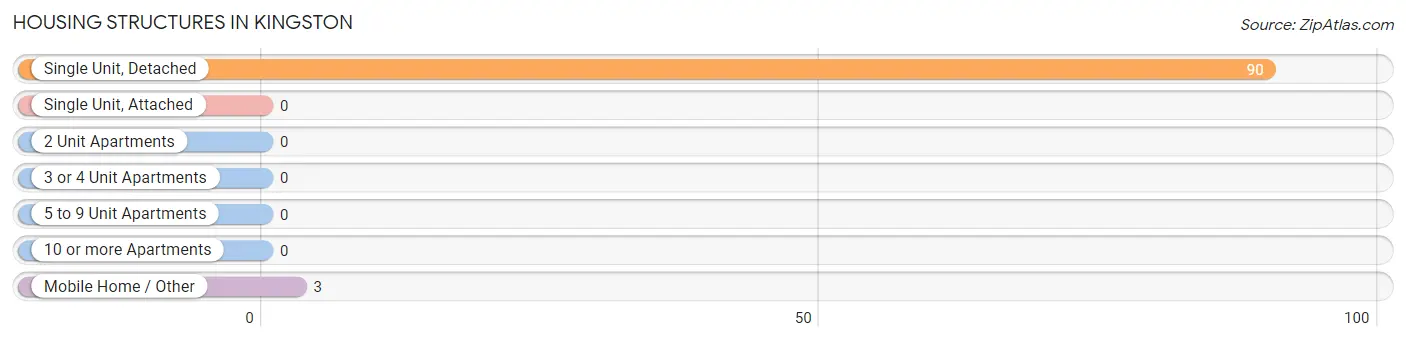
| Structure Type | # Housing Units | % Housing Units |
| Single Unit, Detached | 90 | 96.8% |
| Single Unit, Attached | 0 | 0.0% |
| 2 Unit Apartments | 0 | 0.0% |
| 3 or 4 Unit Apartments | 0 | 0.0% |
| 5 to 9 Unit Apartments | 0 | 0.0% |
| 10 or more Apartments | 0 | 0.0% |
| Mobile Home / Other | 3 | 3.2% |
| Total | 93 | 100.0% |
Housing Structures by Occupancy in Kingston
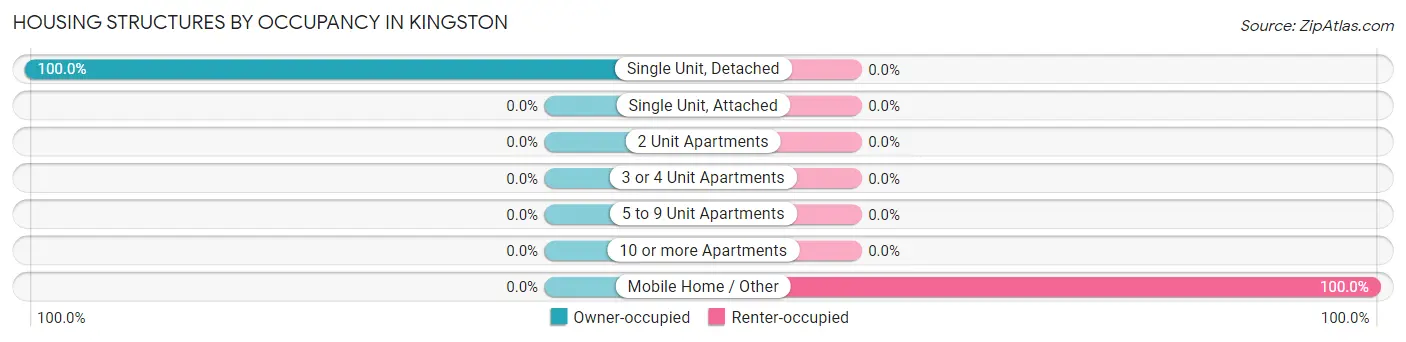
| Structure Type | Owner-occupied | Renter-occupied |
| Single Unit, Detached | 90 (100.0%) | 0 (0.0%) |
| Single Unit, Attached | 0 (0.0%) | 0 (0.0%) |
| 2 Unit Apartments | 0 (0.0%) | 0 (0.0%) |
| 3 or 4 Unit Apartments | 0 (0.0%) | 0 (0.0%) |
| 5 to 9 Unit Apartments | 0 (0.0%) | 0 (0.0%) |
| 10 or more Apartments | 0 (0.0%) | 0 (0.0%) |
| Mobile Home / Other | 0 (0.0%) | 3 (100.0%) |
| Total | 90 (96.8%) | 3 (3.2%) |
Housing Structures by Number of Rooms in Kingston
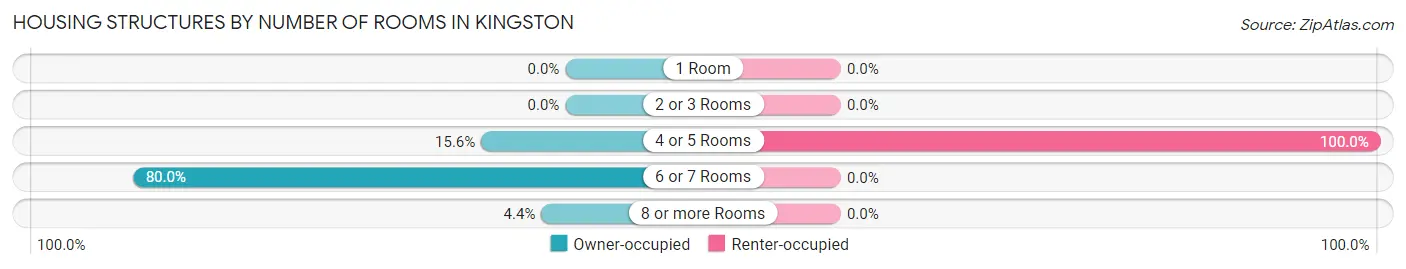
| Number of Rooms | Owner-occupied | Renter-occupied |
| 1 Room | 0 (0.0%) | 0 (0.0%) |
| 2 or 3 Rooms | 0 (0.0%) | 0 (0.0%) |
| 4 or 5 Rooms | 14 (15.6%) | 3 (100.0%) |
| 6 or 7 Rooms | 72 (80.0%) | 0 (0.0%) |
| 8 or more Rooms | 4 (4.4%) | 0 (0.0%) |
| Total | 90 (100.0%) | 3 (100.0%) |
Housing Structure by Heating Type in Kingston
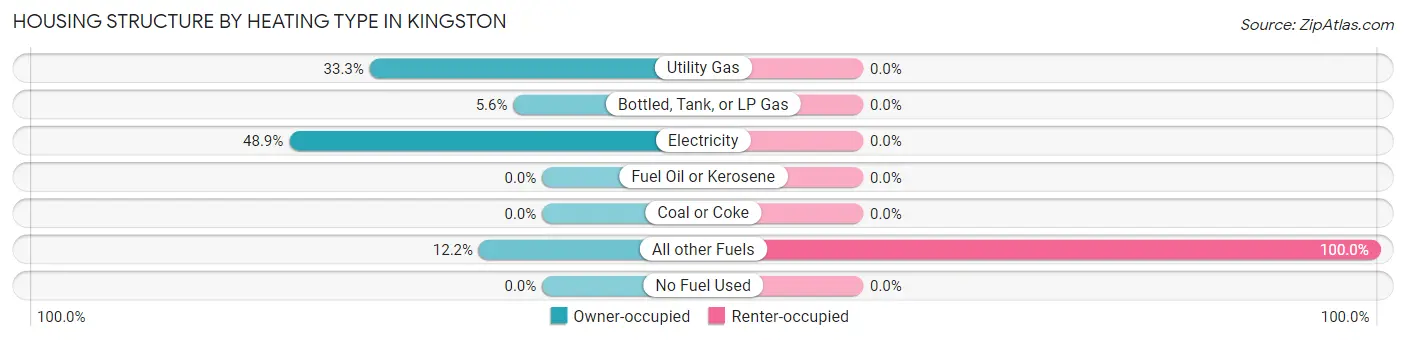
| Heating Type | Owner-occupied | Renter-occupied |
| Utility Gas | 30 (33.3%) | 0 (0.0%) |
| Bottled, Tank, or LP Gas | 5 (5.6%) | 0 (0.0%) |
| Electricity | 44 (48.9%) | 0 (0.0%) |
| Fuel Oil or Kerosene | 0 (0.0%) | 0 (0.0%) |
| Coal or Coke | 0 (0.0%) | 0 (0.0%) |
| All other Fuels | 11 (12.2%) | 3 (100.0%) |
| No Fuel Used | 0 (0.0%) | 0 (0.0%) |
| Total | 90 (100.0%) | 3 (100.0%) |
Household Vehicle Usage in Kingston
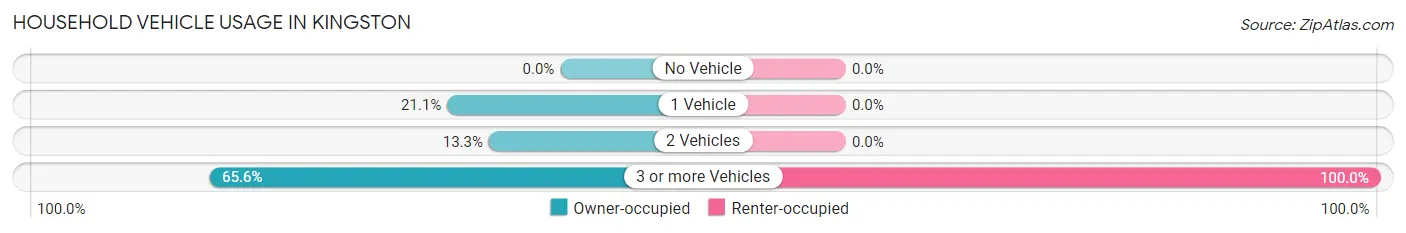
| Vehicles per Household | Owner-occupied | Renter-occupied |
| No Vehicle | 0 (0.0%) | 0 (0.0%) |
| 1 Vehicle | 19 (21.1%) | 0 (0.0%) |
| 2 Vehicles | 12 (13.3%) | 0 (0.0%) |
| 3 or more Vehicles | 59 (65.6%) | 3 (100.0%) |
| Total | 90 (100.0%) | 3 (100.0%) |
Real Estate & Mortgages in Kingston
Real Estate and Mortgage Overview in Kingston
| Characteristic | Without Mortgage | With Mortgage |
| Housing Units | 17 | 73 |
| Median Property Value | - | - |
| Median Household Income | - | - |
| Monthly Housing Costs | $177 | $0 |
| Real Estate Taxes | $638 | $0 |
Property Value by Mortgage Status in Kingston
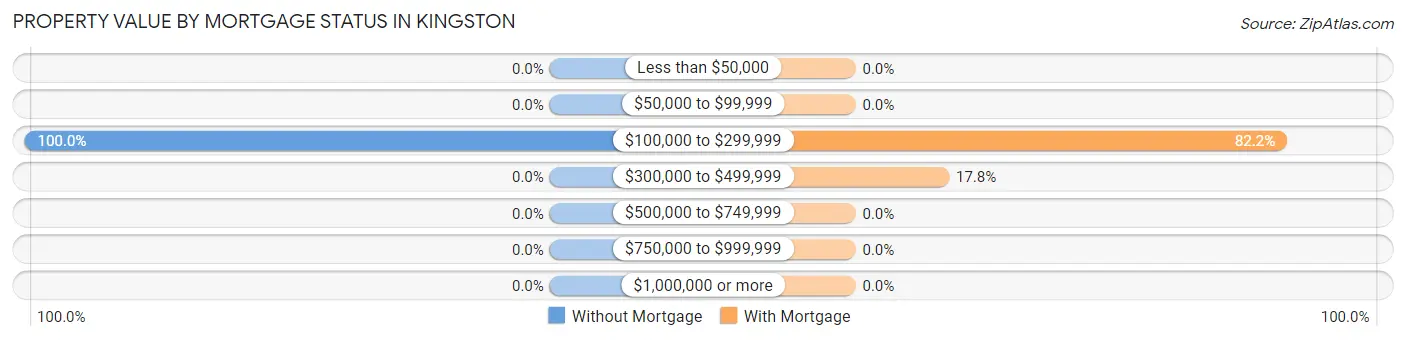
| Property Value | Without Mortgage | With Mortgage |
| Less than $50,000 | 0 (0.0%) | 0 (0.0%) |
| $50,000 to $99,999 | 0 (0.0%) | 0 (0.0%) |
| $100,000 to $299,999 | 17 (100.0%) | 60 (82.2%) |
| $300,000 to $499,999 | 0 (0.0%) | 13 (17.8%) |
| $500,000 to $749,999 | 0 (0.0%) | 0 (0.0%) |
| $750,000 to $999,999 | 0 (0.0%) | 0 (0.0%) |
| $1,000,000 or more | 0 (0.0%) | 0 (0.0%) |
| Total | 17 (100.0%) | 73 (100.0%) |
Household Income by Mortgage Status in Kingston
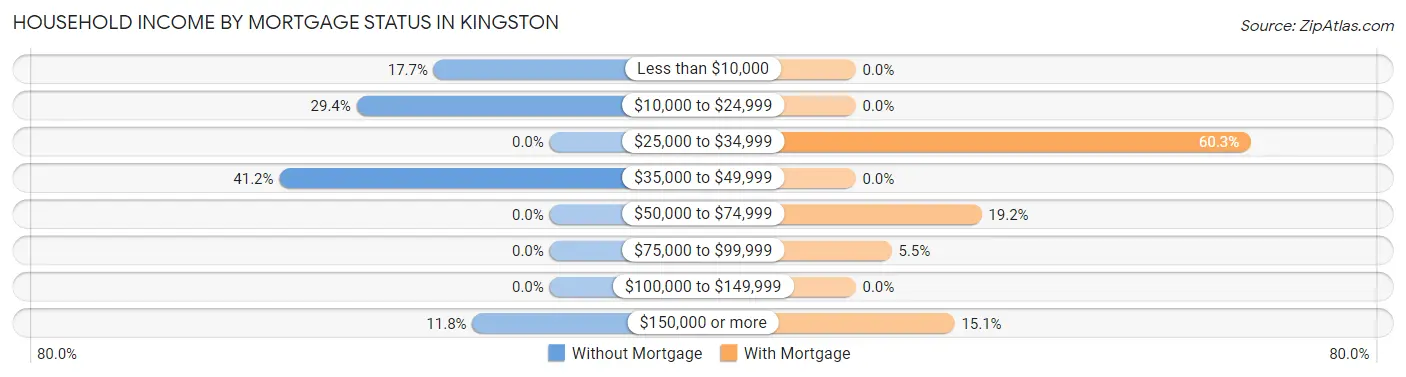
| Household Income | Without Mortgage | With Mortgage |
| Less than $10,000 | 3 (17.6%) | 0 (0.0%) |
| $10,000 to $24,999 | 5 (29.4%) | 0 (0.0%) |
| $25,000 to $34,999 | 0 (0.0%) | 44 (60.3%) |
| $35,000 to $49,999 | 7 (41.2%) | 0 (0.0%) |
| $50,000 to $74,999 | 0 (0.0%) | 14 (19.2%) |
| $75,000 to $99,999 | 0 (0.0%) | 4 (5.5%) |
| $100,000 to $149,999 | 0 (0.0%) | 0 (0.0%) |
| $150,000 or more | 2 (11.8%) | 11 (15.1%) |
| Total | 17 (100.0%) | 73 (100.0%) |
Property Value to Household Income Ratio in Kingston
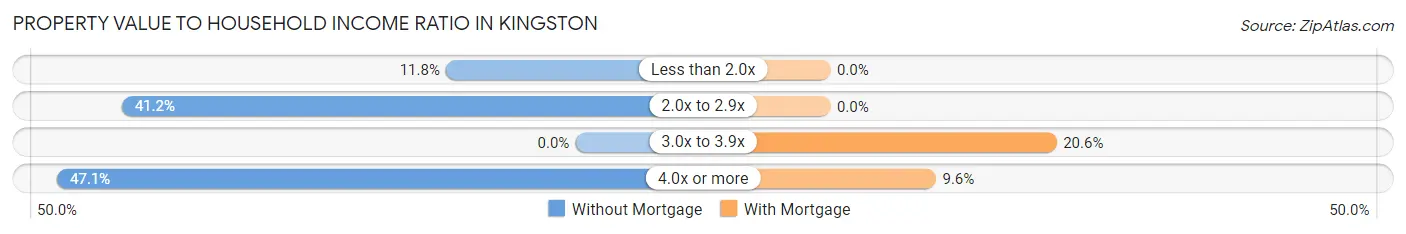
| Value-to-Income Ratio | Without Mortgage | With Mortgage |
| Less than 2.0x | 2 (11.8%) | 0 (0.0%) |
| 2.0x to 2.9x | 7 (41.2%) | 0 (0.0%) |
| 3.0x to 3.9x | 0 (0.0%) | 15 (20.5%) |
| 4.0x or more | 8 (47.1%) | 7 (9.6%) |
| Total | 17 (100.0%) | 73 (100.0%) |
Real Estate Taxes by Mortgage Status in Kingston
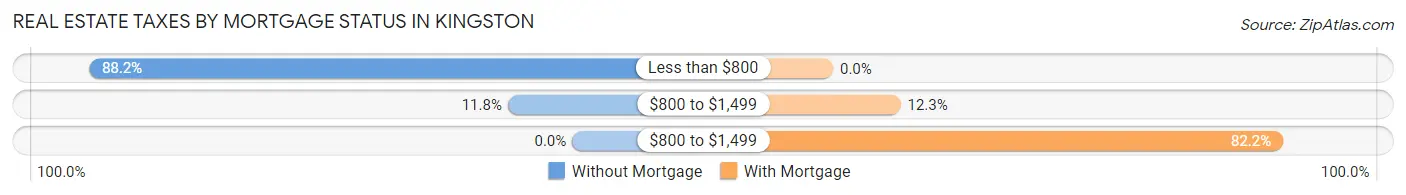
| Property Taxes | Without Mortgage | With Mortgage |
| Less than $800 | 15 (88.2%) | 0 (0.0%) |
| $800 to $1,499 | 2 (11.8%) | 9 (12.3%) |
| $800 to $1,499 | 0 (0.0%) | 60 (82.2%) |
| Total | 17 (100.0%) | 73 (100.0%) |
Health & Disability in Kingston
Health Insurance Coverage by Age in Kingston
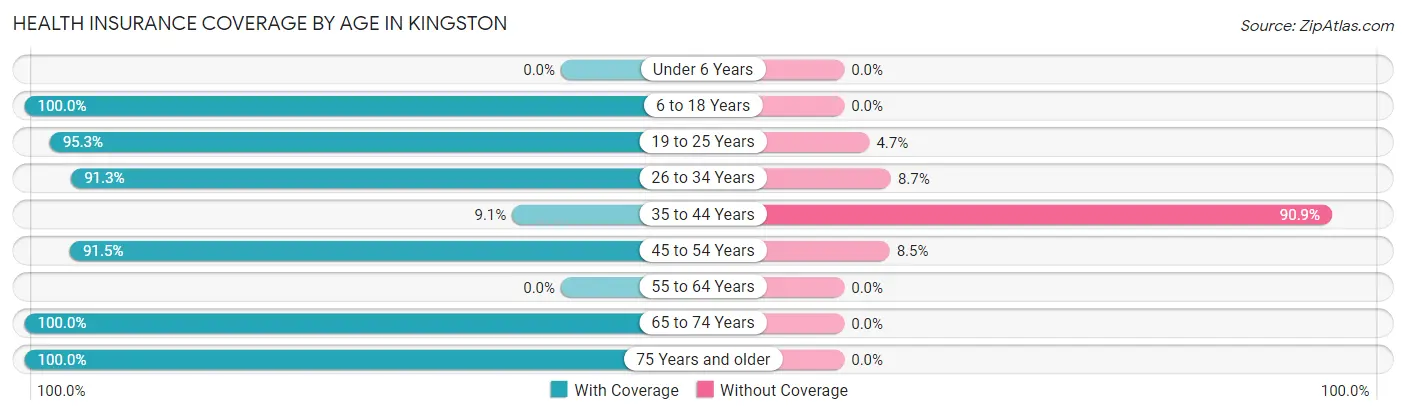
| Age Bracket | With Coverage | Without Coverage |
| Under 6 Years | 0 (0.0%) | 0 (0.0%) |
| 6 to 18 Years | 79 (100.0%) | 0 (0.0%) |
| 19 to 25 Years | 61 (95.3%) | 3 (4.7%) |
| 26 to 34 Years | 21 (91.3%) | 2 (8.7%) |
| 35 to 44 Years | 3 (9.1%) | 30 (90.9%) |
| 45 to 54 Years | 54 (91.5%) | 5 (8.5%) |
| 55 to 64 Years | 0 (0.0%) | 0 (0.0%) |
| 65 to 74 Years | 25 (100.0%) | 0 (0.0%) |
| 75 Years and older | 79 (100.0%) | 0 (0.0%) |
| Total | 322 (88.9%) | 40 (11.1%) |
Health Insurance Coverage by Citizenship Status in Kingston
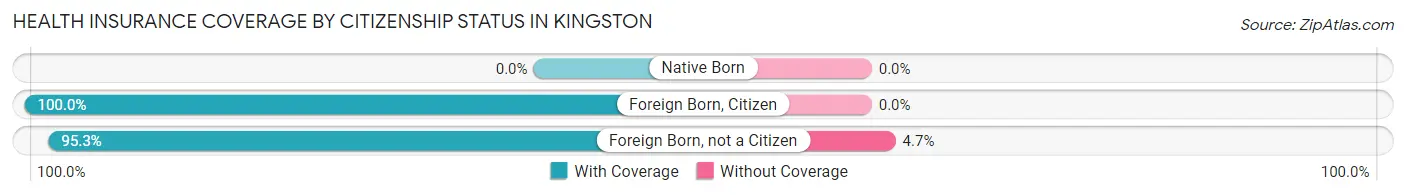
| Citizenship Status | With Coverage | Without Coverage |
| Native Born | 0 (0.0%) | 0 (0.0%) |
| Foreign Born, Citizen | 79 (100.0%) | 0 (0.0%) |
| Foreign Born, not a Citizen | 61 (95.3%) | 3 (4.7%) |
Health Insurance Coverage by Household Income in Kingston
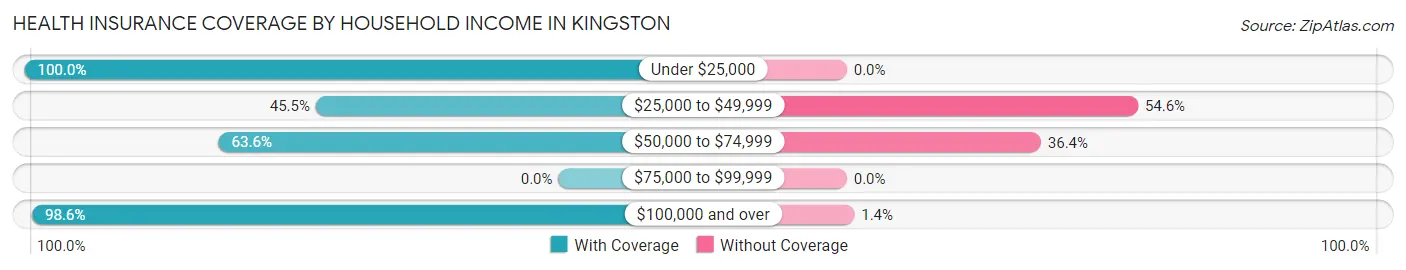
| Household Income | With Coverage | Without Coverage |
| Under $25,000 | 142 (100.0%) | 0 (0.0%) |
| $25,000 to $49,999 | 25 (45.5%) | 30 (54.5%) |
| $50,000 to $74,999 | 14 (63.6%) | 8 (36.4%) |
| $75,000 to $99,999 | 0 (0.0%) | 0 (0.0%) |
| $100,000 and over | 141 (98.6%) | 2 (1.4%) |
Public vs Private Health Insurance Coverage by Age in Kingston
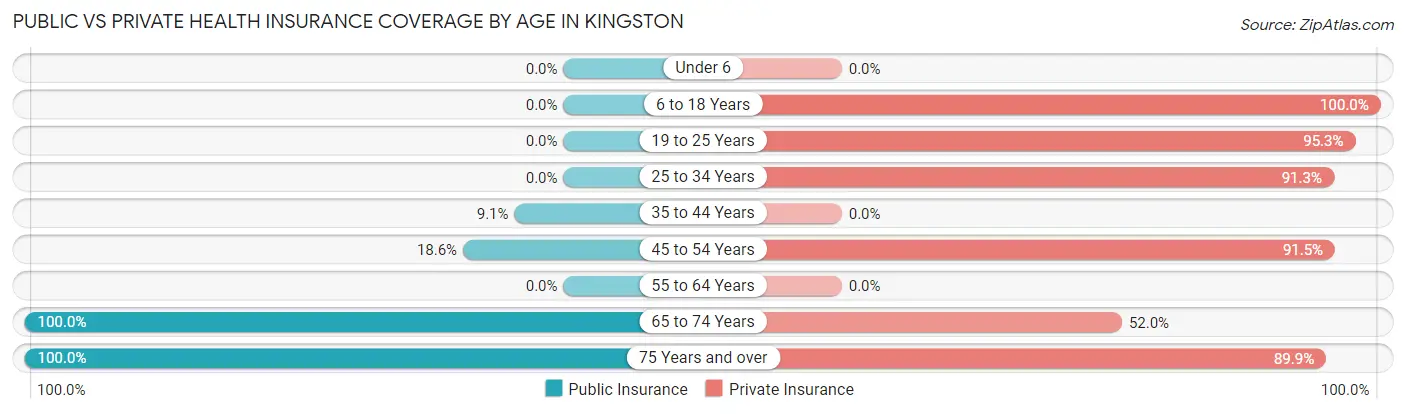
| Age Bracket | Public Insurance | Private Insurance |
| Under 6 | 0 (0.0%) | 0 (0.0%) |
| 6 to 18 Years | 0 (0.0%) | 79 (100.0%) |
| 19 to 25 Years | 0 (0.0%) | 61 (95.3%) |
| 25 to 34 Years | 0 (0.0%) | 21 (91.3%) |
| 35 to 44 Years | 3 (9.1%) | 0 (0.0%) |
| 45 to 54 Years | 11 (18.6%) | 54 (91.5%) |
| 55 to 64 Years | 0 (0.0%) | 0 (0.0%) |
| 65 to 74 Years | 25 (100.0%) | 13 (52.0%) |
| 75 Years and over | 79 (100.0%) | 71 (89.9%) |
| Total | 118 (32.6%) | 299 (82.6%) |
Disability Status by Sex by Age in Kingston
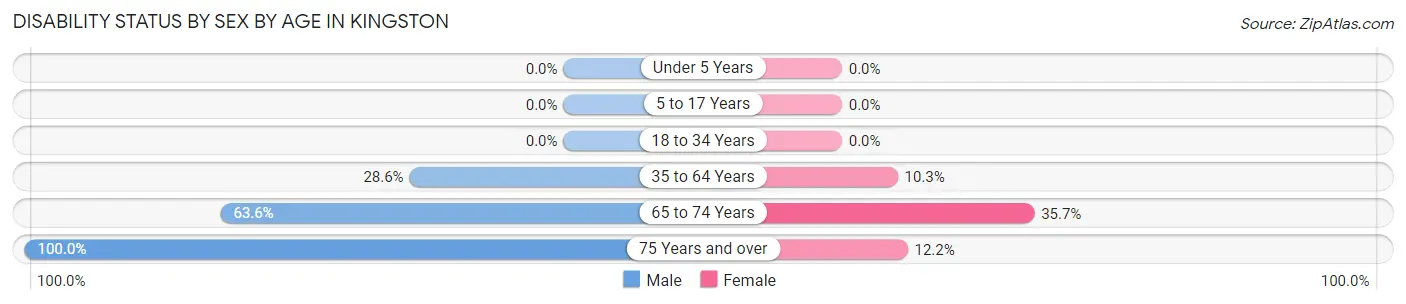
| Age Bracket | Male | Female |
| Under 5 Years | 0 (0.0%) | 0 (0.0%) |
| 5 to 17 Years | 0 (0.0%) | 0 (0.0%) |
| 18 to 34 Years | 0 (0.0%) | 0 (0.0%) |
| 35 to 64 Years | 18 (28.6%) | 3 (10.3%) |
| 65 to 74 Years | 7 (63.6%) | 5 (35.7%) |
| 75 Years and over | 38 (100.0%) | 5 (12.2%) |
Disability Class by Sex by Age in Kingston
Disability Class: Hearing Difficulty
| Age Bracket | Male | Female |
| Under 5 Years | 0 (0.0%) | 0 (0.0%) |
| 5 to 17 Years | 0 (0.0%) | 0 (0.0%) |
| 18 to 34 Years | 0 (0.0%) | 0 (0.0%) |
| 35 to 64 Years | 0 (0.0%) | 0 (0.0%) |
| 65 to 74 Years | 0 (0.0%) | 0 (0.0%) |
| 75 Years and over | 0 (0.0%) | 0 (0.0%) |
Disability Class: Vision Difficulty
| Age Bracket | Male | Female |
| Under 5 Years | 0 (0.0%) | 0 (0.0%) |
| 5 to 17 Years | 0 (0.0%) | 0 (0.0%) |
| 18 to 34 Years | 0 (0.0%) | 0 (0.0%) |
| 35 to 64 Years | 0 (0.0%) | 0 (0.0%) |
| 65 to 74 Years | 0 (0.0%) | 0 (0.0%) |
| 75 Years and over | 0 (0.0%) | 0 (0.0%) |
Disability Class: Cognitive Difficulty
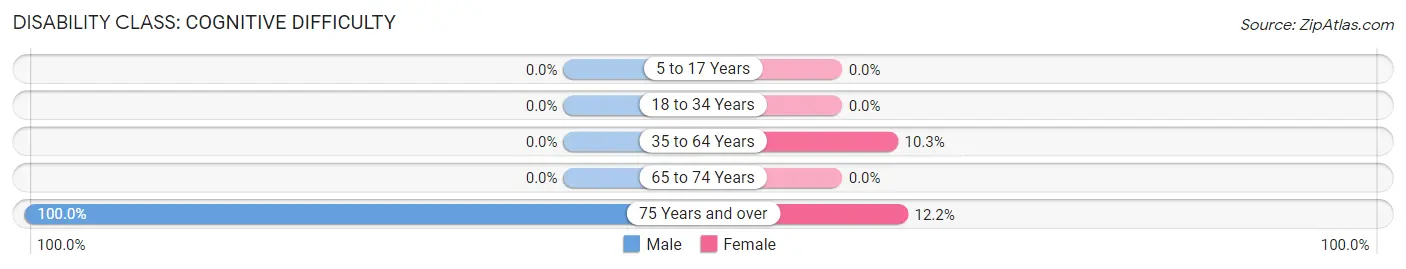
| Age Bracket | Male | Female |
| 5 to 17 Years | 0 (0.0%) | 0 (0.0%) |
| 18 to 34 Years | 0 (0.0%) | 0 (0.0%) |
| 35 to 64 Years | 0 (0.0%) | 3 (10.3%) |
| 65 to 74 Years | 0 (0.0%) | 0 (0.0%) |
| 75 Years and over | 38 (100.0%) | 5 (12.2%) |
Disability Class: Ambulatory Difficulty
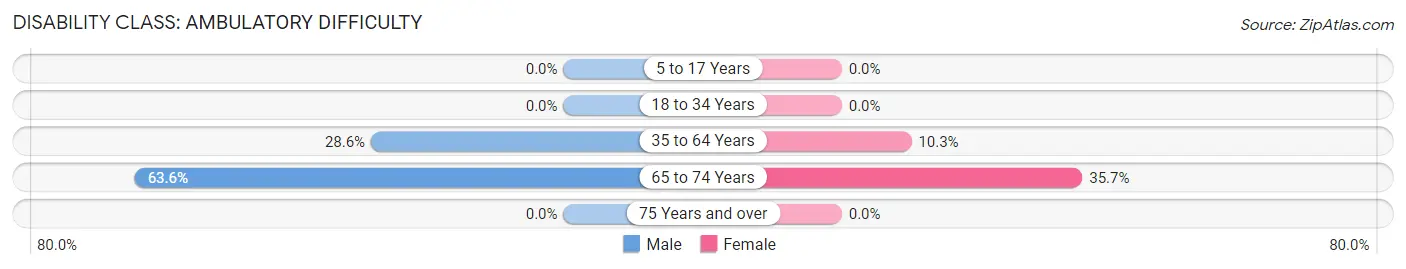
| Age Bracket | Male | Female |
| 5 to 17 Years | 0 (0.0%) | 0 (0.0%) |
| 18 to 34 Years | 0 (0.0%) | 0 (0.0%) |
| 35 to 64 Years | 18 (28.6%) | 3 (10.3%) |
| 65 to 74 Years | 7 (63.6%) | 5 (35.7%) |
| 75 Years and over | 0 (0.0%) | 0 (0.0%) |
Disability Class: Self-Care Difficulty
| Age Bracket | Male | Female |
| 5 to 17 Years | 0 (0.0%) | 0 (0.0%) |
| 18 to 34 Years | 0 (0.0%) | 0 (0.0%) |
| 35 to 64 Years | 0 (0.0%) | 0 (0.0%) |
| 65 to 74 Years | 0 (0.0%) | 0 (0.0%) |
| 75 Years and over | 0 (0.0%) | 0 (0.0%) |
Technology Access in Kingston
Computing Device Access in Kingston
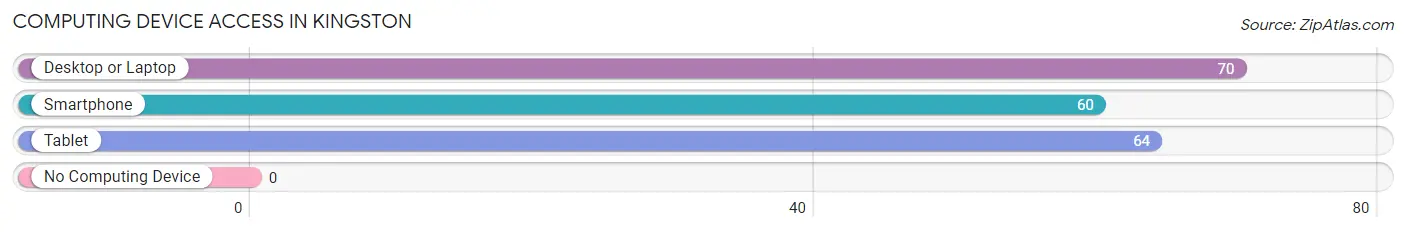
| Device Type | # Households | % Households |
| Desktop or Laptop | 70 | 75.3% |
| Smartphone | 60 | 64.5% |
| Tablet | 64 | 68.8% |
| No Computing Device | 0 | 0.0% |
| Total | 93 | 100.0% |
Internet Access in Kingston
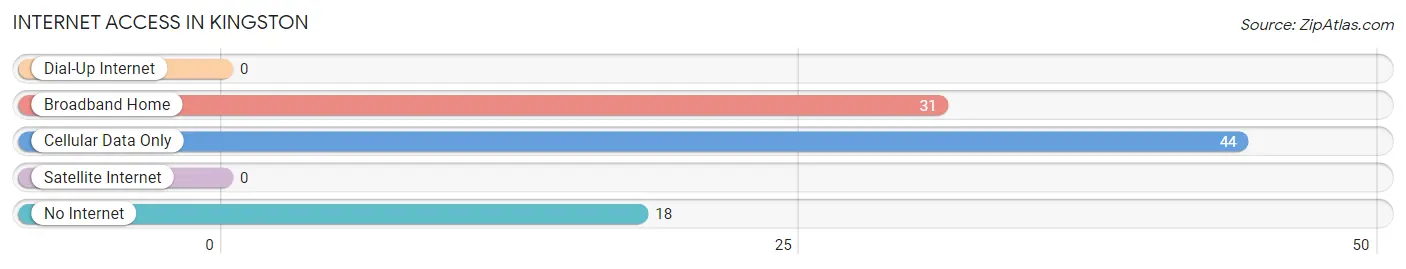
| Internet Type | # Households | % Households |
| Dial-Up Internet | 0 | 0.0% |
| Broadband Home | 31 | 33.3% |
| Cellular Data Only | 44 | 47.3% |
| Satellite Internet | 0 | 0.0% |
| No Internet | 18 | 19.4% |
| Total | 93 | 100.0% |
Kingston Summary
Kingston is a small town located in the southeastern corner of Utah, in the United States. It is situated in the San Juan County, and is part of the Four Corners region. The town is located on the banks of the Fremont River, and is surrounded by the Manti-La Sal National Forest. The town has a population of approximately 1,000 people, and is the largest town in the county.
History
Kingston was first settled in 1879 by a group of Mormon pioneers, led by John W. Kingston. The town was originally named Kingstonville, and was later changed to Kingston. The town was incorporated in 1891, and was the first town in San Juan County to be incorporated.
The town was initially a farming and ranching community, and the main crops grown were wheat, corn, and hay. The town also had a sawmill, which provided lumber for the local area. In the early 1900s, the town began to experience a population boom, as more people moved to the area to take advantage of the fertile land and the abundant resources.
Geography
Kingston is located in the southeastern corner of Utah, in the United States. It is situated in the San Juan County, and is part of the Four Corners region. The town is located on the banks of the Fremont River, and is surrounded by the Manti-La Sal National Forest. The town has a total area of 1.2 square miles, all of which is land.
The town is located at an elevation of 5,400 feet, and has a semi-arid climate. The average temperature in the summer is around 80 degrees Fahrenheit, and the average temperature in the winter is around 30 degrees Fahrenheit. The town receives an average of 10 inches of precipitation per year.
Economy
The economy of Kingston is largely based on agriculture and tourism. The town is home to several farms and ranches, which produce a variety of crops, including wheat, corn, hay, and alfalfa. The town also has a sawmill, which provides lumber for the local area.
The town is also a popular tourist destination, due to its proximity to the Manti-La Sal National Forest. The town is home to several campgrounds, and is a popular destination for fishing, hunting, and other outdoor activities. The town also has several restaurants, hotels, and other businesses that cater to tourists.
Demographics
As of the 2010 census, the town had a population of 1,000 people. The racial makeup of the town was 95.2% White, 0.7% Native American, 0.3% Asian, 0.2% Pacific Islander, 0.1% from other races, and 3.5% from two or more races. The median household income was $37,500, and the median family income was $41,250. The per capita income was $17,500.
Conclusion
Kingston is a small town located in the southeastern corner of Utah, in the United States. It is situated in the San Juan County, and is part of the Four Corners region. The town has a population of approximately 1,000 people, and is the largest town in the county. The economy of Kingston is largely based on agriculture and tourism, and the town is a popular destination for fishing, hunting, and other outdoor activities. The town has a diverse population, with a median household income of $37,500 and a median family income of $41,250.
Common Questions
What is Per Capita Income in Kingston?
Per Capita income in Kingston is $16,219.
What is Income or Wage Gap in Kingston?
Income or Wage Gap in Kingston is 53.9%.
Women in Kingston earn 46.1 cents for every dollar earned by a man.
What is Inequality or Gini Index in Kingston?
Inequality or Gini Index in Kingston is 0.46.
What is the Total Population of Kingston?
Total Population of Kingston is 362.
What is the Total Male Population of Kingston?
Total Male Population of Kingston is 240.
What is the Total Female Population of Kingston?
Total Female Population of Kingston is 122.
What is the Ratio of Males per 100 Females in Kingston?
There are 196.72 Males per 100 Females in Kingston.
What is the Ratio of Females per 100 Males in Kingston?
There are 50.83 Females per 100 Males in Kingston.
What is the Median Population Age in Kingston?
Median Population Age in Kingston is 36.5 Years.
What is the Average Family Size in Kingston
Average Family Size in Kingston is 4.8 People.
What is the Average Household Size in Kingston
Average Household Size in Kingston is 3.9 People.
How Large is the Labor Force in Kingston?
There are 137 People in the Labor Forcein in Kingston.
What is the Percentage of People in the Labor Force in Kingston?
46.0% of People are in the Labor Force in Kingston.
What is the Unemployment Rate in Kingston?
Unemployment Rate in Kingston is 21.9%.