Henefer, UT Map & Demographics
Henefer Map
Henefer Overview
$37,570
PER CAPITA INCOME
$124,306
AVG FAMILY INCOME
$89,306
AVG HOUSEHOLD INCOME
43.2%
WAGE / INCOME GAP [ % ]
56.8¢/ $1
WAGE / INCOME GAP [ $ ]
0.28
INEQUALITY / GINI INDEX
708
TOTAL POPULATION
397
MALE POPULATION
311
FEMALE POPULATION
127.65
MALES / 100 FEMALES
78.34
FEMALES / 100 MALES
43.0
MEDIAN AGE
3.8
AVG FAMILY SIZE
2.9
AVG HOUSEHOLD SIZE
380
LABOR FORCE [ PEOPLE ]
70.0%
PERCENT IN LABOR FORCE
0.5%
UNEMPLOYMENT RATE
Henefer Zip Codes
Henefer Area Codes
Income in Henefer
Income Overview in Henefer
Per Capita Income in Henefer is $37,570, while median incomes of families and households are $124,306 and $89,306 respectively.
| Characteristic | Number | Measure |
| Per Capita Income | 708 | $37,570 |
| Median Family Income | 159 | $124,306 |
| Mean Family Income | 159 | $118,972 |
| Median Household Income | 245 | $89,306 |
| Mean Household Income | 245 | $102,695 |
| Income Deficit | 159 | $0 |
| Wage / Income Gap (%) | 708 | 43.22% |
| Wage / Income Gap ($) | 708 | 56.78¢ per $1 |
| Gini / Inequality Index | 708 | 0.28 |
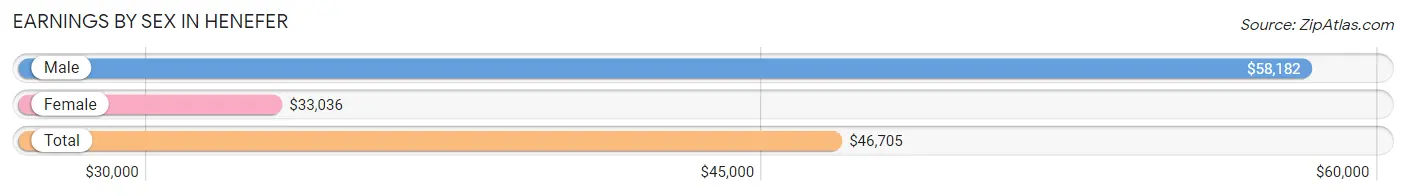
Earnings by Sex in Henefer
Average Earnings in Henefer are $46,705, $58,182 for men and $33,036 for women, a difference of 43.2%.
| Sex | Number | Average Earnings |
| Male | 252 (62.2%) | $58,182 |
| Female | 153 (37.8%) | $33,036 |
| Total | 405 (100.0%) | $46,705 |
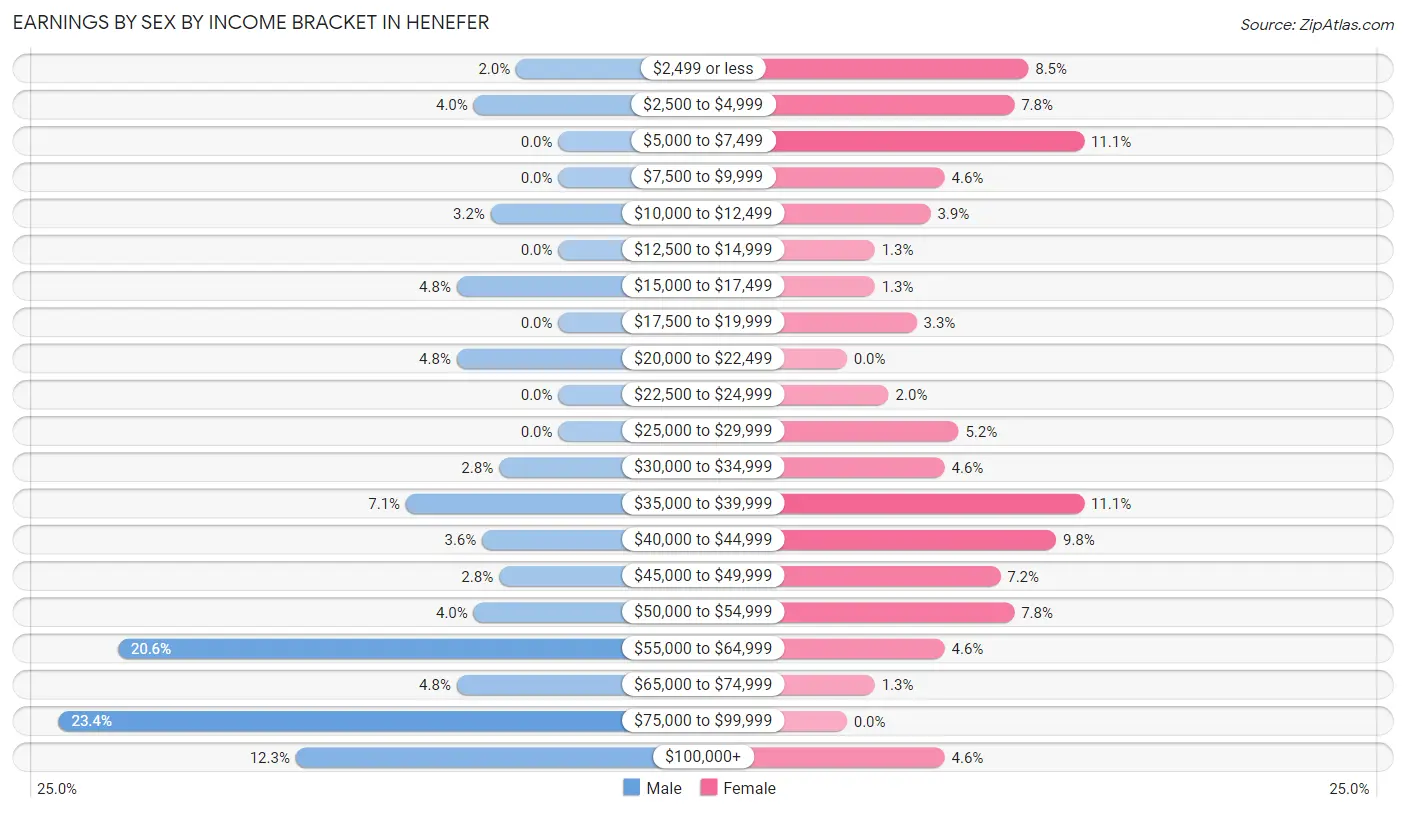
Earnings by Sex by Income Bracket in Henefer
The most common earnings brackets in Henefer are $75,000 to $99,999 for men (59 | 23.4%) and $5,000 to $7,499 for women (17 | 11.1%).
| Income | Male | Female |
| $2,499 or less | 5 (2.0%) | 13 (8.5%) |
| $2,500 to $4,999 | 10 (4.0%) | 12 (7.8%) |
| $5,000 to $7,499 | 0 (0.0%) | 17 (11.1%) |
| $7,500 to $9,999 | 0 (0.0%) | 7 (4.6%) |
| $10,000 to $12,499 | 8 (3.2%) | 6 (3.9%) |
| $12,500 to $14,999 | 0 (0.0%) | 2 (1.3%) |
| $15,000 to $17,499 | 12 (4.8%) | 2 (1.3%) |
| $17,500 to $19,999 | 0 (0.0%) | 5 (3.3%) |
| $20,000 to $22,499 | 12 (4.8%) | 0 (0.0%) |
| $22,500 to $24,999 | 0 (0.0%) | 3 (2.0%) |
| $25,000 to $29,999 | 0 (0.0%) | 8 (5.2%) |
| $30,000 to $34,999 | 7 (2.8%) | 7 (4.6%) |
| $35,000 to $39,999 | 18 (7.1%) | 17 (11.1%) |
| $40,000 to $44,999 | 9 (3.6%) | 15 (9.8%) |
| $45,000 to $49,999 | 7 (2.8%) | 11 (7.2%) |
| $50,000 to $54,999 | 10 (4.0%) | 12 (7.8%) |
| $55,000 to $64,999 | 52 (20.6%) | 7 (4.6%) |
| $65,000 to $74,999 | 12 (4.8%) | 2 (1.3%) |
| $75,000 to $99,999 | 59 (23.4%) | 0 (0.0%) |
| $100,000+ | 31 (12.3%) | 7 (4.6%) |
| Total | 252 (100.0%) | 153 (100.0%) |
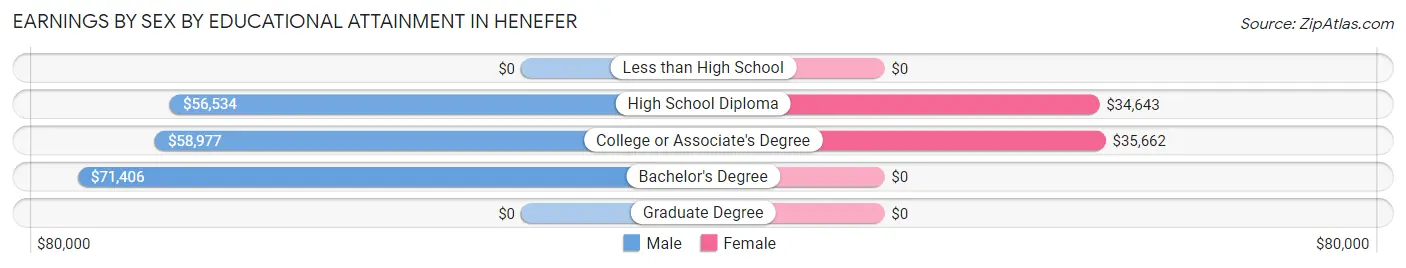
Earnings by Sex by Educational Attainment in Henefer
Average earnings in Henefer are $63,281 for men and $36,029 for women, a difference of 43.1%. Men with an educational attainment of bachelor's degree enjoy the highest average annual earnings of $71,406, while those with high school diploma education earn the least with $56,534. Women with an educational attainment of college or associate's degree earn the most with the average annual earnings of $35,662, while those with high school diploma education have the smallest earnings of $34,643.
| Educational Attainment | Male Income | Female Income |
| Less than High School | - | - |
| High School Diploma | $56,534 | $34,643 |
| College or Associate's Degree | $58,977 | $35,662 |
| Bachelor's Degree | $71,406 | $0 |
| Graduate Degree | - | - |
| Total | $63,281 | $36,029 |
Family Income in Henefer
Family Income Brackets in Henefer
According to the Henefer family income data, there are 51 families falling into the $100,000 to $149,999 income range, which is the most common income bracket and makes up 32.1% of all families.
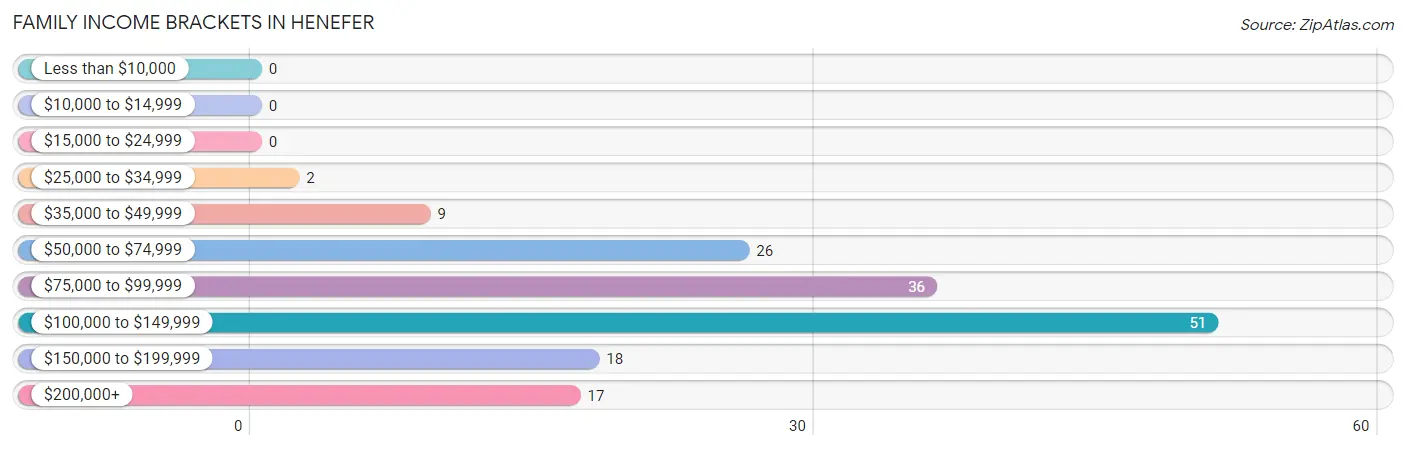
| Income Bracket | # Families | % Families |
| Less than $10,000 | 0 | 0.0% |
| $10,000 to $14,999 | 0 | 0.0% |
| $15,000 to $24,999 | 0 | 0.0% |
| $25,000 to $34,999 | 2 | 1.3% |
| $35,000 to $49,999 | 9 | 5.7% |
| $50,000 to $74,999 | 26 | 16.4% |
| $75,000 to $99,999 | 36 | 22.6% |
| $100,000 to $149,999 | 51 | 32.1% |
| $150,000 to $199,999 | 18 | 11.3% |
| $200,000+ | 17 | 10.7% |
Family Income by Famaliy Size in Henefer
3-person families (24 | 15.1%) account for the highest median family income in Henefer with $151,250 per family, while 2-person families (79 | 49.7%) have the highest median income of $65,042 per family member.
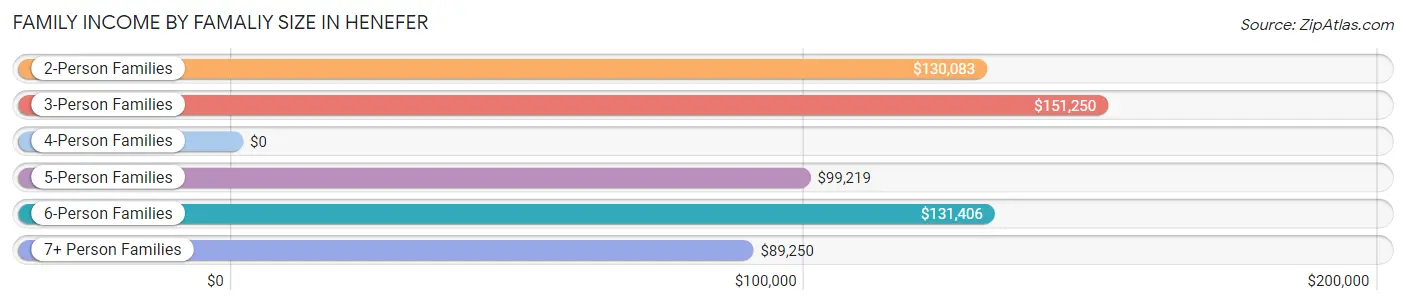
| Income Bracket | # Families | Median Income |
| 2-Person Families | 79 (49.7%) | $130,083 |
| 3-Person Families | 24 (15.1%) | $151,250 |
| 4-Person Families | 17 (10.7%) | $0 |
| 5-Person Families | 15 (9.4%) | $99,219 |
| 6-Person Families | 13 (8.2%) | $131,406 |
| 7+ Person Families | 11 (6.9%) | $89,250 |
| Total | 159 (100.0%) | $124,306 |
Family Income by Number of Earners in Henefer
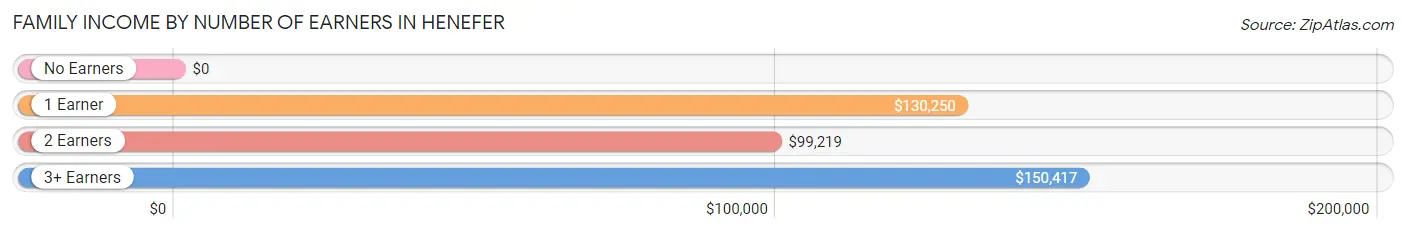
| Number of Earners | # Families | Median Income |
| No Earners | 9 (5.7%) | $0 |
| 1 Earner | 45 (28.3%) | $130,250 |
| 2 Earners | 79 (49.7%) | $99,219 |
| 3+ Earners | 26 (16.4%) | $150,417 |
| Total | 159 (100.0%) | $124,306 |
Household Income in Henefer
Household Income Brackets in Henefer
With 74 households falling in the category, the $100,000 to $149,999 income range is the most frequent in Henefer, accounting for 30.2% of all households.
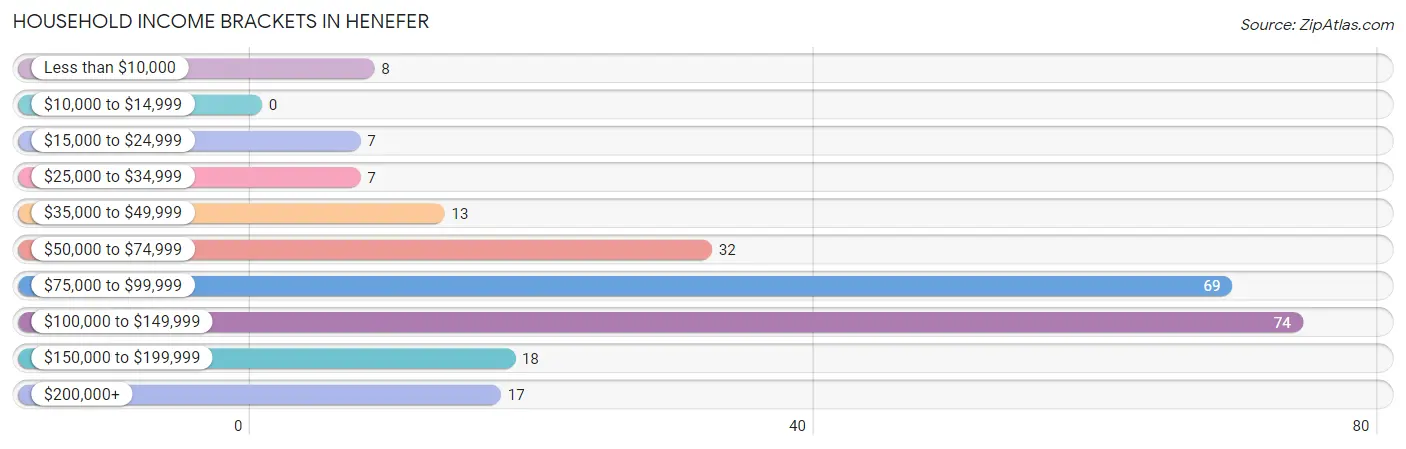
| Income Bracket | # Households | % Households |
| Less than $10,000 | 8 | 3.3% |
| $10,000 to $14,999 | 0 | 0.0% |
| $15,000 to $24,999 | 7 | 2.9% |
| $25,000 to $34,999 | 7 | 2.9% |
| $35,000 to $49,999 | 13 | 5.3% |
| $50,000 to $74,999 | 32 | 13.1% |
| $75,000 to $99,999 | 69 | 28.2% |
| $100,000 to $149,999 | 74 | 30.2% |
| $150,000 to $199,999 | 18 | 7.3% |
| $200,000+ | 17 | 6.9% |
Household Income by Householder Age in Henefer
The median household income in Henefer is $89,306, with the highest median household income of $130,694 found in the 45 to 64 years age bracket for the primary householder. A total of 110 households (44.9%) fall into this category. Meanwhile, the 15 to 24 years age bracket for the primary householder has the lowest median household income of $73,750, with 10 households (4.1%) in this group.
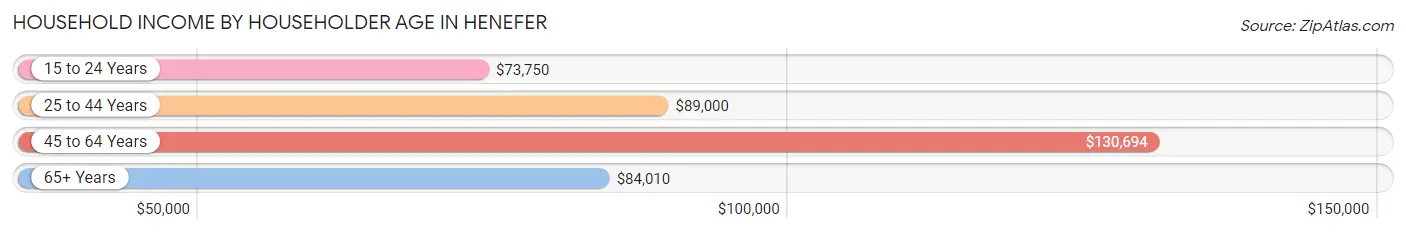
| Income Bracket | # Households | Median Income |
| 15 to 24 Years | 10 (4.1%) | $73,750 |
| 25 to 44 Years | 42 (17.1%) | $89,000 |
| 45 to 64 Years | 110 (44.9%) | $130,694 |
| 65+ Years | 83 (33.9%) | $84,010 |
| Total | 245 (100.0%) | $89,306 |
Poverty in Henefer
Income Below Poverty by Sex and Age in Henefer
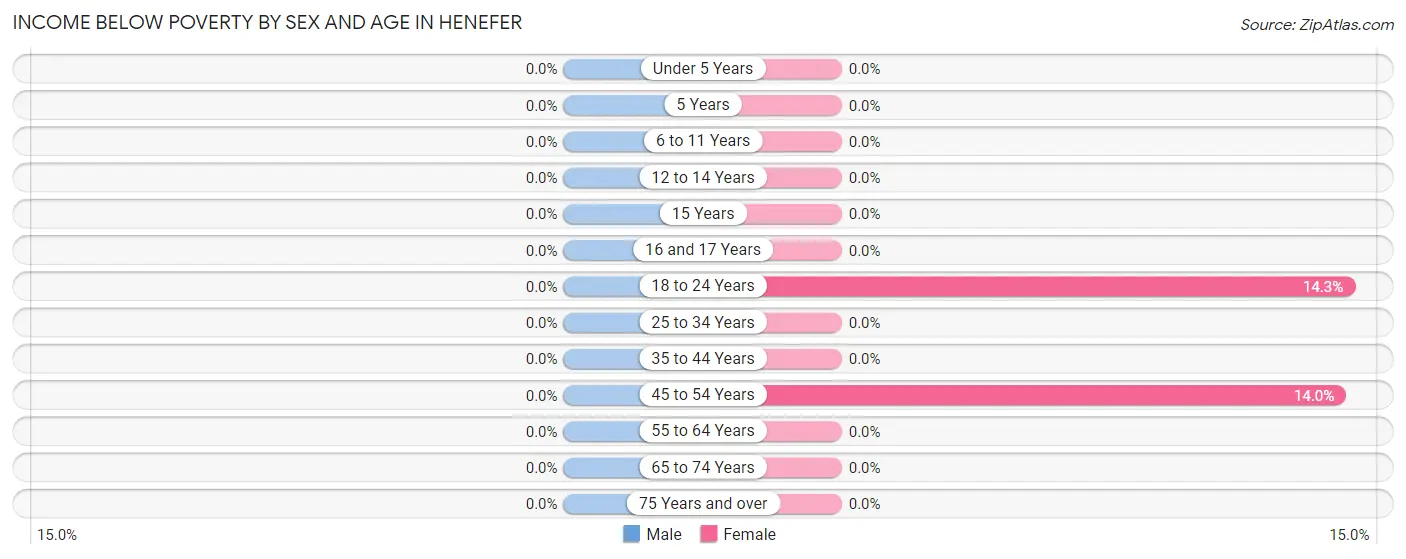
| Age Bracket | Male | Female |
| Under 5 Years | 0 (0.0%) | 0 (0.0%) |
| 5 Years | 0 (0.0%) | 0 (0.0%) |
| 6 to 11 Years | 0 (0.0%) | 0 (0.0%) |
| 12 to 14 Years | 0 (0.0%) | 0 (0.0%) |
| 15 Years | 0 (0.0%) | 0 (0.0%) |
| 16 and 17 Years | 0 (0.0%) | 0 (0.0%) |
| 18 to 24 Years | 0 (0.0%) | 4 (14.3%) |
| 25 to 34 Years | 0 (0.0%) | 0 (0.0%) |
| 35 to 44 Years | 0 (0.0%) | 0 (0.0%) |
| 45 to 54 Years | 0 (0.0%) | 8 (14.0%) |
| 55 to 64 Years | 0 (0.0%) | 0 (0.0%) |
| 65 to 74 Years | 0 (0.0%) | 0 (0.0%) |
| 75 Years and over | 0 (0.0%) | 0 (0.0%) |
| Total | 0 (0.0%) | 12 (3.9%) |
Income Above Poverty by Sex and Age in Henefer
According to the poverty statistics in Henefer, males aged under 5 years and females aged under 5 years are the age groups that are most secure financially, with 100.0% of males and 100.0% of females in these age groups living above the poverty line.
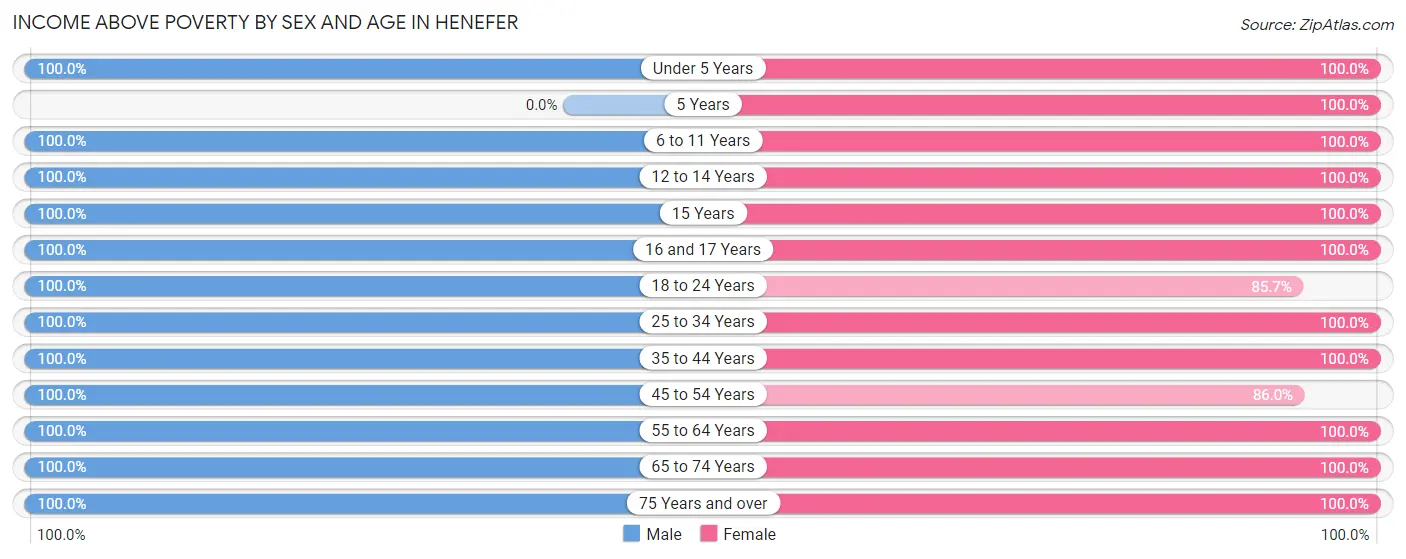
| Age Bracket | Male | Female |
| Under 5 Years | 19 (100.0%) | 24 (100.0%) |
| 5 Years | 0 (0.0%) | 24 (100.0%) |
| 6 to 11 Years | 43 (100.0%) | 26 (100.0%) |
| 12 to 14 Years | 14 (100.0%) | 7 (100.0%) |
| 15 Years | 6 (100.0%) | 2 (100.0%) |
| 16 and 17 Years | 18 (100.0%) | 13 (100.0%) |
| 18 to 24 Years | 49 (100.0%) | 24 (85.7%) |
| 25 to 34 Years | 6 (100.0%) | 14 (100.0%) |
| 35 to 44 Years | 59 (100.0%) | 44 (100.0%) |
| 45 to 54 Years | 46 (100.0%) | 49 (86.0%) |
| 55 to 64 Years | 64 (100.0%) | 45 (100.0%) |
| 65 to 74 Years | 25 (100.0%) | 18 (100.0%) |
| 75 Years and over | 48 (100.0%) | 9 (100.0%) |
| Total | 397 (100.0%) | 299 (96.1%) |
Income Below Poverty Among Married-Couple Families in Henefer
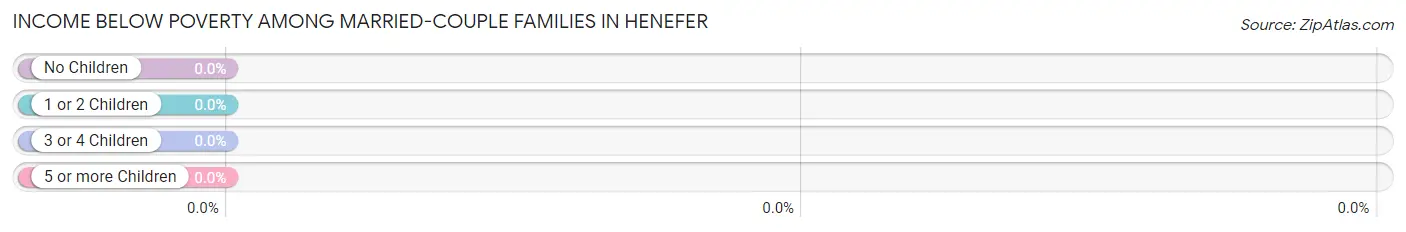
| Children | Above Poverty | Below Poverty |
| No Children | 89 (100.0%) | 0 (0.0%) |
| 1 or 2 Children | 25 (100.0%) | 0 (0.0%) |
| 3 or 4 Children | 26 (100.0%) | 0 (0.0%) |
| 5 or more Children | 11 (100.0%) | 0 (0.0%) |
| Total | 151 (100.0%) | 0 (0.0%) |
Income Below Poverty Among Single-Parent Households in Henefer
| Children | Single Father | Single Mother |
| No Children | 0 (0.0%) | 0 (0.0%) |
| 1 or 2 Children | 0 (0.0%) | 0 (0.0%) |
| 3 or 4 Children | 0 (0.0%) | 0 (0.0%) |
| 5 or more Children | 0 (0.0%) | 0 (0.0%) |
| Total | 0 (0.0%) | 0 (0.0%) |
Income Below Poverty Among Married-Couple vs Single-Parent Households in Henefer
| Children | Married-Couple Families | Single-Parent Households |
| No Children | 0 (0.0%) | 0 (0.0%) |
| 1 or 2 Children | 0 (0.0%) | 0 (0.0%) |
| 3 or 4 Children | 0 (0.0%) | 0 (0.0%) |
| 5 or more Children | 0 (0.0%) | 0 (0.0%) |
| Total | 0 (0.0%) | 0 (0.0%) |
Race in Henefer
The most populous races in Henefer are White / Caucasian (676 | 95.5%), Hispanic or Latino (39 | 5.5%), and Two or more Races (25 | 3.5%).
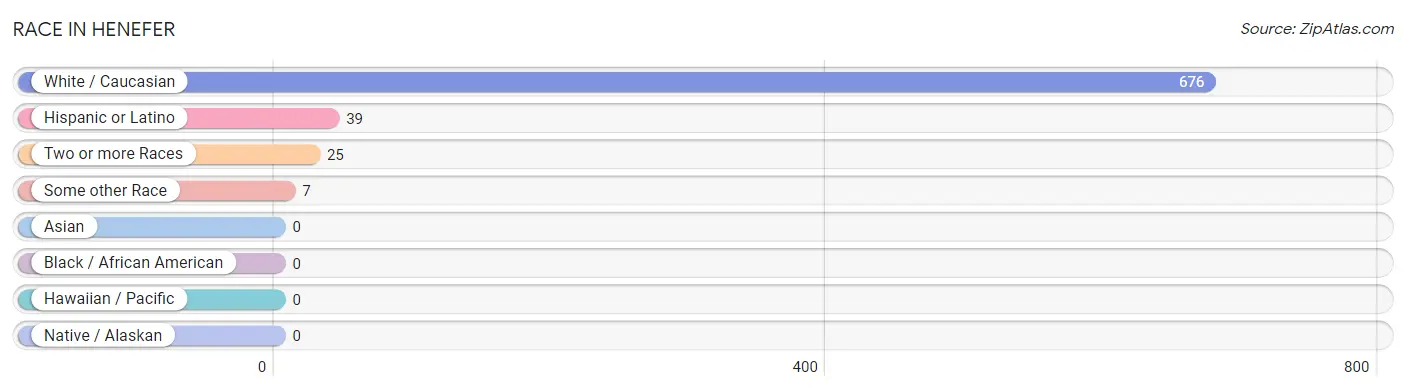
| Race | # Population | % Population |
| Asian | 0 | 0.0% |
| Black / African American | 0 | 0.0% |
| Hawaiian / Pacific | 0 | 0.0% |
| Hispanic or Latino | 39 | 5.5% |
| Native / Alaskan | 0 | 0.0% |
| White / Caucasian | 676 | 95.5% |
| Two or more Races | 25 | 3.5% |
| Some other Race | 7 | 1.0% |
| Total | 708 | 100.0% |
Ancestry in Henefer
The most populous ancestries reported in Henefer are English (238 | 33.6%), Irish (68 | 9.6%), American (66 | 9.3%), German (40 | 5.7%), and Danish (34 | 4.8%), together accounting for 63.0% of all Henefer residents.
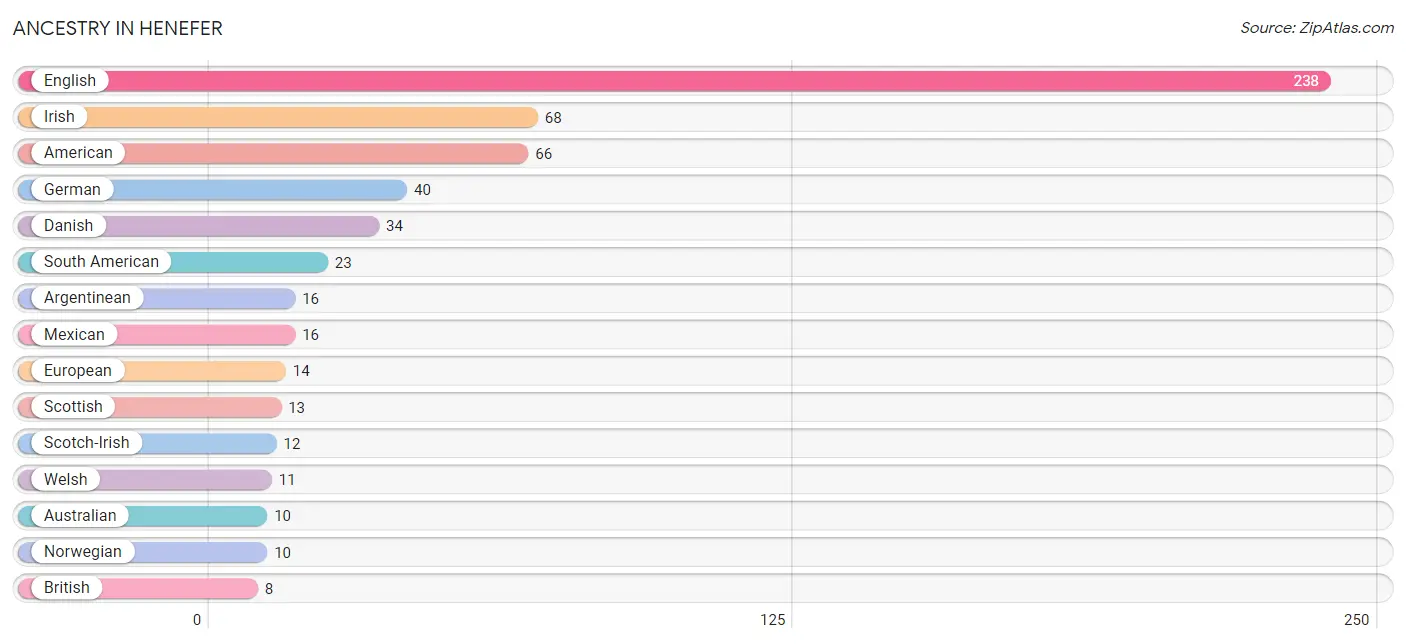
| Ancestry | # Population | % Population |
| American | 66 | 9.3% |
| Argentinean | 16 | 2.3% |
| Australian | 10 | 1.4% |
| Basque | 2 | 0.3% |
| British | 8 | 1.1% |
| Danish | 34 | 4.8% |
| Dutch | 2 | 0.3% |
| English | 238 | 33.6% |
| European | 14 | 2.0% |
| French | 4 | 0.6% |
| German | 40 | 5.7% |
| Irish | 68 | 9.6% |
| Mexican | 16 | 2.3% |
| Norwegian | 10 | 1.4% |
| Peruvian | 7 | 1.0% |
| Scandinavian | 6 | 0.9% |
| Scotch-Irish | 12 | 1.7% |
| Scottish | 13 | 1.8% |
| South American | 23 | 3.3% |
| Swedish | 3 | 0.4% |
| Welsh | 11 | 1.5% | View All 21 Rows |
Immigrants in Henefer
The most numerous immigrant groups reported in Henefer came from Latin America (9 | 1.3%), South America (9 | 1.3%), Peru (7 | 1.0%), Argentina (2 | 0.3%), and Europe (2 | 0.3%), together accounting for 4.1% of all Henefer residents.
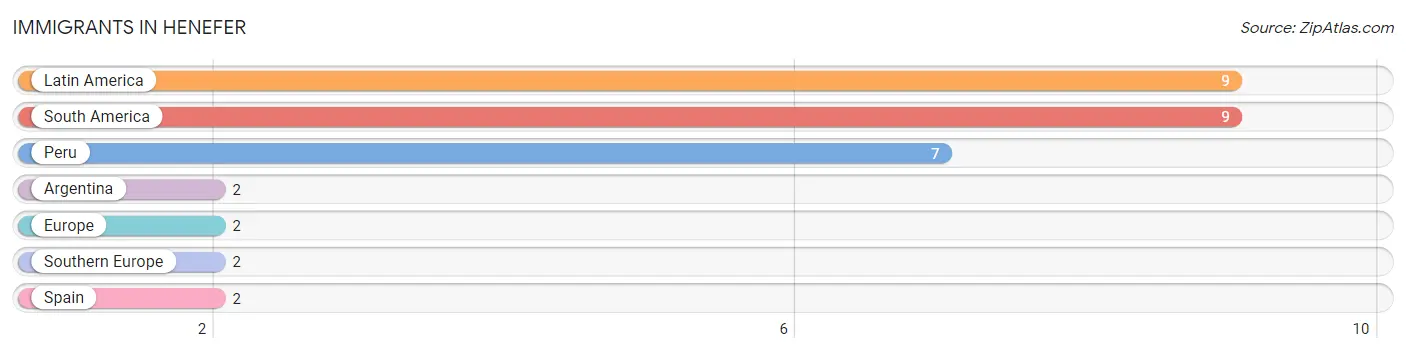
| Immigration Origin | # Population | % Population |
| Argentina | 2 | 0.3% |
| Europe | 2 | 0.3% |
| Latin America | 9 | 1.3% |
| Peru | 7 | 1.0% |
| South America | 9 | 1.3% |
| Southern Europe | 2 | 0.3% |
| Spain | 2 | 0.3% | View All 7 Rows |
Sex and Age in Henefer
Sex and Age in Henefer
The most populous age groups in Henefer are 45 to 49 Years (46 | 11.6%) for men and 5 to 9 Years (41 | 13.2%) for women.
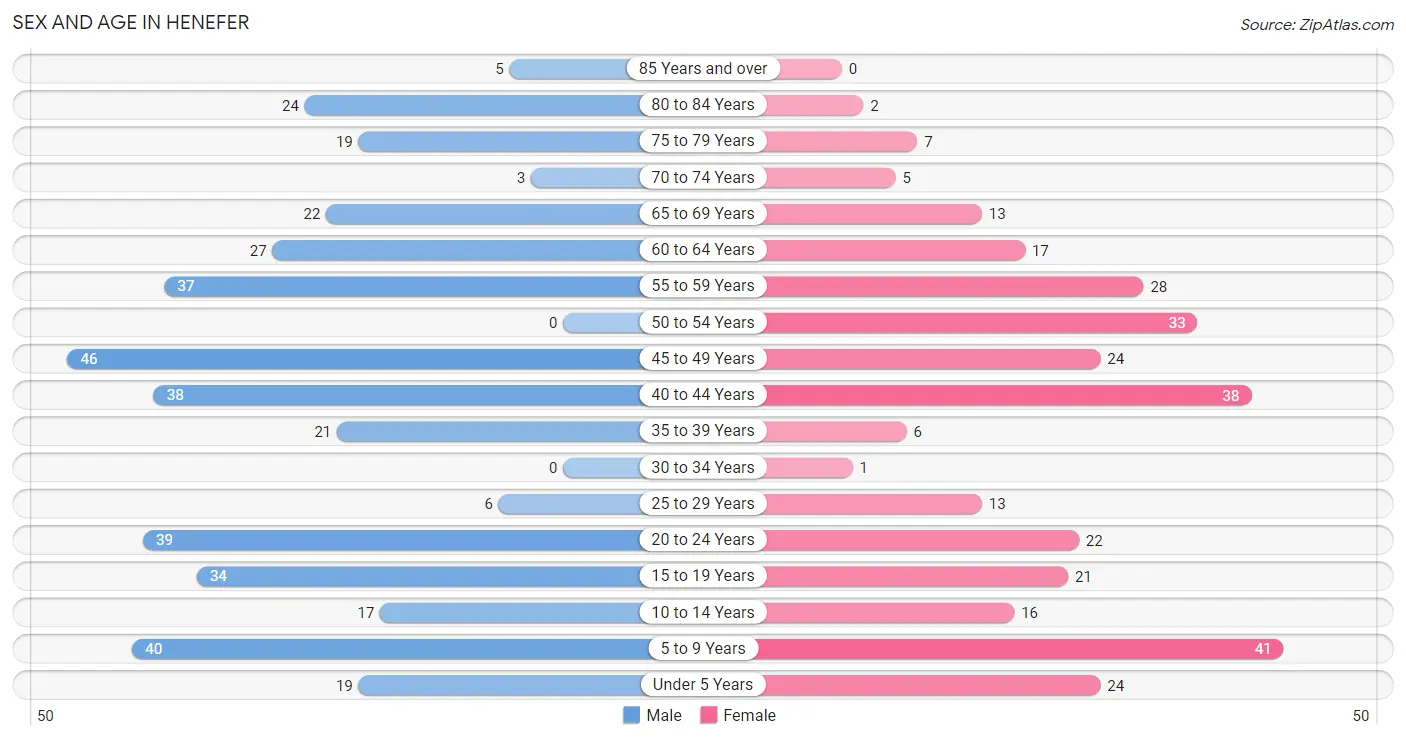
| Age Bracket | Male | Female |
| Under 5 Years | 19 (4.8%) | 24 (7.7%) |
| 5 to 9 Years | 40 (10.1%) | 41 (13.2%) |
| 10 to 14 Years | 17 (4.3%) | 16 (5.1%) |
| 15 to 19 Years | 34 (8.6%) | 21 (6.8%) |
| 20 to 24 Years | 39 (9.8%) | 22 (7.1%) |
| 25 to 29 Years | 6 (1.5%) | 13 (4.2%) |
| 30 to 34 Years | 0 (0.0%) | 1 (0.3%) |
| 35 to 39 Years | 21 (5.3%) | 6 (1.9%) |
| 40 to 44 Years | 38 (9.6%) | 38 (12.2%) |
| 45 to 49 Years | 46 (11.6%) | 24 (7.7%) |
| 50 to 54 Years | 0 (0.0%) | 33 (10.6%) |
| 55 to 59 Years | 37 (9.3%) | 28 (9.0%) |
| 60 to 64 Years | 27 (6.8%) | 17 (5.5%) |
| 65 to 69 Years | 22 (5.5%) | 13 (4.2%) |
| 70 to 74 Years | 3 (0.8%) | 5 (1.6%) |
| 75 to 79 Years | 19 (4.8%) | 7 (2.2%) |
| 80 to 84 Years | 24 (6.0%) | 2 (0.6%) |
| 85 Years and over | 5 (1.3%) | 0 (0.0%) |
| Total | 397 (100.0%) | 311 (100.0%) |
Families and Households in Henefer
Median Family Size in Henefer
The median family size in Henefer is 3.81 persons per family, with single female/mother families (1 | 0.6%) accounting for the largest median family size of 11 persons per family. On the other hand, married-couple families (151 | 95.0%) represent the smallest median family size with 3.72 persons per family.
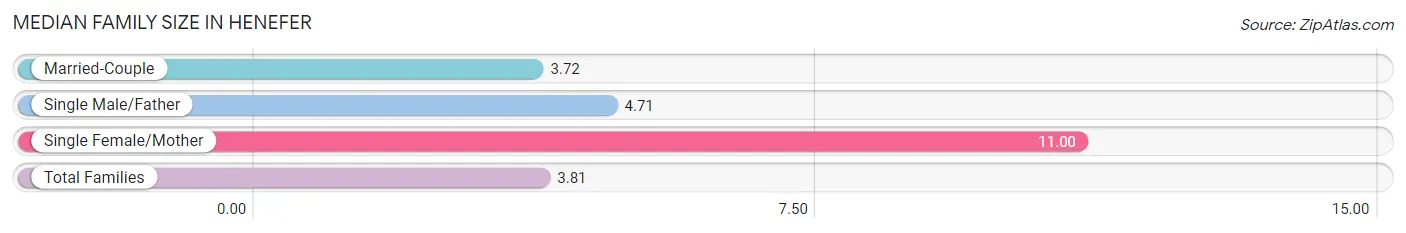
| Family Type | # Families | Family Size |
| Married-Couple | 151 (95.0%) | 3.72 |
| Single Male/Father | 7 (4.4%) | 4.71 |
| Single Female/Mother | 1 (0.6%) | 11.00 |
| Total Families | 159 (100.0%) | 3.81 |
Median Household Size in Henefer
The median household size in Henefer is 2.89 persons per household, with single female/mother households (1 | 0.4%) accounting for the largest median household size of 11 persons per household. non-family households (86 | 35.1%) represent the smallest median household size with 1.20 persons per household.
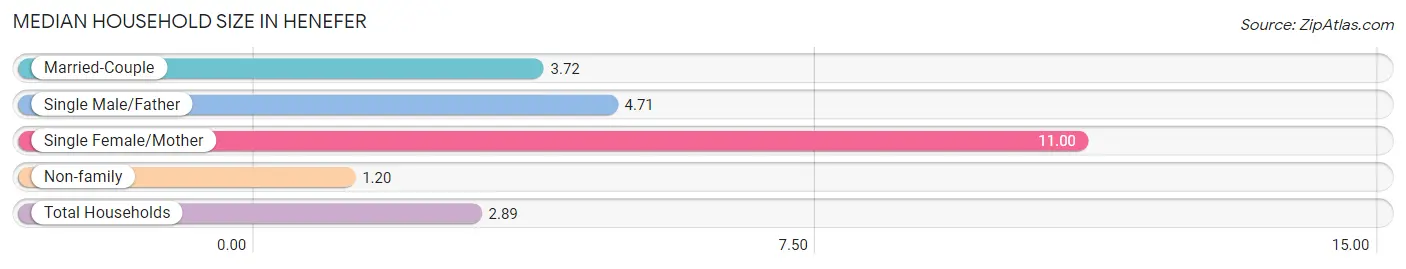
| Household Type | # Households | Household Size |
| Married-Couple | 151 (61.6%) | 3.72 |
| Single Male/Father | 7 (2.9%) | 4.71 |
| Single Female/Mother | 1 (0.4%) | 11.00 |
| Non-family | 86 (35.1%) | 1.20 |
| Total Households | 245 (100.0%) | 2.89 |
Household Size by Marriage Status in Henefer
Out of a total of 245 households in Henefer, 159 (64.9%) are family households, while 86 (35.1%) are nonfamily households. The most numerous type of family households are 2-person households, comprising 79, and the most common type of nonfamily households are 1-person households, comprising 63.
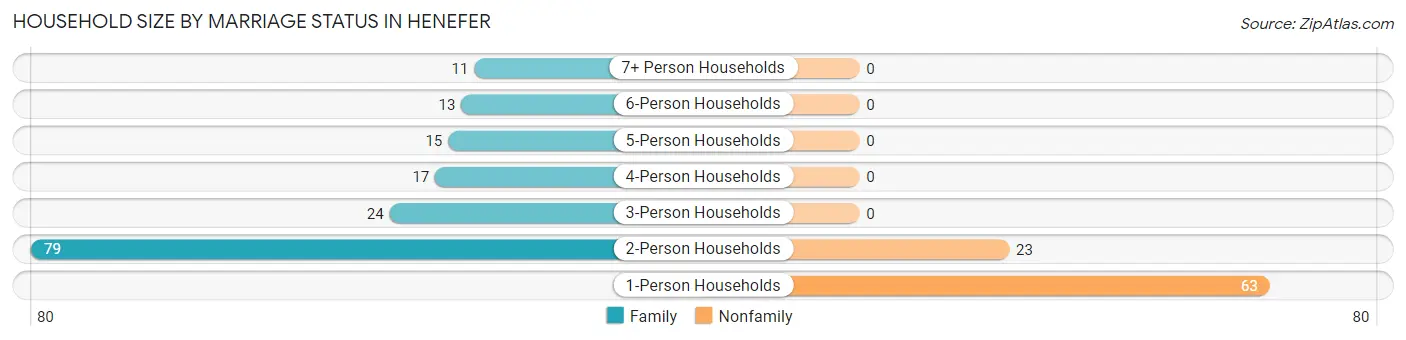
| Household Size | Family Households | Nonfamily Households |
| 1-Person Households | - | 63 (25.7%) |
| 2-Person Households | 79 (32.2%) | 23 (9.4%) |
| 3-Person Households | 24 (9.8%) | 0 (0.0%) |
| 4-Person Households | 17 (6.9%) | 0 (0.0%) |
| 5-Person Households | 15 (6.1%) | 0 (0.0%) |
| 6-Person Households | 13 (5.3%) | 0 (0.0%) |
| 7+ Person Households | 11 (4.5%) | 0 (0.0%) |
| Total | 159 (64.9%) | 86 (35.1%) |
Female Fertility in Henefer
Fertility by Age in Henefer
Average fertility rate in Henefer is 38.0 births per 1,000 women. Women in the age bracket of 35 to 50 years have the highest fertility rate with 68.0 births per 1,000 women. Women in the age bracket of 35 to 50 years acount for 100.0% of all women with births.
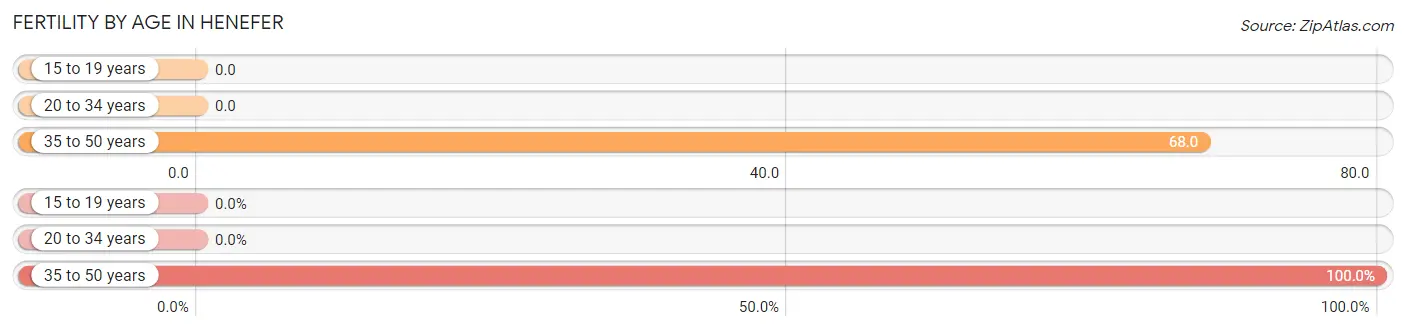
| Age Bracket | Women with Births | Births / 1,000 Women |
| 15 to 19 years | 0 (0.0%) | 0.0 |
| 20 to 34 years | 0 (0.0%) | 0.0 |
| 35 to 50 years | 5 (100.0%) | 68.0 |
| Total | 5 (100.0%) | 38.0 |
Fertility by Age by Marriage Status in Henefer
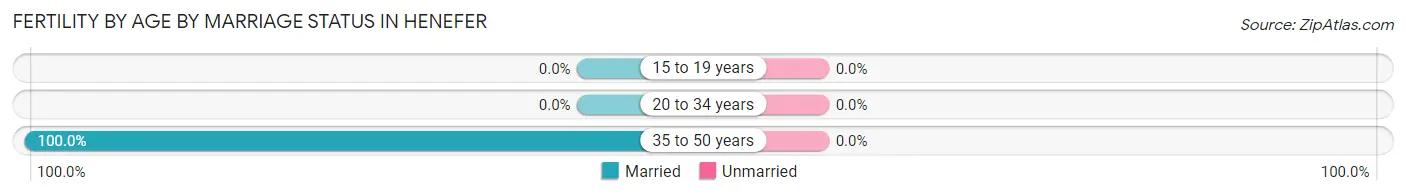
| Age Bracket | Married | Unmarried |
| 15 to 19 years | 0 (0.0%) | 0 (0.0%) |
| 20 to 34 years | 0 (0.0%) | 0 (0.0%) |
| 35 to 50 years | 5 (100.0%) | 0 (0.0%) |
| Total | 5 (100.0%) | 0 (0.0%) |
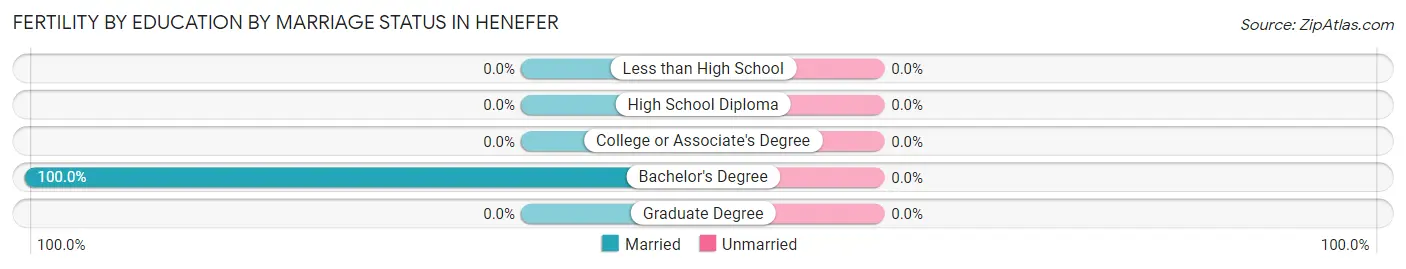
Fertility by Education in Henefer
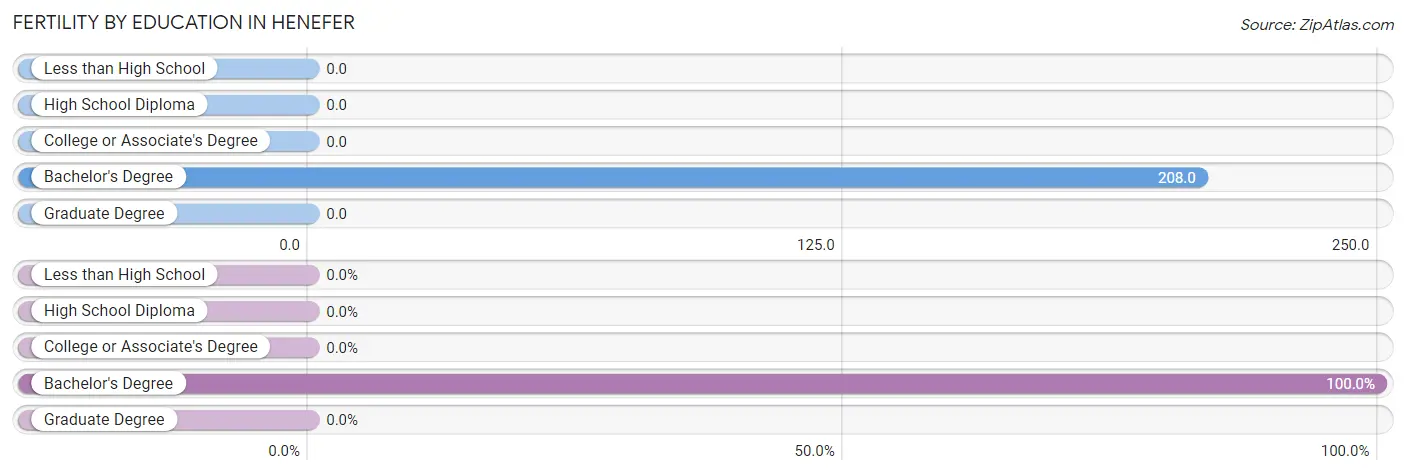
| Educational Attainment | Women with Births | Births / 1,000 Women |
| Less than High School | 0 (0.0%) | 0.0 |
| High School Diploma | 0 (0.0%) | 0.0 |
| College or Associate's Degree | 0 (0.0%) | 0.0 |
| Bachelor's Degree | 5 (100.0%) | 208.0 |
| Graduate Degree | 0 (0.0%) | 0.0 |
| Total | 5 (100.0%) | 38.0 |
Fertility by Education by Marriage Status in Henefer
| Educational Attainment | Married | Unmarried |
| Less than High School | 0 (0.0%) | 0 (0.0%) |
| High School Diploma | 0 (0.0%) | 0 (0.0%) |
| College or Associate's Degree | 0 (0.0%) | 0 (0.0%) |
| Bachelor's Degree | 5 (100.0%) | 0 (0.0%) |
| Graduate Degree | 0 (0.0%) | 0 (0.0%) |
| Total | 5 (100.0%) | 0 (0.0%) |
Employment Characteristics in Henefer
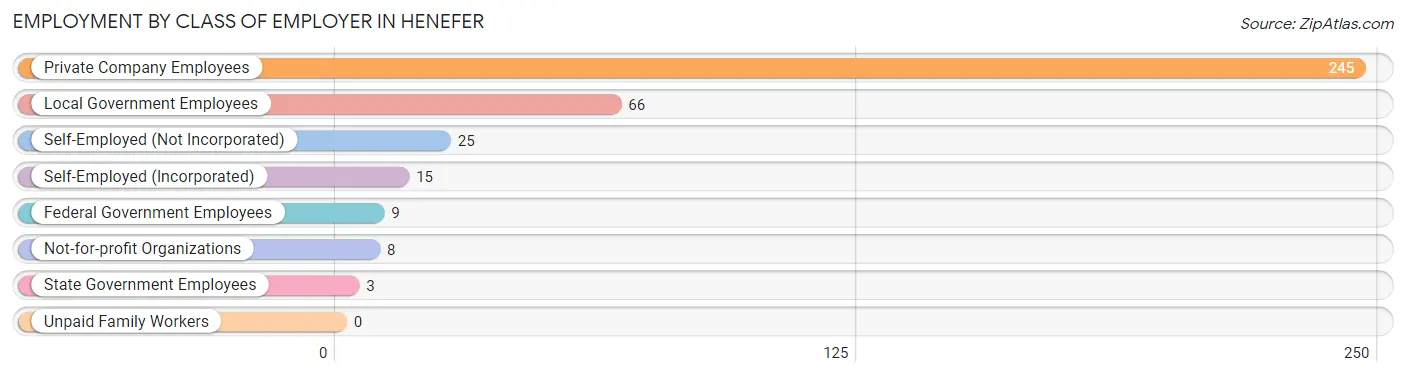
Employment by Class of Employer in Henefer
Among the 371 employed individuals in Henefer, private company employees (245 | 66.0%), local government employees (66 | 17.8%), and self-employed (not incorporated) (25 | 6.7%) make up the most common classes of employment.
| Employer Class | # Employees | % Employees |
| Private Company Employees | 245 | 66.0% |
| Self-Employed (Incorporated) | 15 | 4.0% |
| Self-Employed (Not Incorporated) | 25 | 6.7% |
| Not-for-profit Organizations | 8 | 2.2% |
| Local Government Employees | 66 | 17.8% |
| State Government Employees | 3 | 0.8% |
| Federal Government Employees | 9 | 2.4% |
| Unpaid Family Workers | 0 | 0.0% |
| Total | 371 | 100.0% |
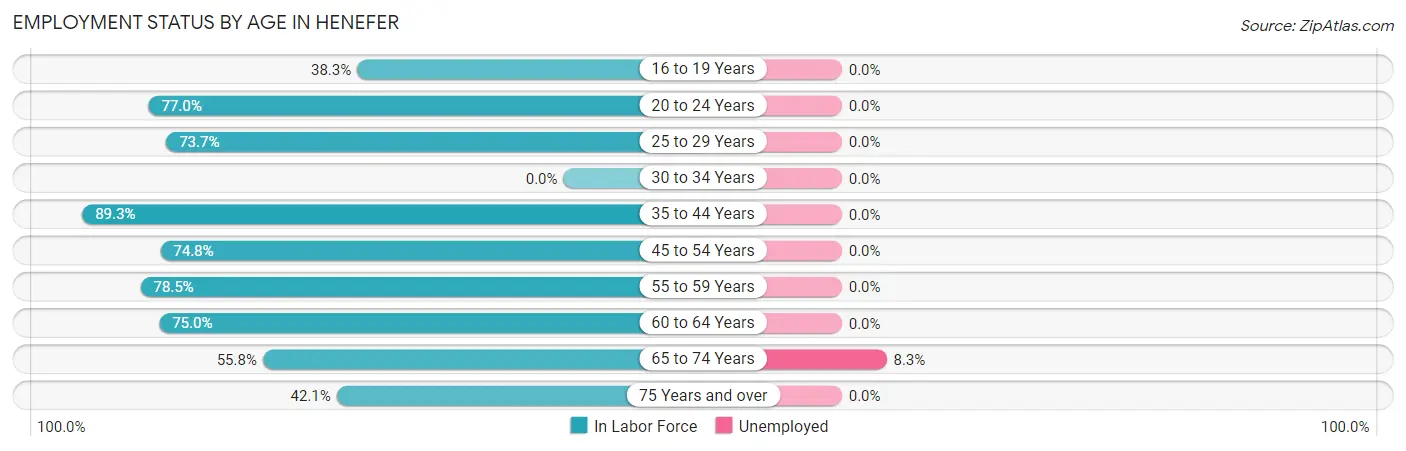
Employment Status by Age in Henefer
According to the labor force statistics for Henefer, out of the total population over 16 years of age (543), 70.0% or 380 individuals are in the labor force, with 0.5% or 2 of them unemployed. The age group with the highest labor force participation rate is 35 to 44 years, with 89.3% or 92 individuals in the labor force. Within the labor force, the 65 to 74 years age range has the highest percentage of unemployed individuals, with 8.3% or 2 of them being unemployed.
| Age Bracket | In Labor Force | Unemployed |
| 16 to 19 Years | 18 (38.3%) | 0 (0.0%) |
| 20 to 24 Years | 47 (77.0%) | 0 (0.0%) |
| 25 to 29 Years | 14 (73.7%) | 0 (0.0%) |
| 30 to 34 Years | 0 (0.0%) | 0 (0.0%) |
| 35 to 44 Years | 92 (89.3%) | 0 (0.0%) |
| 45 to 54 Years | 77 (74.8%) | 0 (0.0%) |
| 55 to 59 Years | 51 (78.5%) | 0 (0.0%) |
| 60 to 64 Years | 33 (75.0%) | 0 (0.0%) |
| 65 to 74 Years | 24 (55.8%) | 2 (8.3%) |
| 75 Years and over | 24 (42.1%) | 0 (0.0%) |
| Total | 380 (70.0%) | 2 (0.5%) |
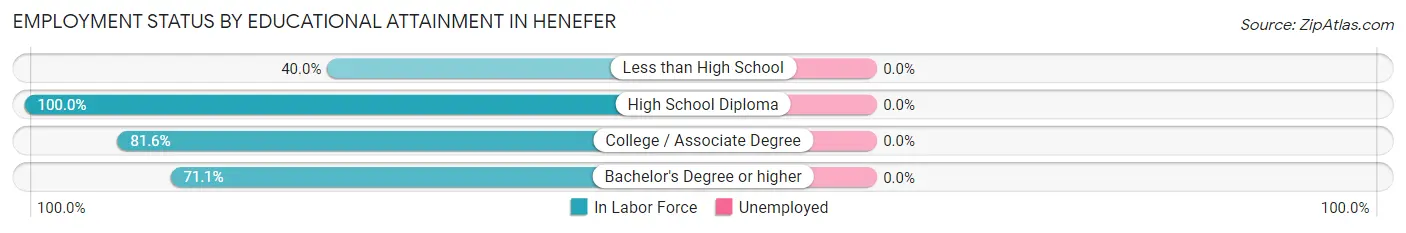
Employment Status by Educational Attainment in Henefer
| Educational Attainment | In Labor Force | Unemployed |
| Less than High School | 4 (40.0%) | 0 (0.0%) |
| High School Diploma | 61 (100.0%) | 0 (0.0%) |
| College / Associate Degree | 111 (81.6%) | 0 (0.0%) |
| Bachelor's Degree or higher | 91 (71.1%) | 0 (0.0%) |
| Total | 267 (79.7%) | 0 (0.0%) |
Employment Occupations by Sex in Henefer
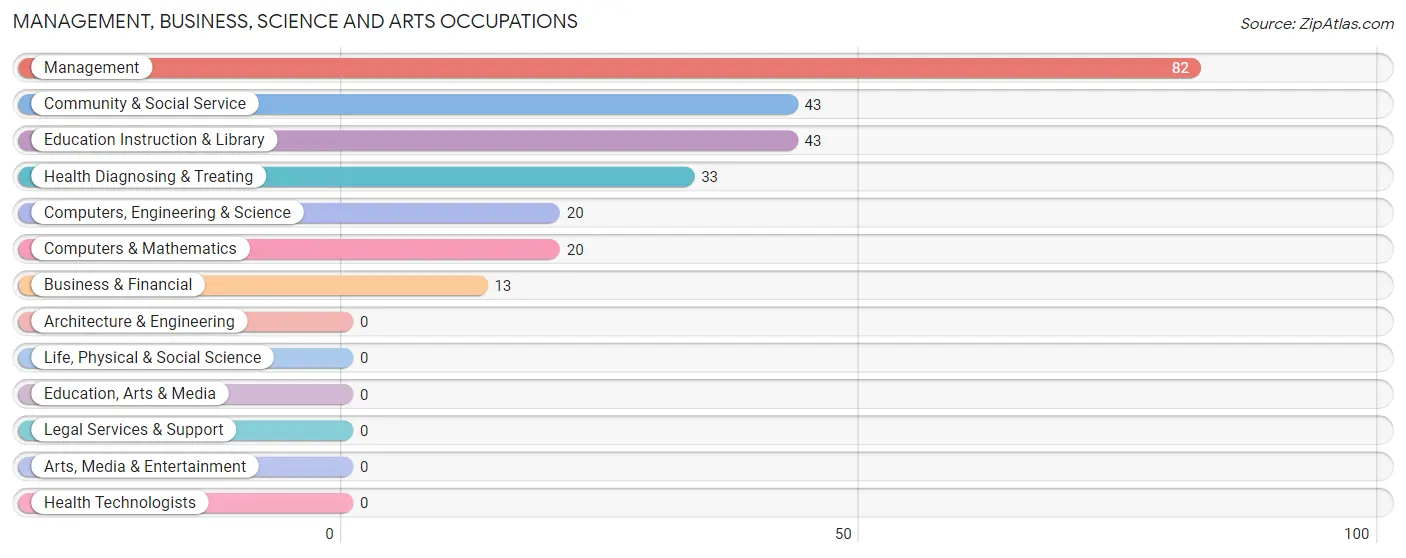
Management, Business, Science and Arts Occupations
The most common Management, Business, Science and Arts occupations in Henefer are Management (82 | 21.7%), Community & Social Service (43 | 11.4%), Education Instruction & Library (43 | 11.4%), Health Diagnosing & Treating (33 | 8.7%), and Computers, Engineering & Science (20 | 5.3%).
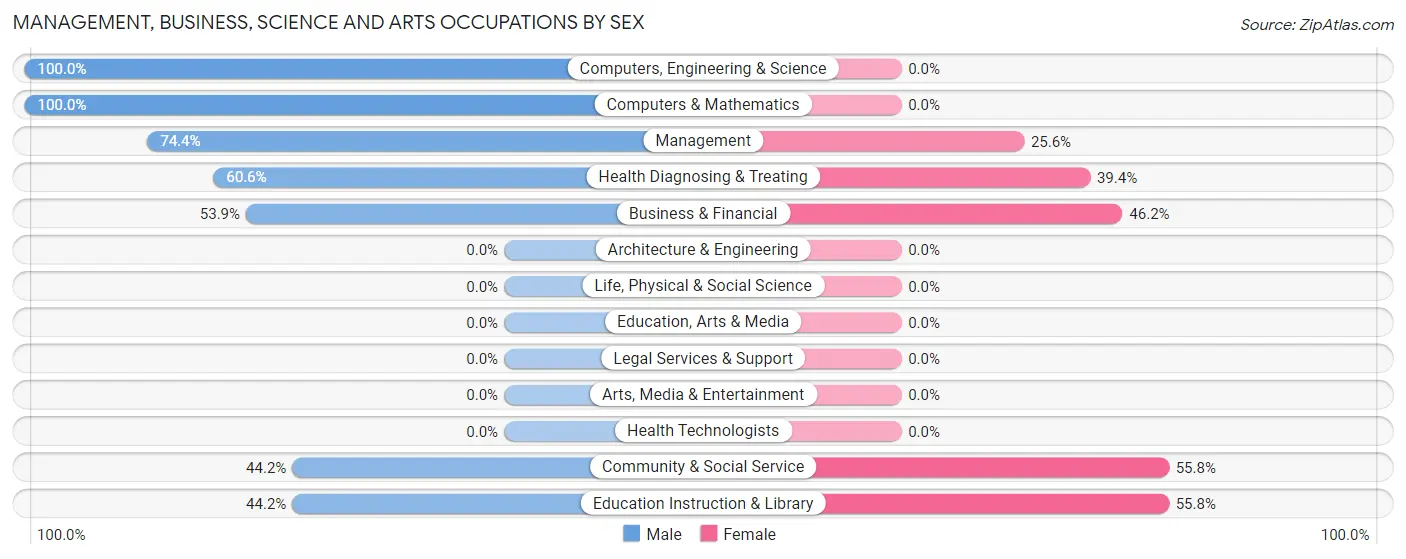
Management, Business, Science and Arts Occupations by Sex
Within the Management, Business, Science and Arts occupations in Henefer, the most male-oriented occupations are Computers, Engineering & Science (100.0%), Computers & Mathematics (100.0%), and Management (74.4%), while the most female-oriented occupations are Community & Social Service (55.8%), Education Instruction & Library (55.8%), and Business & Financial (46.2%).
| Occupation | Male | Female |
| Management | 61 (74.4%) | 21 (25.6%) |
| Business & Financial | 7 (53.8%) | 6 (46.2%) |
| Computers, Engineering & Science | 20 (100.0%) | 0 (0.0%) |
| Computers & Mathematics | 20 (100.0%) | 0 (0.0%) |
| Architecture & Engineering | 0 (0.0%) | 0 (0.0%) |
| Life, Physical & Social Science | 0 (0.0%) | 0 (0.0%) |
| Community & Social Service | 19 (44.2%) | 24 (55.8%) |
| Education, Arts & Media | 0 (0.0%) | 0 (0.0%) |
| Legal Services & Support | 0 (0.0%) | 0 (0.0%) |
| Education Instruction & Library | 19 (44.2%) | 24 (55.8%) |
| Arts, Media & Entertainment | 0 (0.0%) | 0 (0.0%) |
| Health Diagnosing & Treating | 20 (60.6%) | 13 (39.4%) |
| Health Technologists | 0 (0.0%) | 0 (0.0%) |
| Total (Category) | 127 (66.5%) | 64 (33.5%) |
| Total (Overall) | 239 (63.2%) | 139 (36.8%) |
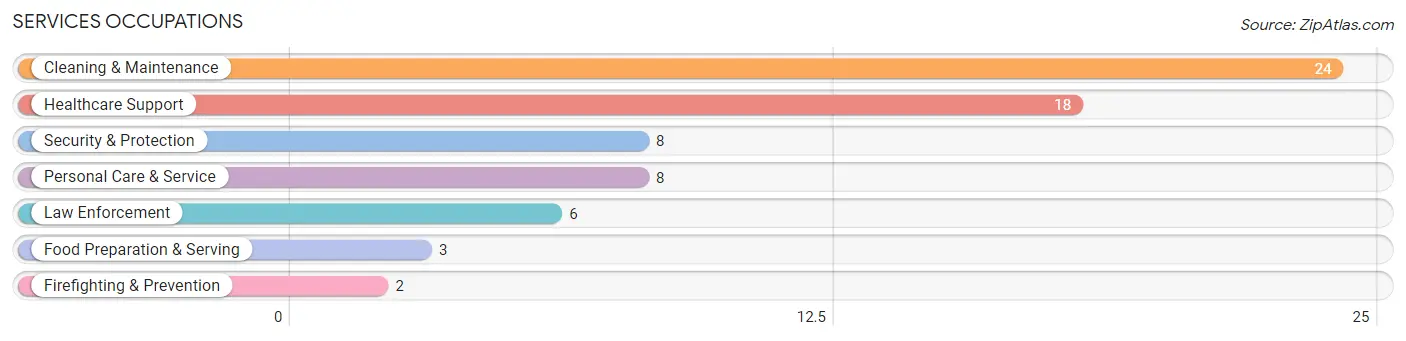
Services Occupations
The most common Services occupations in Henefer are Cleaning & Maintenance (24 | 6.4%), Healthcare Support (18 | 4.8%), Security & Protection (8 | 2.1%), Personal Care & Service (8 | 2.1%), and Law Enforcement (6 | 1.6%).
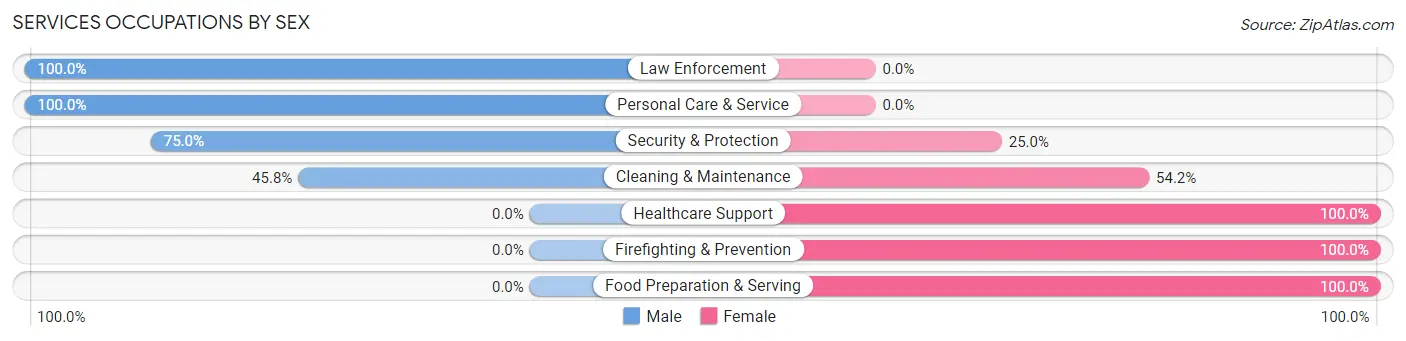
Services Occupations by Sex
Within the Services occupations in Henefer, the most male-oriented occupations are Law Enforcement (100.0%), Personal Care & Service (100.0%), and Security & Protection (75.0%), while the most female-oriented occupations are Healthcare Support (100.0%), Firefighting & Prevention (100.0%), and Food Preparation & Serving (100.0%).
| Occupation | Male | Female |
| Healthcare Support | 0 (0.0%) | 18 (100.0%) |
| Security & Protection | 6 (75.0%) | 2 (25.0%) |
| Firefighting & Prevention | 0 (0.0%) | 2 (100.0%) |
| Law Enforcement | 6 (100.0%) | 0 (0.0%) |
| Food Preparation & Serving | 0 (0.0%) | 3 (100.0%) |
| Cleaning & Maintenance | 11 (45.8%) | 13 (54.2%) |
| Personal Care & Service | 8 (100.0%) | 0 (0.0%) |
| Total (Category) | 25 (41.0%) | 36 (59.0%) |
| Total (Overall) | 239 (63.2%) | 139 (36.8%) |
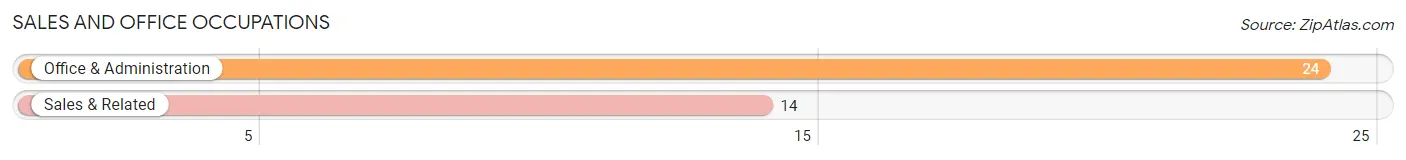
Sales and Office Occupations
The most common Sales and Office occupations in Henefer are Office & Administration (24 | 6.4%), and Sales & Related (14 | 3.7%).
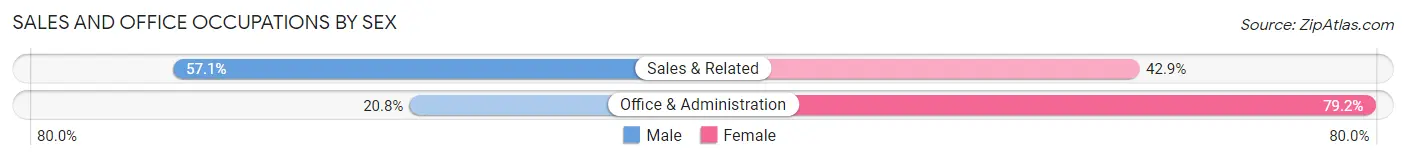
Sales and Office Occupations by Sex
| Occupation | Male | Female |
| Sales & Related | 8 (57.1%) | 6 (42.9%) |
| Office & Administration | 5 (20.8%) | 19 (79.2%) |
| Total (Category) | 13 (34.2%) | 25 (65.8%) |
| Total (Overall) | 239 (63.2%) | 139 (36.8%) |
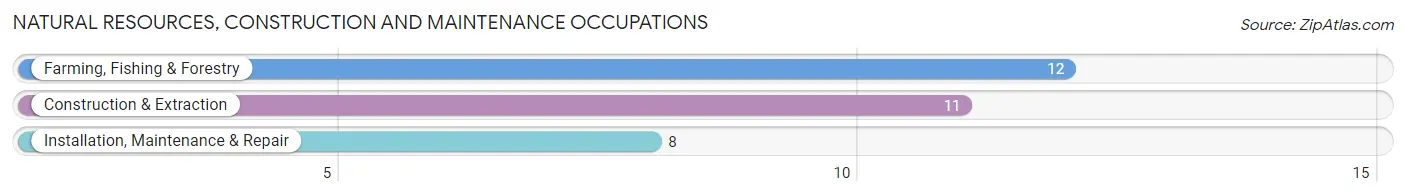
Natural Resources, Construction and Maintenance Occupations
The most common Natural Resources, Construction and Maintenance occupations in Henefer are Farming, Fishing & Forestry (12 | 3.2%), Construction & Extraction (11 | 2.9%), and Installation, Maintenance & Repair (8 | 2.1%).
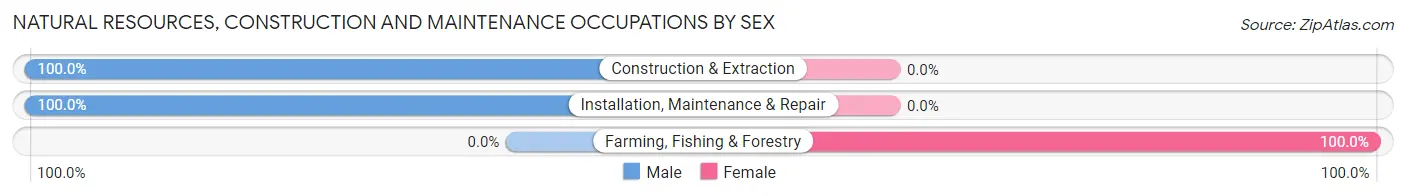
Natural Resources, Construction and Maintenance Occupations by Sex
| Occupation | Male | Female |
| Farming, Fishing & Forestry | 0 (0.0%) | 12 (100.0%) |
| Construction & Extraction | 11 (100.0%) | 0 (0.0%) |
| Installation, Maintenance & Repair | 8 (100.0%) | 0 (0.0%) |
| Total (Category) | 19 (61.3%) | 12 (38.7%) |
| Total (Overall) | 239 (63.2%) | 139 (36.8%) |
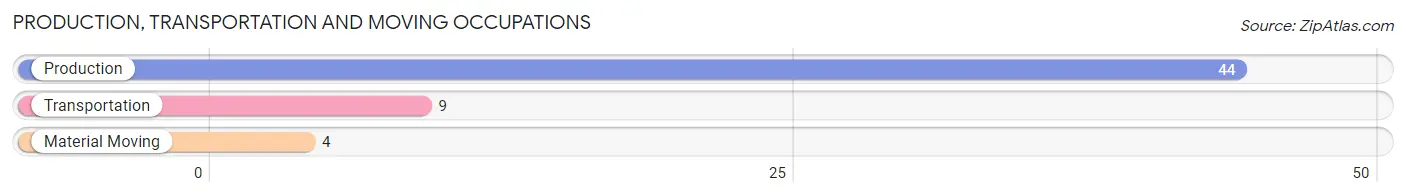
Production, Transportation and Moving Occupations
The most common Production, Transportation and Moving occupations in Henefer are Production (44 | 11.6%), Transportation (9 | 2.4%), and Material Moving (4 | 1.1%).
Production, Transportation and Moving Occupations by Sex
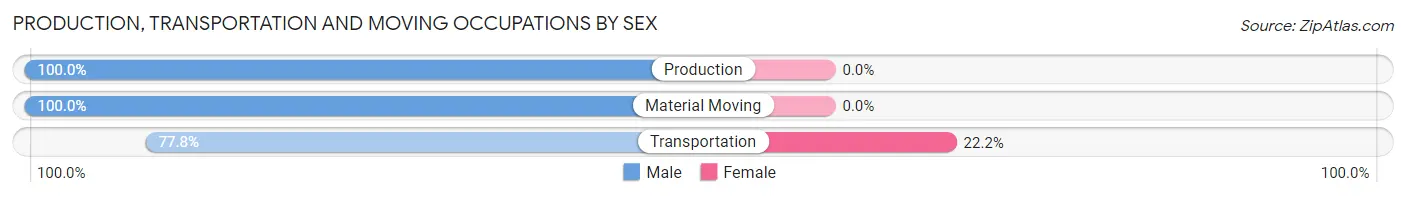
| Occupation | Male | Female |
| Production | 44 (100.0%) | 0 (0.0%) |
| Transportation | 7 (77.8%) | 2 (22.2%) |
| Material Moving | 4 (100.0%) | 0 (0.0%) |
| Total (Category) | 55 (96.5%) | 2 (3.5%) |
| Total (Overall) | 239 (63.2%) | 139 (36.8%) |
Employment Industries by Sex in Henefer
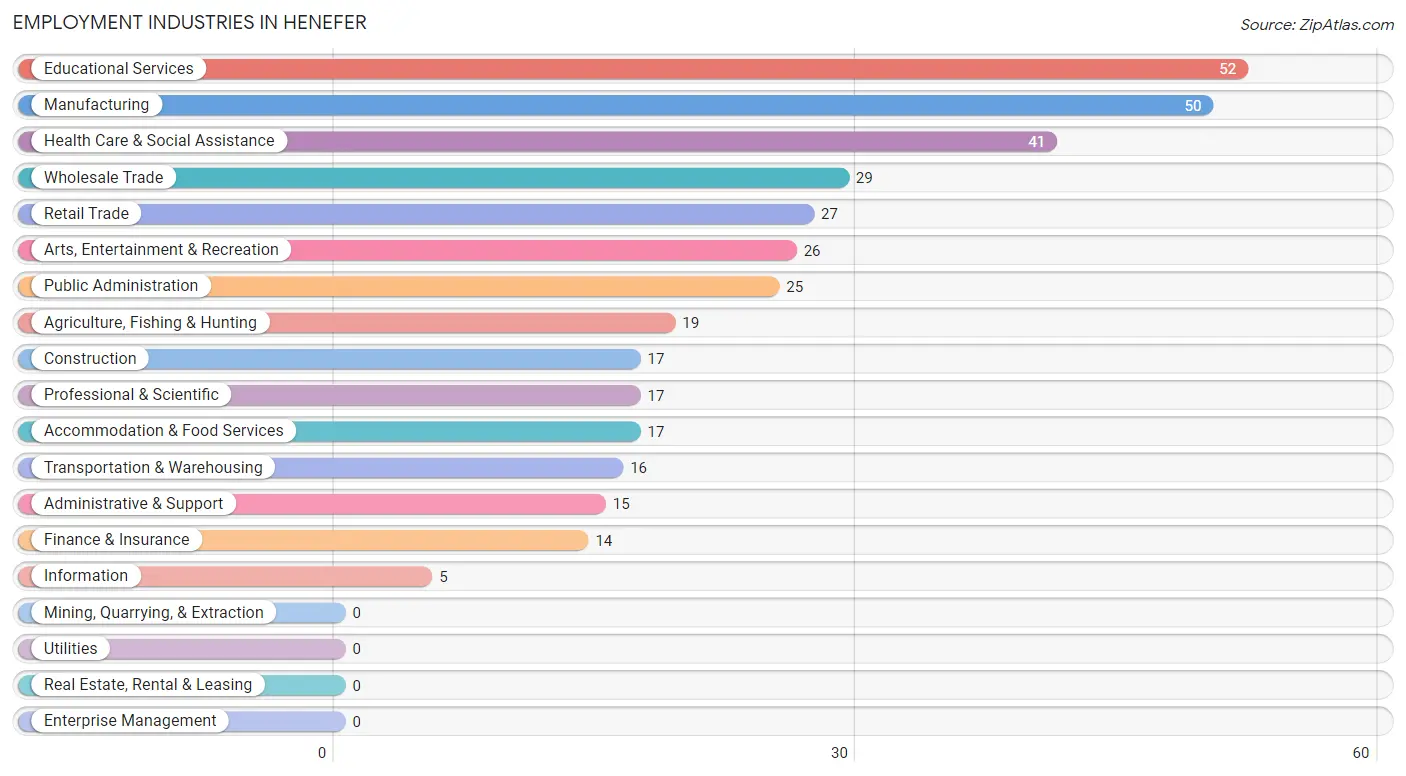
Employment Industries in Henefer
The major employment industries in Henefer include Educational Services (52 | 13.8%), Manufacturing (50 | 13.2%), Health Care & Social Assistance (41 | 10.8%), Wholesale Trade (29 | 7.7%), and Retail Trade (27 | 7.1%).
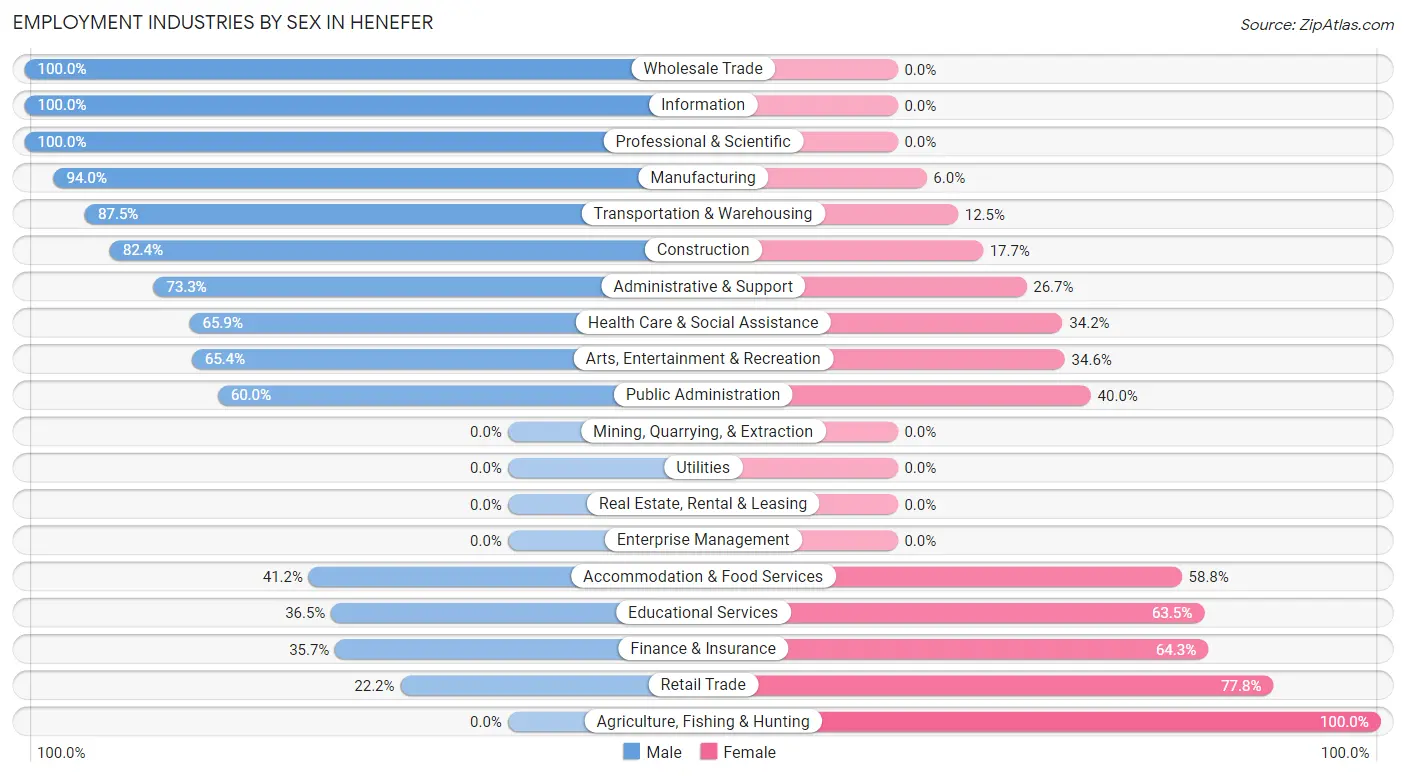
Employment Industries by Sex in Henefer
The Henefer industries that see more men than women are Wholesale Trade (100.0%), Information (100.0%), and Professional & Scientific (100.0%), whereas the industries that tend to have a higher number of women are Agriculture, Fishing & Hunting (100.0%), Retail Trade (77.8%), and Finance & Insurance (64.3%).
| Industry | Male | Female |
| Agriculture, Fishing & Hunting | 0 (0.0%) | 19 (100.0%) |
| Mining, Quarrying, & Extraction | 0 (0.0%) | 0 (0.0%) |
| Construction | 14 (82.4%) | 3 (17.6%) |
| Manufacturing | 47 (94.0%) | 3 (6.0%) |
| Wholesale Trade | 29 (100.0%) | 0 (0.0%) |
| Retail Trade | 6 (22.2%) | 21 (77.8%) |
| Transportation & Warehousing | 14 (87.5%) | 2 (12.5%) |
| Utilities | 0 (0.0%) | 0 (0.0%) |
| Information | 5 (100.0%) | 0 (0.0%) |
| Finance & Insurance | 5 (35.7%) | 9 (64.3%) |
| Real Estate, Rental & Leasing | 0 (0.0%) | 0 (0.0%) |
| Professional & Scientific | 17 (100.0%) | 0 (0.0%) |
| Enterprise Management | 0 (0.0%) | 0 (0.0%) |
| Administrative & Support | 11 (73.3%) | 4 (26.7%) |
| Educational Services | 19 (36.5%) | 33 (63.5%) |
| Health Care & Social Assistance | 27 (65.8%) | 14 (34.2%) |
| Arts, Entertainment & Recreation | 17 (65.4%) | 9 (34.6%) |
| Accommodation & Food Services | 7 (41.2%) | 10 (58.8%) |
| Public Administration | 15 (60.0%) | 10 (40.0%) |
| Total | 239 (63.2%) | 139 (36.8%) |
Education in Henefer
School Enrollment in Henefer
The most common levels of schooling among the 226 students in Henefer are elementary school (56 | 24.8%), high school (52 | 23.0%), and college / undergraduate (48 | 21.2%).
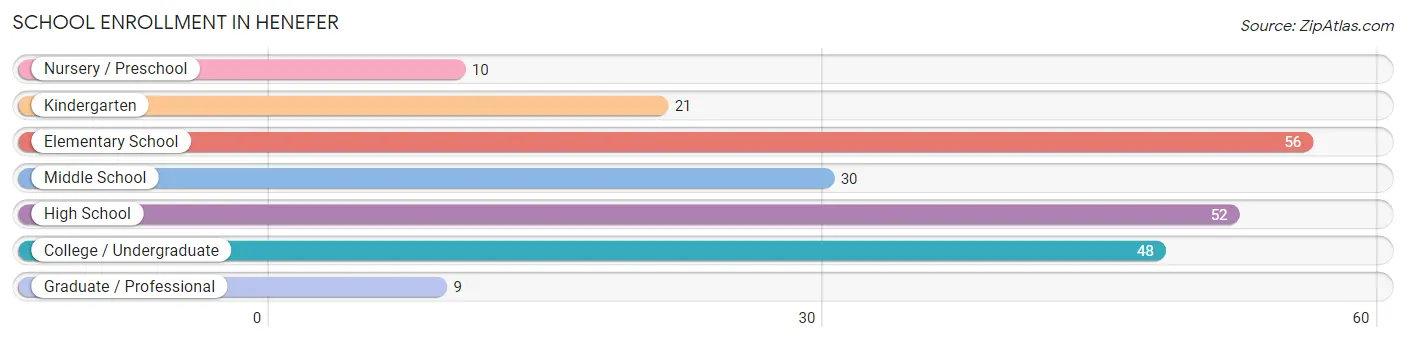
| School Level | # Students | % Students |
| Nursery / Preschool | 10 | 4.4% |
| Kindergarten | 21 | 9.3% |
| Elementary School | 56 | 24.8% |
| Middle School | 30 | 13.3% |
| High School | 52 | 23.0% |
| College / Undergraduate | 48 | 21.2% |
| Graduate / Professional | 9 | 4.0% |
| Total | 226 | 100.0% |
School Enrollment by Age by Funding Source in Henefer
Out of a total of 226 students who are enrolled in schools in Henefer, 3 (1.3%) attend a private institution, while the remaining 223 (98.7%) are enrolled in public schools. The age group of 10 to 14 year olds has the highest likelihood of being enrolled in private schools, with 3 (9.1% in the age bracket) enrolled. Conversely, the age group of 3 to 4 year olds has the lowest likelihood of being enrolled in a private school, with 3 (100.0% in the age bracket) attending a public institution.
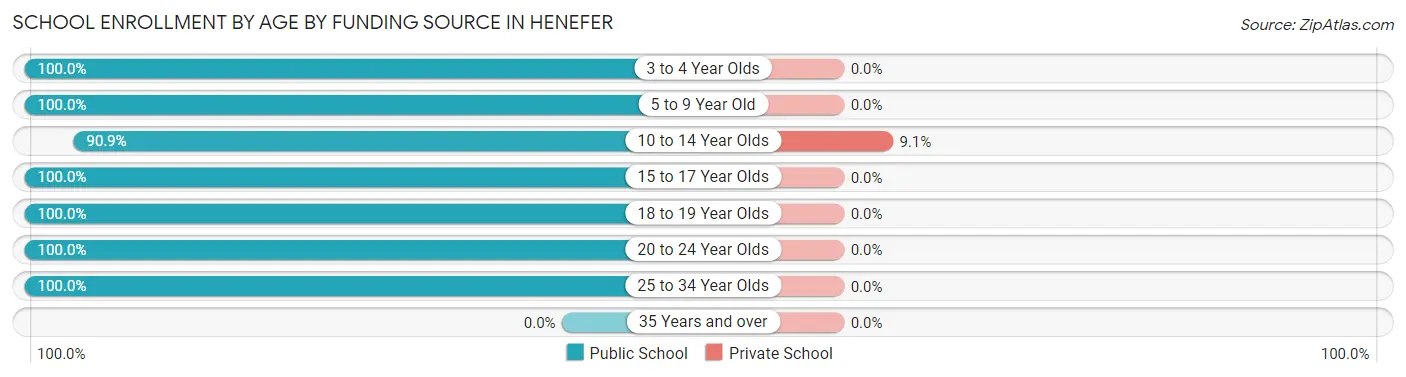
| Age Bracket | Public School | Private School |
| 3 to 4 Year Olds | 3 (100.0%) | 0 (0.0%) |
| 5 to 9 Year Old | 81 (100.0%) | 0 (0.0%) |
| 10 to 14 Year Olds | 30 (90.9%) | 3 (9.1%) |
| 15 to 17 Year Olds | 39 (100.0%) | 0 (0.0%) |
| 18 to 19 Year Olds | 16 (100.0%) | 0 (0.0%) |
| 20 to 24 Year Olds | 49 (100.0%) | 0 (0.0%) |
| 25 to 34 Year Olds | 5 (100.0%) | 0 (0.0%) |
| 35 Years and over | 0 (0.0%) | 0 (0.0%) |
| Total | 223 (98.7%) | 3 (1.3%) |
Educational Attainment by Field of Study in Henefer
Education (44 | 28.4%), science & technology (29 | 18.7%), bio, nature & agricultural (26 | 16.8%), business (23 | 14.8%), and physical & health sciences (8 | 5.2%) are the most common fields of study among 155 individuals in Henefer who have obtained a bachelor's degree or higher.
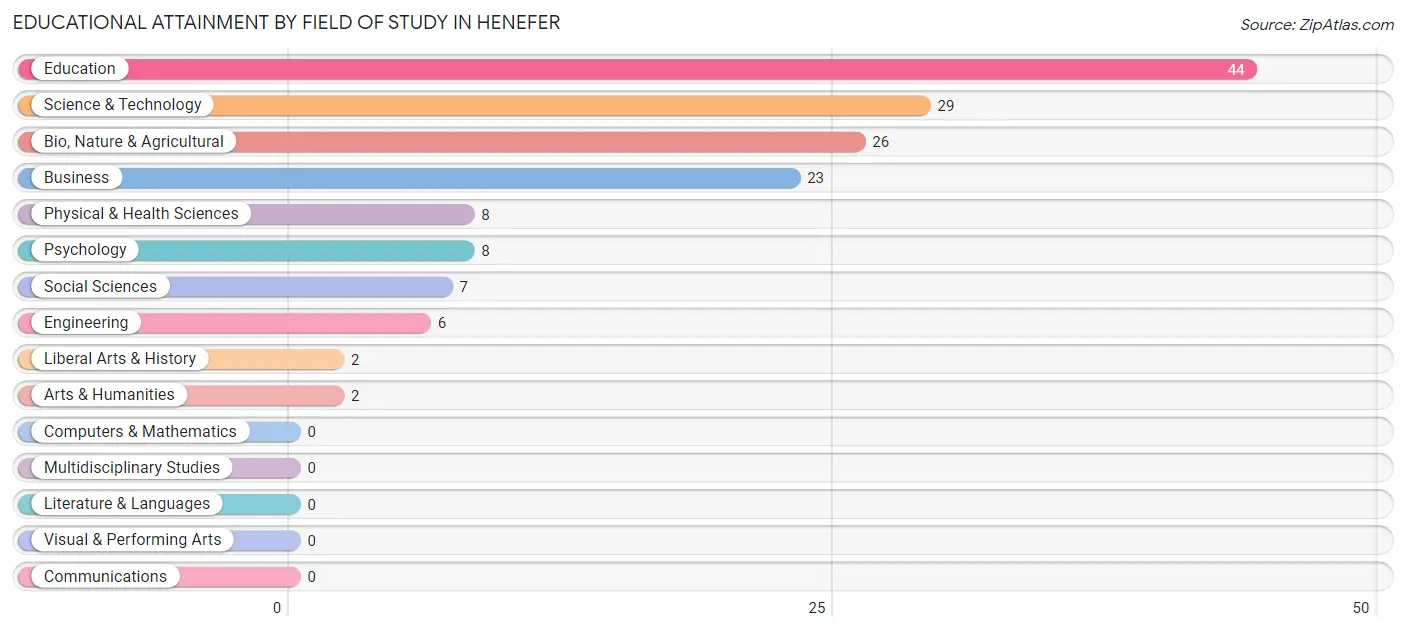
| Field of Study | # Graduates | % Graduates |
| Computers & Mathematics | 0 | 0.0% |
| Bio, Nature & Agricultural | 26 | 16.8% |
| Physical & Health Sciences | 8 | 5.2% |
| Psychology | 8 | 5.2% |
| Social Sciences | 7 | 4.5% |
| Engineering | 6 | 3.9% |
| Multidisciplinary Studies | 0 | 0.0% |
| Science & Technology | 29 | 18.7% |
| Business | 23 | 14.8% |
| Education | 44 | 28.4% |
| Literature & Languages | 0 | 0.0% |
| Liberal Arts & History | 2 | 1.3% |
| Visual & Performing Arts | 0 | 0.0% |
| Communications | 0 | 0.0% |
| Arts & Humanities | 2 | 1.3% |
| Total | 155 | 100.0% |
Transportation & Commute in Henefer
Vehicle Availability by Sex in Henefer
The most prevalent vehicle ownership categories in Henefer are males with 3 vehicles (81, accounting for 34.2%) and females with 3 vehicles (53, making up 60.5%).
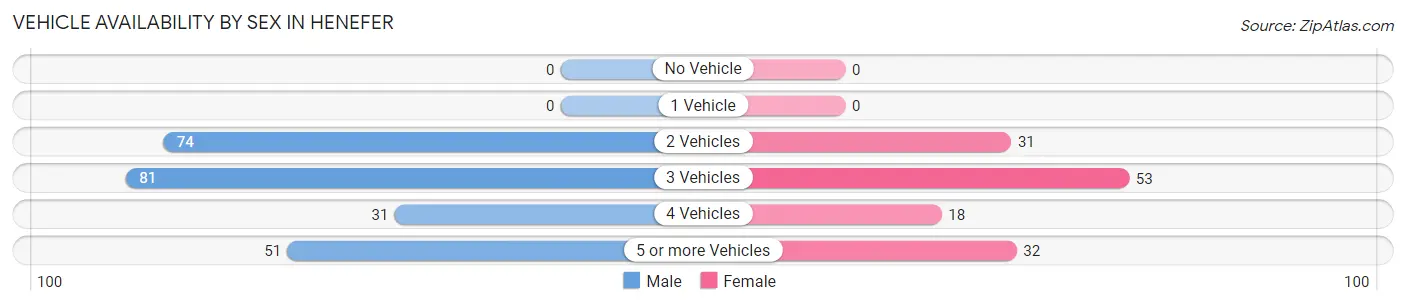
| Vehicles Available | Male | Female |
| No Vehicle | 0 (0.0%) | 0 (0.0%) |
| 1 Vehicle | 0 (0.0%) | 0 (0.0%) |
| 2 Vehicles | 74 (31.2%) | 31 (23.1%) |
| 3 Vehicles | 81 (34.2%) | 53 (39.6%) |
| 4 Vehicles | 31 (13.1%) | 18 (13.4%) |
| 5 or more Vehicles | 51 (21.5%) | 32 (23.9%) |
| Total | 237 (100.0%) | 134 (100.0%) |
Commute Time in Henefer
The most frequently occuring commute durations in Henefer are 15 to 19 minutes (62 commuters, 20.3%), 45 to 59 minutes (48 commuters, 15.7%), and 30 to 34 minutes (42 commuters, 13.8%).
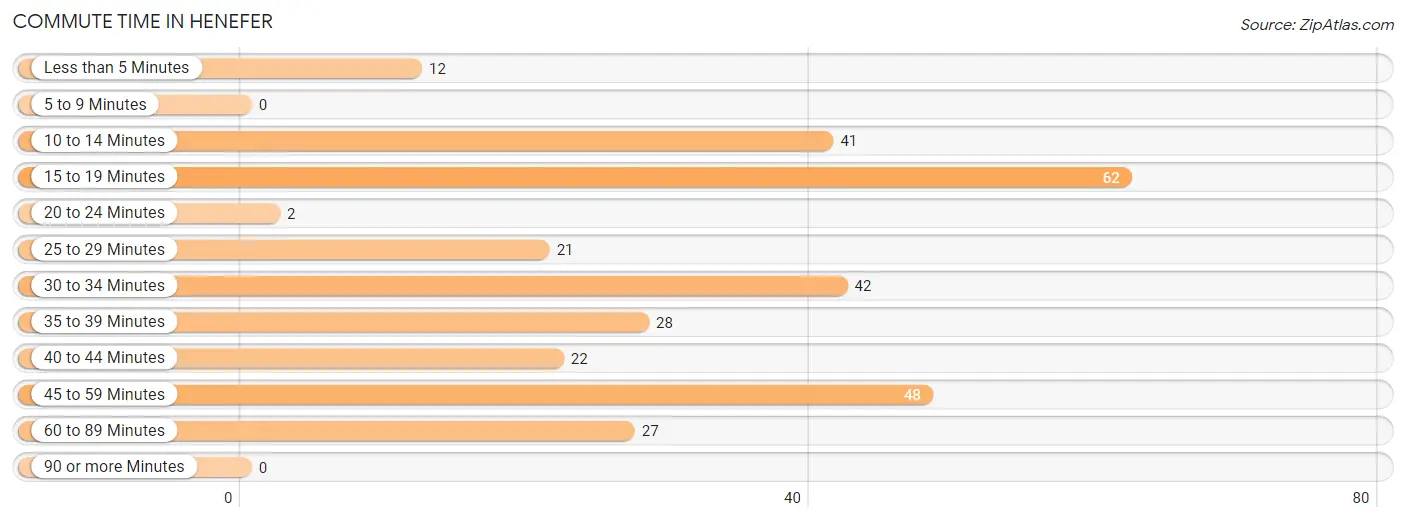
| Commute Time | # Commuters | % Commuters |
| Less than 5 Minutes | 12 | 3.9% |
| 5 to 9 Minutes | 0 | 0.0% |
| 10 to 14 Minutes | 41 | 13.4% |
| 15 to 19 Minutes | 62 | 20.3% |
| 20 to 24 Minutes | 2 | 0.7% |
| 25 to 29 Minutes | 21 | 6.9% |
| 30 to 34 Minutes | 42 | 13.8% |
| 35 to 39 Minutes | 28 | 9.2% |
| 40 to 44 Minutes | 22 | 7.2% |
| 45 to 59 Minutes | 48 | 15.7% |
| 60 to 89 Minutes | 27 | 8.8% |
| 90 or more Minutes | 0 | 0.0% |
Commute Time by Sex in Henefer
The most common commute times in Henefer are 45 to 59 minutes (48 commuters, 24.5%) for males and 15 to 19 minutes (29 commuters, 26.6%) for females.
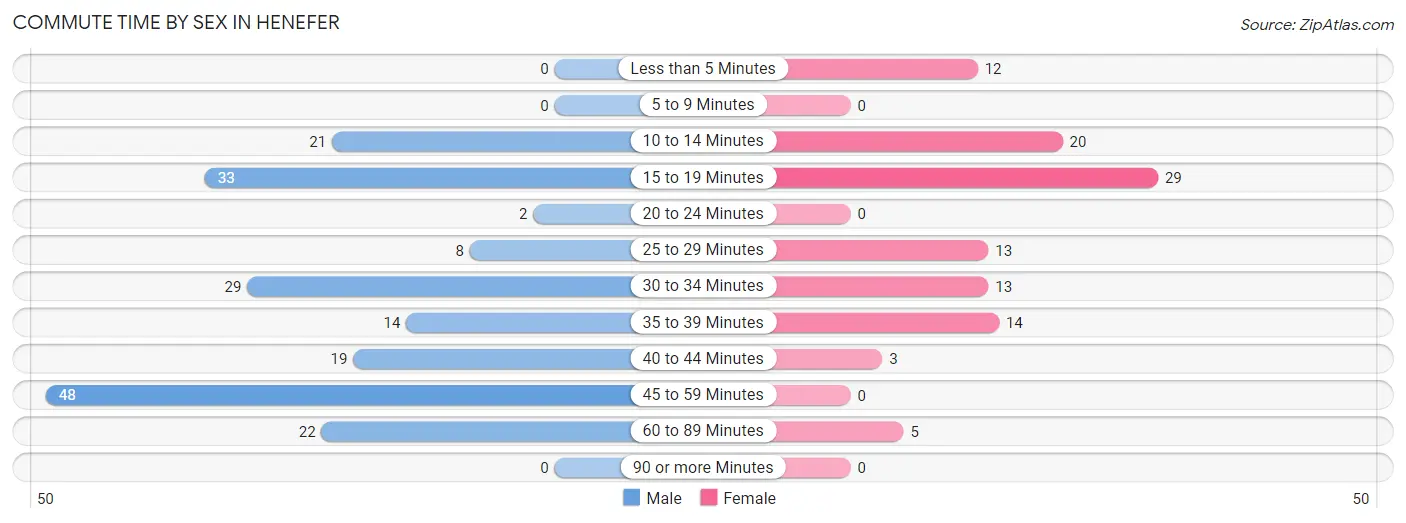
| Commute Time | Male | Female |
| Less than 5 Minutes | 0 (0.0%) | 12 (11.0%) |
| 5 to 9 Minutes | 0 (0.0%) | 0 (0.0%) |
| 10 to 14 Minutes | 21 (10.7%) | 20 (18.3%) |
| 15 to 19 Minutes | 33 (16.8%) | 29 (26.6%) |
| 20 to 24 Minutes | 2 (1.0%) | 0 (0.0%) |
| 25 to 29 Minutes | 8 (4.1%) | 13 (11.9%) |
| 30 to 34 Minutes | 29 (14.8%) | 13 (11.9%) |
| 35 to 39 Minutes | 14 (7.1%) | 14 (12.8%) |
| 40 to 44 Minutes | 19 (9.7%) | 3 (2.8%) |
| 45 to 59 Minutes | 48 (24.5%) | 0 (0.0%) |
| 60 to 89 Minutes | 22 (11.2%) | 5 (4.6%) |
| 90 or more Minutes | 0 (0.0%) | 0 (0.0%) |
Time of Departure to Work by Sex in Henefer
The most frequent times of departure to work in Henefer are 7:00 AM to 7:29 AM (51, 26.0%) for males and 7:30 AM to 7:59 AM (32, 29.4%) for females.
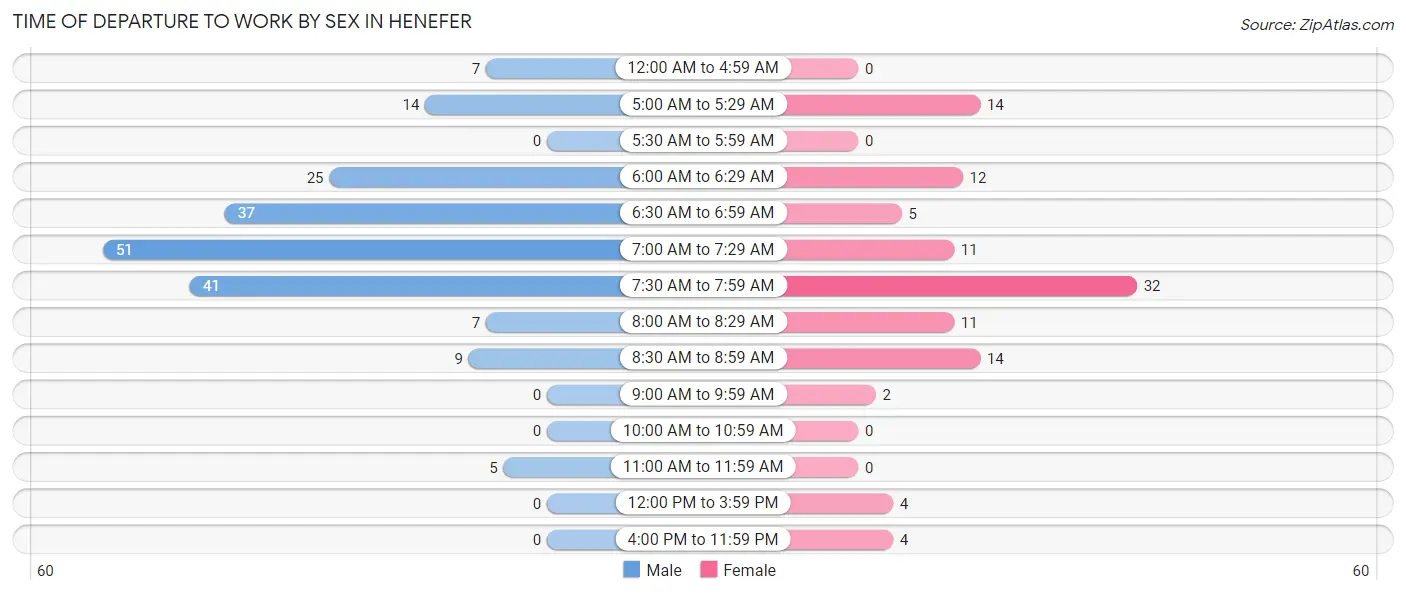
| Time of Departure | Male | Female |
| 12:00 AM to 4:59 AM | 7 (3.6%) | 0 (0.0%) |
| 5:00 AM to 5:29 AM | 14 (7.1%) | 14 (12.8%) |
| 5:30 AM to 5:59 AM | 0 (0.0%) | 0 (0.0%) |
| 6:00 AM to 6:29 AM | 25 (12.8%) | 12 (11.0%) |
| 6:30 AM to 6:59 AM | 37 (18.9%) | 5 (4.6%) |
| 7:00 AM to 7:29 AM | 51 (26.0%) | 11 (10.1%) |
| 7:30 AM to 7:59 AM | 41 (20.9%) | 32 (29.4%) |
| 8:00 AM to 8:29 AM | 7 (3.6%) | 11 (10.1%) |
| 8:30 AM to 8:59 AM | 9 (4.6%) | 14 (12.8%) |
| 9:00 AM to 9:59 AM | 0 (0.0%) | 2 (1.8%) |
| 10:00 AM to 10:59 AM | 0 (0.0%) | 0 (0.0%) |
| 11:00 AM to 11:59 AM | 5 (2.5%) | 0 (0.0%) |
| 12:00 PM to 3:59 PM | 0 (0.0%) | 4 (3.7%) |
| 4:00 PM to 11:59 PM | 0 (0.0%) | 4 (3.7%) |
| Total | 196 (100.0%) | 109 (100.0%) |
Housing Occupancy in Henefer
Occupancy by Ownership in Henefer
Of the total 245 dwellings in Henefer, owner-occupied units account for 195 (79.6%), while renter-occupied units make up 50 (20.4%).
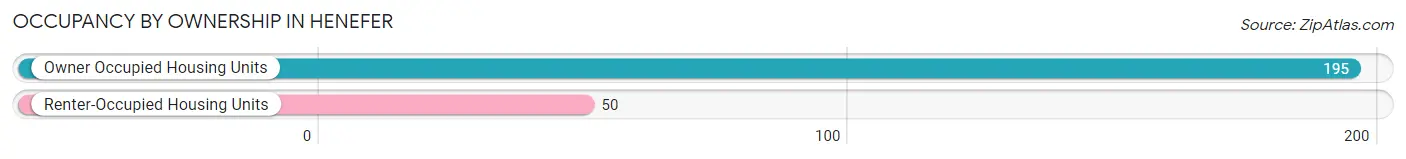
| Occupancy | # Housing Units | % Housing Units |
| Owner Occupied Housing Units | 195 | 79.6% |
| Renter-Occupied Housing Units | 50 | 20.4% |
| Total Occupied Housing Units | 245 | 100.0% |
Occupancy by Household Size in Henefer
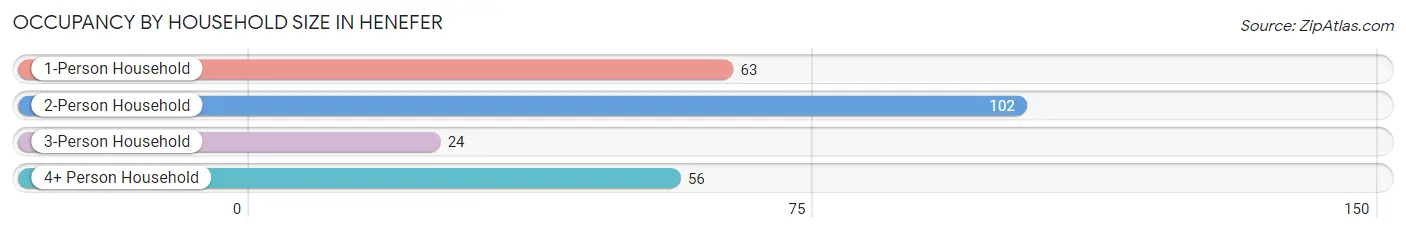
| Household Size | # Housing Units | % Housing Units |
| 1-Person Household | 63 | 25.7% |
| 2-Person Household | 102 | 41.6% |
| 3-Person Household | 24 | 9.8% |
| 4+ Person Household | 56 | 22.9% |
| Total Housing Units | 245 | 100.0% |
Occupancy by Ownership by Household Size in Henefer
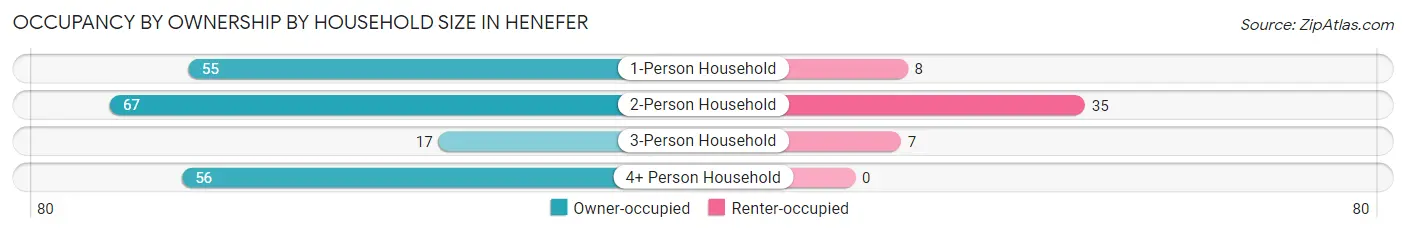
| Household Size | Owner-occupied | Renter-occupied |
| 1-Person Household | 55 (87.3%) | 8 (12.7%) |
| 2-Person Household | 67 (65.7%) | 35 (34.3%) |
| 3-Person Household | 17 (70.8%) | 7 (29.2%) |
| 4+ Person Household | 56 (100.0%) | 0 (0.0%) |
| Total Housing Units | 195 (79.6%) | 50 (20.4%) |
Occupancy by Educational Attainment in Henefer
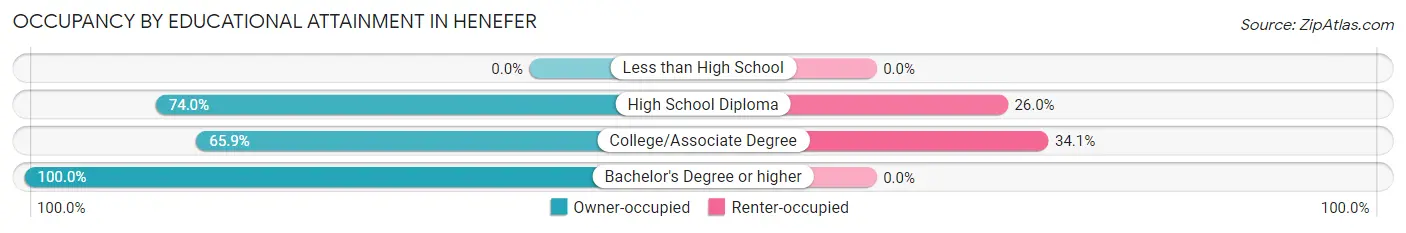
| Household Size | Owner-occupied | Renter-occupied |
| Less than High School | 0 (0.0%) | 0 (0.0%) |
| High School Diploma | 54 (74.0%) | 19 (26.0%) |
| College/Associate Degree | 60 (65.9%) | 31 (34.1%) |
| Bachelor's Degree or higher | 81 (100.0%) | 0 (0.0%) |
Occupancy by Age of Householder in Henefer
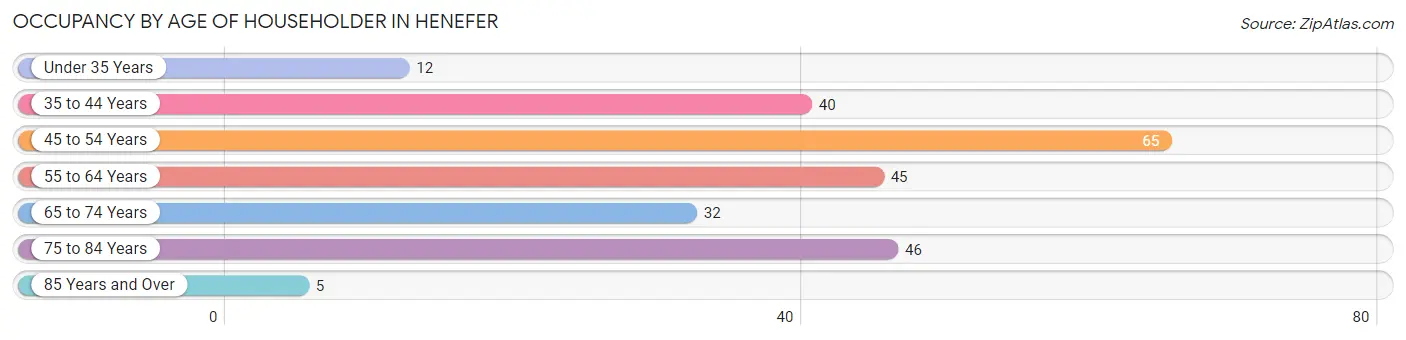
| Age Bracket | # Households | % Households |
| Under 35 Years | 12 | 4.9% |
| 35 to 44 Years | 40 | 16.3% |
| 45 to 54 Years | 65 | 26.5% |
| 55 to 64 Years | 45 | 18.4% |
| 65 to 74 Years | 32 | 13.1% |
| 75 to 84 Years | 46 | 18.8% |
| 85 Years and Over | 5 | 2.0% |
| Total | 245 | 100.0% |
Housing Finances in Henefer
Median Income by Occupancy in Henefer
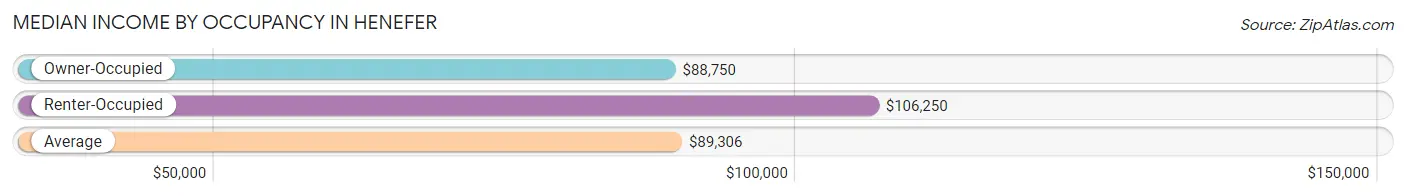
| Occupancy Type | # Households | Median Income |
| Owner-Occupied | 195 (79.6%) | $88,750 |
| Renter-Occupied | 50 (20.4%) | $106,250 |
| Average | 245 (100.0%) | $89,306 |
Occupancy by Householder Income Bracket in Henefer
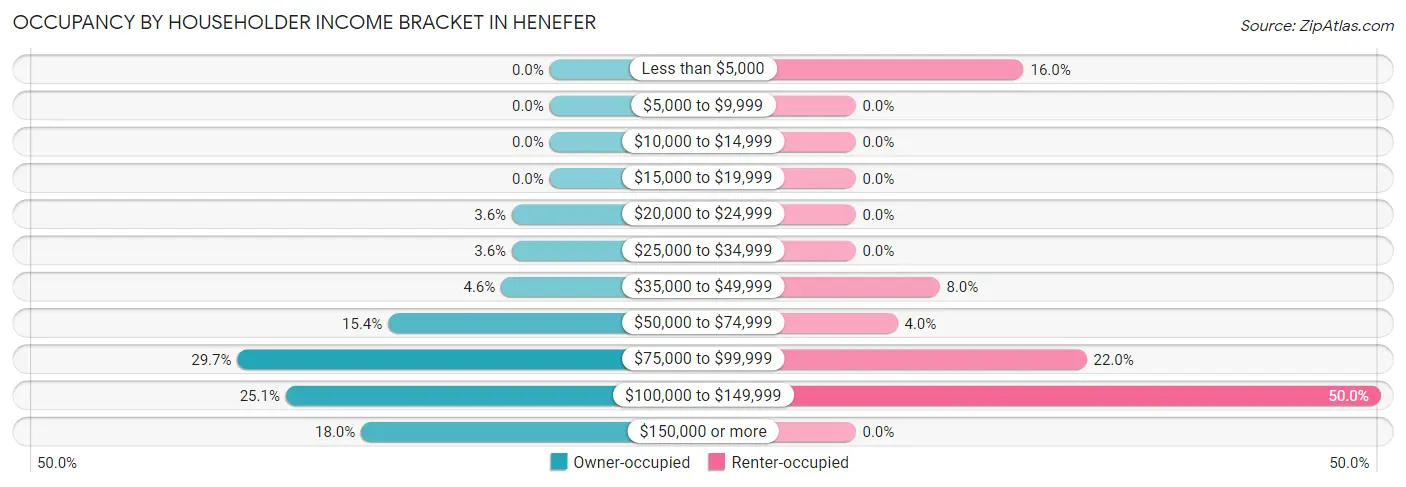
| Income Bracket | Owner-occupied | Renter-occupied |
| Less than $5,000 | 0 (0.0%) | 8 (16.0%) |
| $5,000 to $9,999 | 0 (0.0%) | 0 (0.0%) |
| $10,000 to $14,999 | 0 (0.0%) | 0 (0.0%) |
| $15,000 to $19,999 | 0 (0.0%) | 0 (0.0%) |
| $20,000 to $24,999 | 7 (3.6%) | 0 (0.0%) |
| $25,000 to $34,999 | 7 (3.6%) | 0 (0.0%) |
| $35,000 to $49,999 | 9 (4.6%) | 4 (8.0%) |
| $50,000 to $74,999 | 30 (15.4%) | 2 (4.0%) |
| $75,000 to $99,999 | 58 (29.7%) | 11 (22.0%) |
| $100,000 to $149,999 | 49 (25.1%) | 25 (50.0%) |
| $150,000 or more | 35 (17.9%) | 0 (0.0%) |
| Total | 195 (100.0%) | 50 (100.0%) |
Monthly Housing Cost Tiers in Henefer
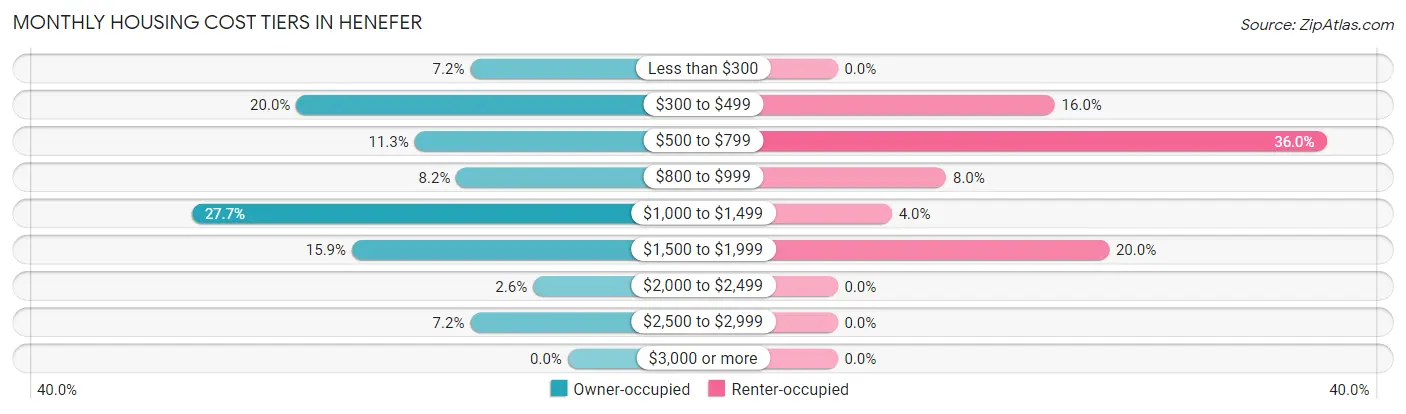
| Monthly Cost | Owner-occupied | Renter-occupied |
| Less than $300 | 14 (7.2%) | 0 (0.0%) |
| $300 to $499 | 39 (20.0%) | 8 (16.0%) |
| $500 to $799 | 22 (11.3%) | 18 (36.0%) |
| $800 to $999 | 16 (8.2%) | 4 (8.0%) |
| $1,000 to $1,499 | 54 (27.7%) | 2 (4.0%) |
| $1,500 to $1,999 | 31 (15.9%) | 10 (20.0%) |
| $2,000 to $2,499 | 5 (2.6%) | 0 (0.0%) |
| $2,500 to $2,999 | 14 (7.2%) | 0 (0.0%) |
| $3,000 or more | 0 (0.0%) | 0 (0.0%) |
| Total | 195 (100.0%) | 50 (100.0%) |
Physical Housing Characteristics in Henefer
Housing Structures in Henefer
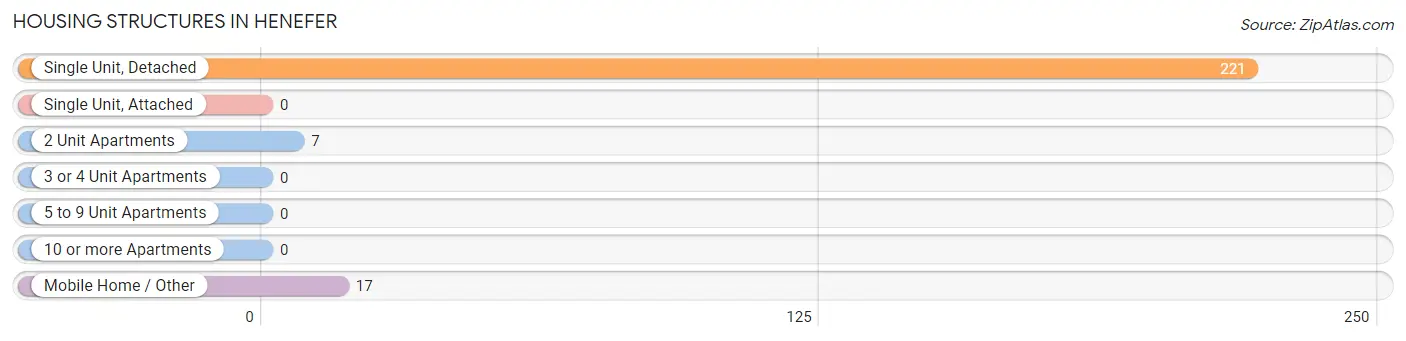
| Structure Type | # Housing Units | % Housing Units |
| Single Unit, Detached | 221 | 90.2% |
| Single Unit, Attached | 0 | 0.0% |
| 2 Unit Apartments | 7 | 2.9% |
| 3 or 4 Unit Apartments | 0 | 0.0% |
| 5 to 9 Unit Apartments | 0 | 0.0% |
| 10 or more Apartments | 0 | 0.0% |
| Mobile Home / Other | 17 | 6.9% |
| Total | 245 | 100.0% |
Housing Structures by Occupancy in Henefer
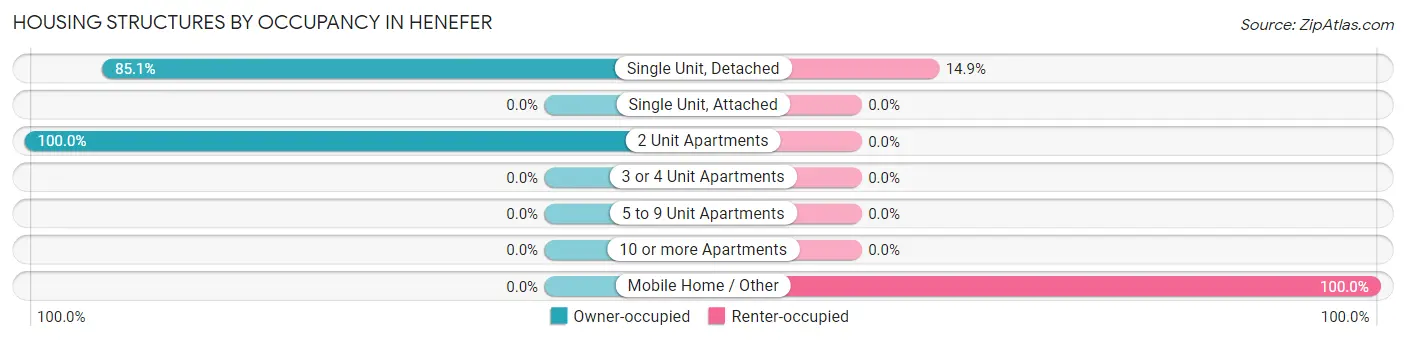
| Structure Type | Owner-occupied | Renter-occupied |
| Single Unit, Detached | 188 (85.1%) | 33 (14.9%) |
| Single Unit, Attached | 0 (0.0%) | 0 (0.0%) |
| 2 Unit Apartments | 7 (100.0%) | 0 (0.0%) |
| 3 or 4 Unit Apartments | 0 (0.0%) | 0 (0.0%) |
| 5 to 9 Unit Apartments | 0 (0.0%) | 0 (0.0%) |
| 10 or more Apartments | 0 (0.0%) | 0 (0.0%) |
| Mobile Home / Other | 0 (0.0%) | 17 (100.0%) |
| Total | 195 (79.6%) | 50 (20.4%) |
Housing Structures by Number of Rooms in Henefer
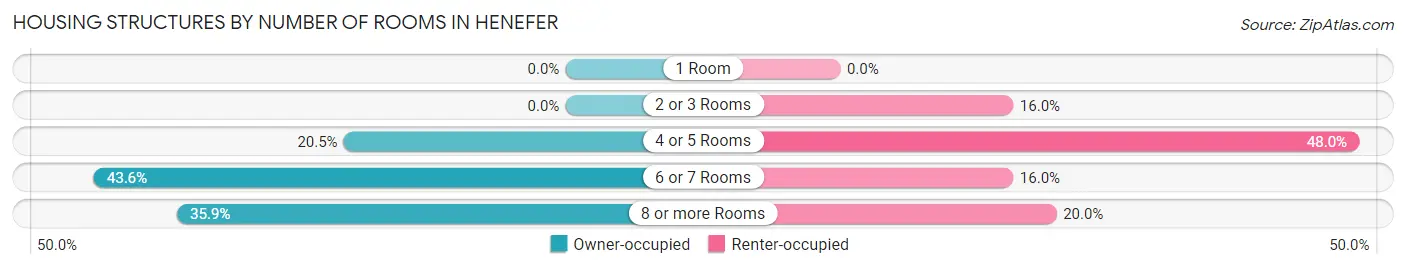
| Number of Rooms | Owner-occupied | Renter-occupied |
| 1 Room | 0 (0.0%) | 0 (0.0%) |
| 2 or 3 Rooms | 0 (0.0%) | 8 (16.0%) |
| 4 or 5 Rooms | 40 (20.5%) | 24 (48.0%) |
| 6 or 7 Rooms | 85 (43.6%) | 8 (16.0%) |
| 8 or more Rooms | 70 (35.9%) | 10 (20.0%) |
| Total | 195 (100.0%) | 50 (100.0%) |
Housing Structure by Heating Type in Henefer
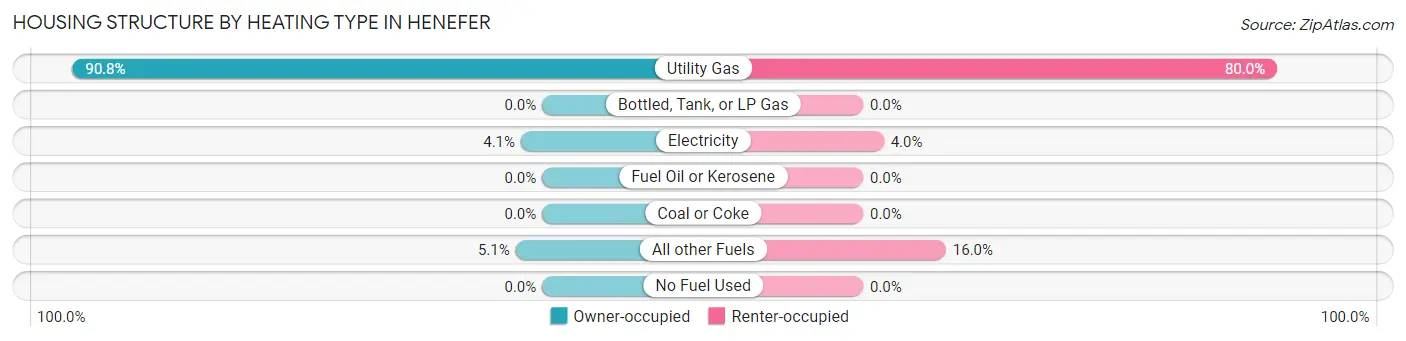
| Heating Type | Owner-occupied | Renter-occupied |
| Utility Gas | 177 (90.8%) | 40 (80.0%) |
| Bottled, Tank, or LP Gas | 0 (0.0%) | 0 (0.0%) |
| Electricity | 8 (4.1%) | 2 (4.0%) |
| Fuel Oil or Kerosene | 0 (0.0%) | 0 (0.0%) |
| Coal or Coke | 0 (0.0%) | 0 (0.0%) |
| All other Fuels | 10 (5.1%) | 8 (16.0%) |
| No Fuel Used | 0 (0.0%) | 0 (0.0%) |
| Total | 195 (100.0%) | 50 (100.0%) |
Household Vehicle Usage in Henefer
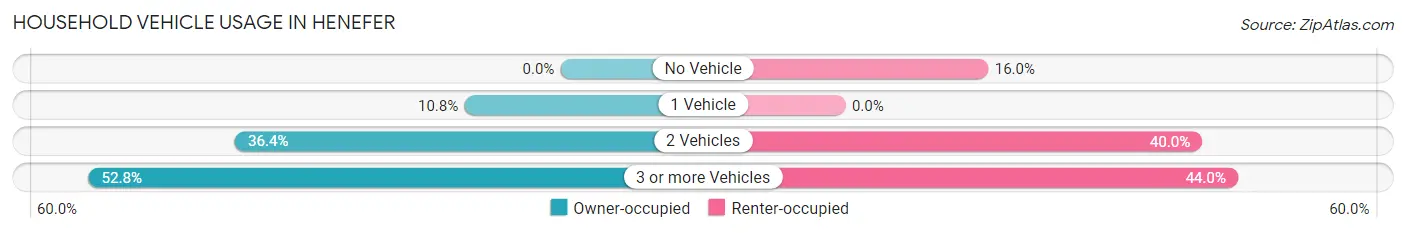
| Vehicles per Household | Owner-occupied | Renter-occupied |
| No Vehicle | 0 (0.0%) | 8 (16.0%) |
| 1 Vehicle | 21 (10.8%) | 0 (0.0%) |
| 2 Vehicles | 71 (36.4%) | 20 (40.0%) |
| 3 or more Vehicles | 103 (52.8%) | 22 (44.0%) |
| Total | 195 (100.0%) | 50 (100.0%) |
Real Estate & Mortgages in Henefer
Real Estate and Mortgage Overview in Henefer
| Characteristic | Without Mortgage | With Mortgage |
| Housing Units | 78 | 117 |
| Median Property Value | $427,300 | $346,300 |
| Median Household Income | $128,750 | $12 |
| Monthly Housing Costs | $433 | $0 |
| Real Estate Taxes | $1,318 | $0 |
Property Value by Mortgage Status in Henefer
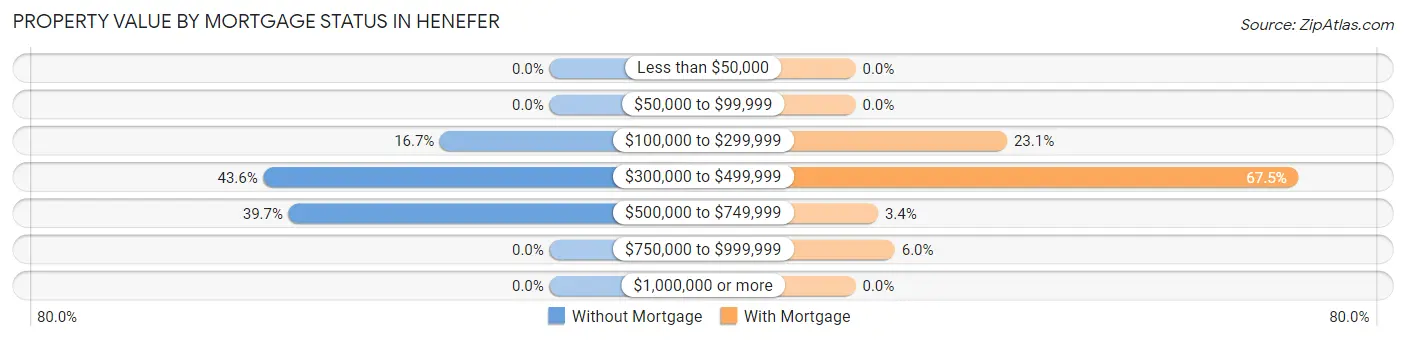
| Property Value | Without Mortgage | With Mortgage |
| Less than $50,000 | 0 (0.0%) | 0 (0.0%) |
| $50,000 to $99,999 | 0 (0.0%) | 0 (0.0%) |
| $100,000 to $299,999 | 13 (16.7%) | 27 (23.1%) |
| $300,000 to $499,999 | 34 (43.6%) | 79 (67.5%) |
| $500,000 to $749,999 | 31 (39.7%) | 4 (3.4%) |
| $750,000 to $999,999 | 0 (0.0%) | 7 (6.0%) |
| $1,000,000 or more | 0 (0.0%) | 0 (0.0%) |
| Total | 78 (100.0%) | 117 (100.0%) |
Household Income by Mortgage Status in Henefer
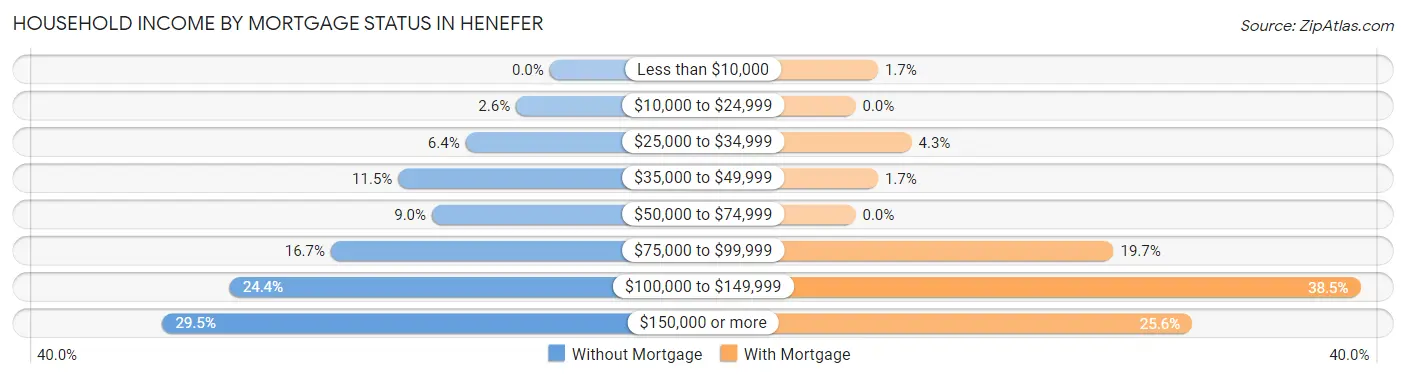
| Household Income | Without Mortgage | With Mortgage |
| Less than $10,000 | 0 (0.0%) | 2 (1.7%) |
| $10,000 to $24,999 | 2 (2.6%) | 0 (0.0%) |
| $25,000 to $34,999 | 5 (6.4%) | 5 (4.3%) |
| $35,000 to $49,999 | 9 (11.5%) | 2 (1.7%) |
| $50,000 to $74,999 | 7 (9.0%) | 0 (0.0%) |
| $75,000 to $99,999 | 13 (16.7%) | 23 (19.7%) |
| $100,000 to $149,999 | 19 (24.4%) | 45 (38.5%) |
| $150,000 or more | 23 (29.5%) | 30 (25.6%) |
| Total | 78 (100.0%) | 117 (100.0%) |
Property Value to Household Income Ratio in Henefer
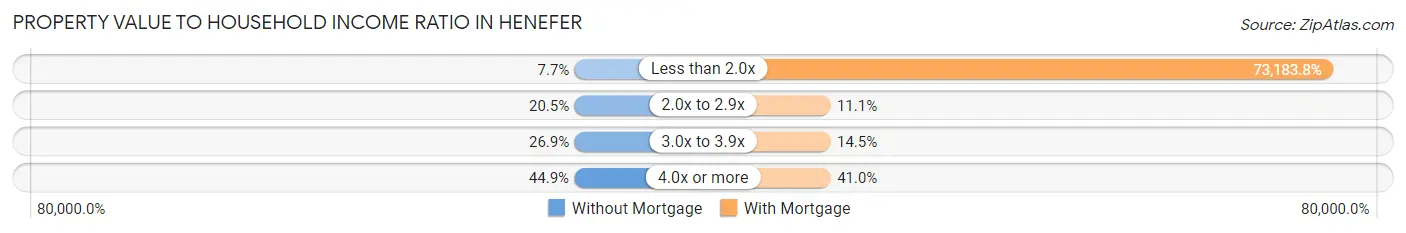
| Value-to-Income Ratio | Without Mortgage | With Mortgage |
| Less than 2.0x | 6 (7.7%) | 85,625 (73,183.8%) |
| 2.0x to 2.9x | 16 (20.5%) | 13 (11.1%) |
| 3.0x to 3.9x | 21 (26.9%) | 17 (14.5%) |
| 4.0x or more | 35 (44.9%) | 48 (41.0%) |
| Total | 78 (100.0%) | 117 (100.0%) |
Real Estate Taxes by Mortgage Status in Henefer
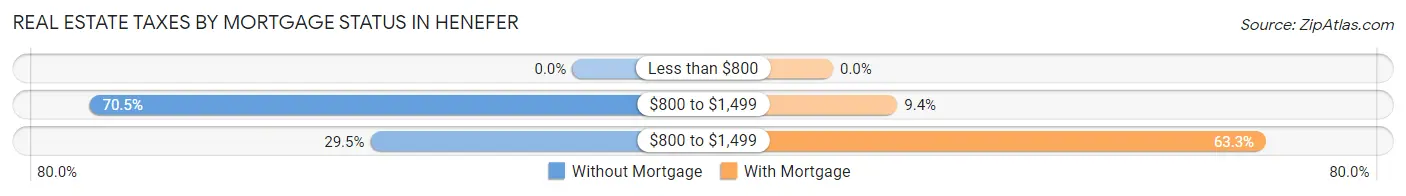
| Property Taxes | Without Mortgage | With Mortgage |
| Less than $800 | 0 (0.0%) | 0 (0.0%) |
| $800 to $1,499 | 55 (70.5%) | 11 (9.4%) |
| $800 to $1,499 | 23 (29.5%) | 74 (63.2%) |
| Total | 78 (100.0%) | 117 (100.0%) |
Health & Disability in Henefer
Health Insurance Coverage by Age in Henefer
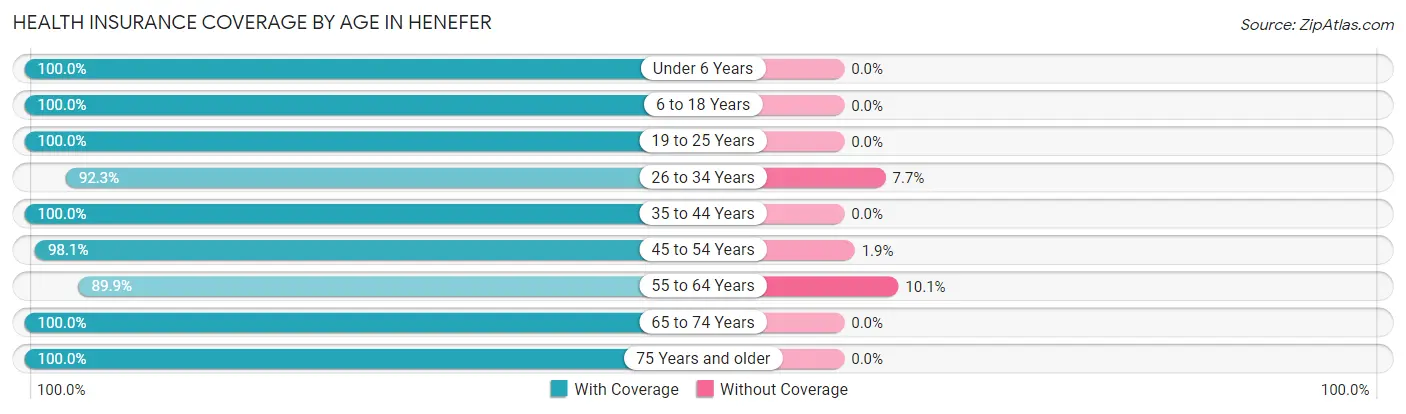
| Age Bracket | With Coverage | Without Coverage |
| Under 6 Years | 67 (100.0%) | 0 (0.0%) |
| 6 to 18 Years | 142 (100.0%) | 0 (0.0%) |
| 19 to 25 Years | 71 (100.0%) | 0 (0.0%) |
| 26 to 34 Years | 12 (92.3%) | 1 (7.7%) |
| 35 to 44 Years | 103 (100.0%) | 0 (0.0%) |
| 45 to 54 Years | 101 (98.1%) | 2 (1.9%) |
| 55 to 64 Years | 98 (89.9%) | 11 (10.1%) |
| 65 to 74 Years | 43 (100.0%) | 0 (0.0%) |
| 75 Years and older | 57 (100.0%) | 0 (0.0%) |
| Total | 694 (98.0%) | 14 (2.0%) |
Health Insurance Coverage by Citizenship Status in Henefer
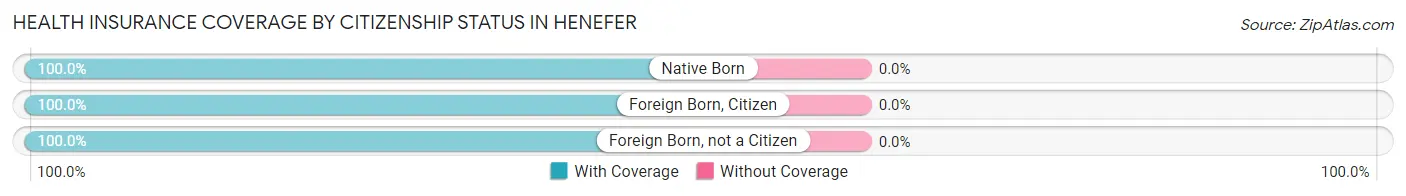
| Citizenship Status | With Coverage | Without Coverage |
| Native Born | 67 (100.0%) | 0 (0.0%) |
| Foreign Born, Citizen | 142 (100.0%) | 0 (0.0%) |
| Foreign Born, not a Citizen | 71 (100.0%) | 0 (0.0%) |
Health Insurance Coverage by Household Income in Henefer
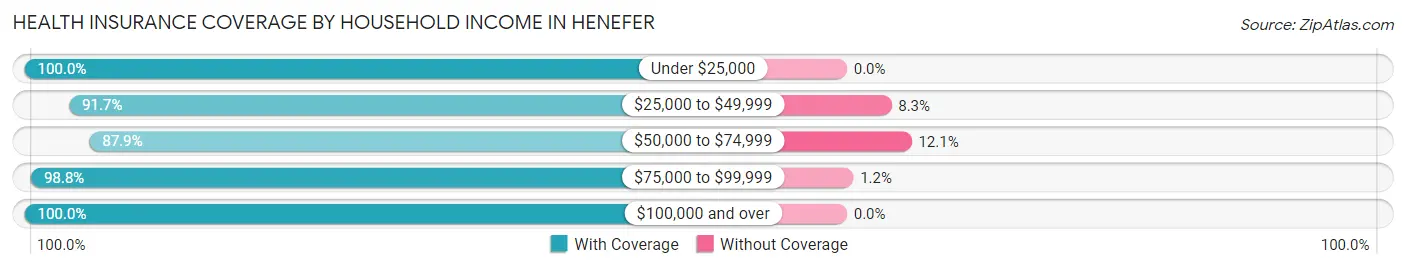
| Household Income | With Coverage | Without Coverage |
| Under $25,000 | 15 (100.0%) | 0 (0.0%) |
| $25,000 to $49,999 | 33 (91.7%) | 3 (8.3%) |
| $50,000 to $74,999 | 58 (87.9%) | 8 (12.1%) |
| $75,000 to $99,999 | 248 (98.8%) | 3 (1.2%) |
| $100,000 and over | 340 (100.0%) | 0 (0.0%) |
Public vs Private Health Insurance Coverage by Age in Henefer
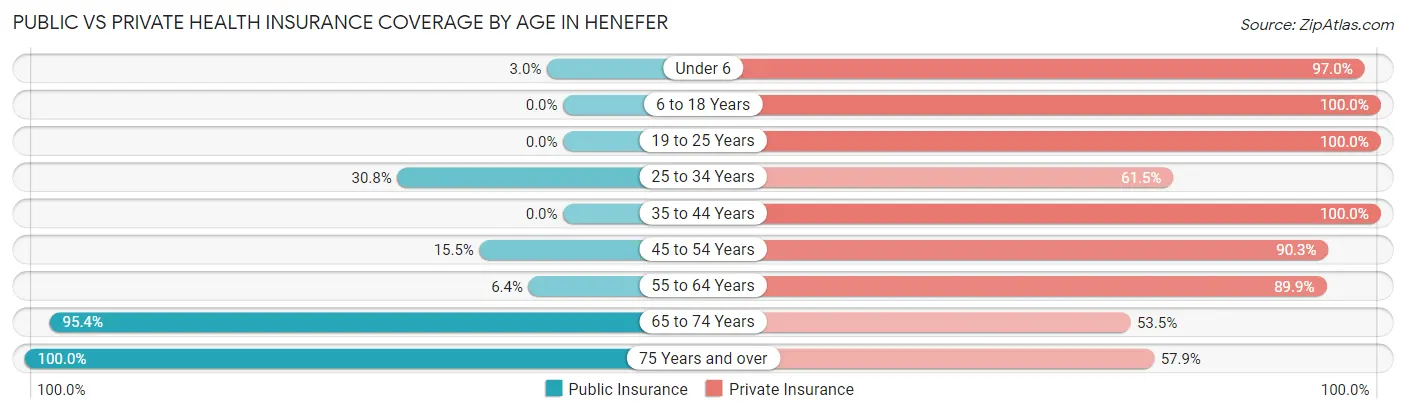
| Age Bracket | Public Insurance | Private Insurance |
| Under 6 | 2 (3.0%) | 65 (97.0%) |
| 6 to 18 Years | 0 (0.0%) | 142 (100.0%) |
| 19 to 25 Years | 0 (0.0%) | 71 (100.0%) |
| 25 to 34 Years | 4 (30.8%) | 8 (61.5%) |
| 35 to 44 Years | 0 (0.0%) | 103 (100.0%) |
| 45 to 54 Years | 16 (15.5%) | 93 (90.3%) |
| 55 to 64 Years | 7 (6.4%) | 98 (89.9%) |
| 65 to 74 Years | 41 (95.4%) | 23 (53.5%) |
| 75 Years and over | 57 (100.0%) | 33 (57.9%) |
| Total | 127 (17.9%) | 636 (89.8%) |
Disability Status by Sex by Age in Henefer
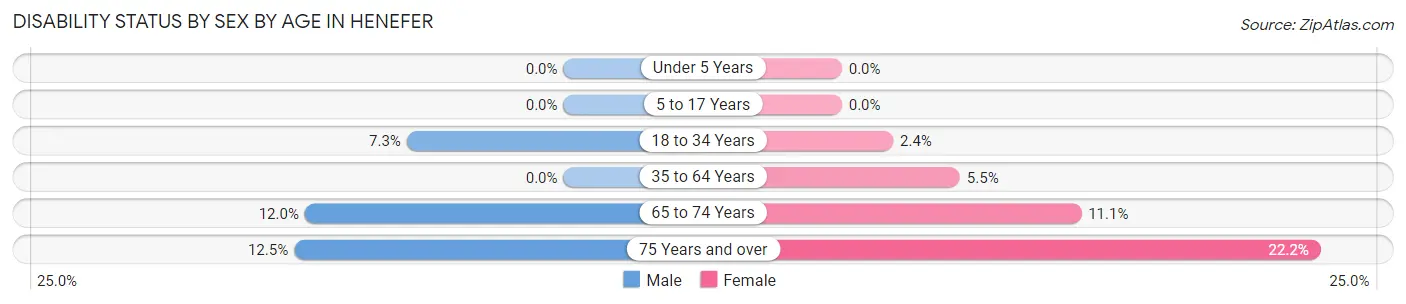
| Age Bracket | Male | Female |
| Under 5 Years | 0 (0.0%) | 0 (0.0%) |
| 5 to 17 Years | 0 (0.0%) | 0 (0.0%) |
| 18 to 34 Years | 4 (7.3%) | 1 (2.4%) |
| 35 to 64 Years | 0 (0.0%) | 8 (5.5%) |
| 65 to 74 Years | 3 (12.0%) | 2 (11.1%) |
| 75 Years and over | 6 (12.5%) | 2 (22.2%) |
Disability Class by Sex by Age in Henefer
Disability Class: Hearing Difficulty
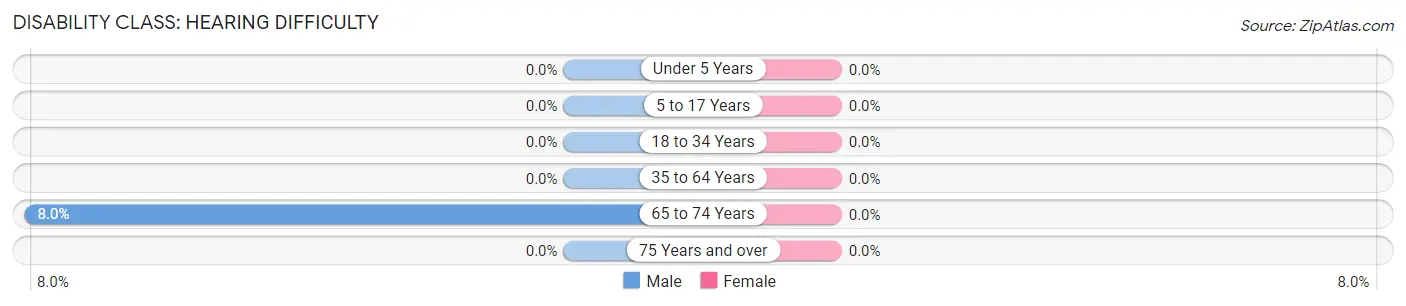
| Age Bracket | Male | Female |
| Under 5 Years | 0 (0.0%) | 0 (0.0%) |
| 5 to 17 Years | 0 (0.0%) | 0 (0.0%) |
| 18 to 34 Years | 0 (0.0%) | 0 (0.0%) |
| 35 to 64 Years | 0 (0.0%) | 0 (0.0%) |
| 65 to 74 Years | 2 (8.0%) | 0 (0.0%) |
| 75 Years and over | 0 (0.0%) | 0 (0.0%) |
Disability Class: Vision Difficulty
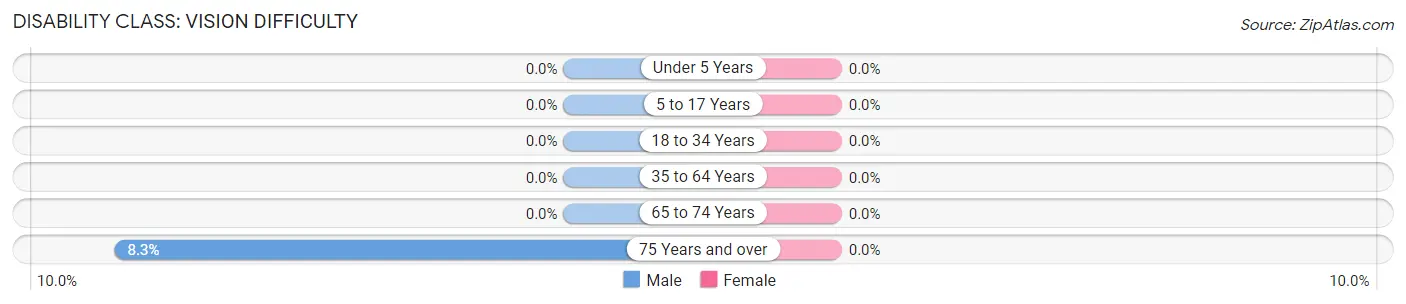
| Age Bracket | Male | Female |
| Under 5 Years | 0 (0.0%) | 0 (0.0%) |
| 5 to 17 Years | 0 (0.0%) | 0 (0.0%) |
| 18 to 34 Years | 0 (0.0%) | 0 (0.0%) |
| 35 to 64 Years | 0 (0.0%) | 0 (0.0%) |
| 65 to 74 Years | 0 (0.0%) | 0 (0.0%) |
| 75 Years and over | 4 (8.3%) | 0 (0.0%) |
Disability Class: Cognitive Difficulty
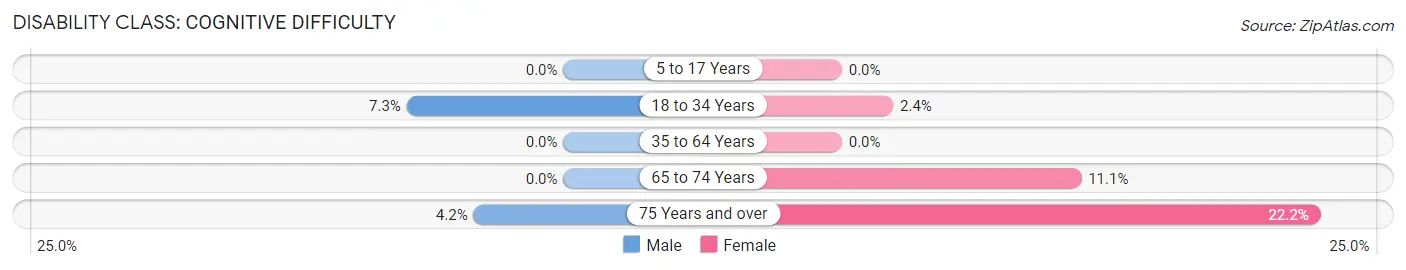
| Age Bracket | Male | Female |
| 5 to 17 Years | 0 (0.0%) | 0 (0.0%) |
| 18 to 34 Years | 4 (7.3%) | 1 (2.4%) |
| 35 to 64 Years | 0 (0.0%) | 0 (0.0%) |
| 65 to 74 Years | 0 (0.0%) | 2 (11.1%) |
| 75 Years and over | 2 (4.2%) | 2 (22.2%) |
Disability Class: Ambulatory Difficulty
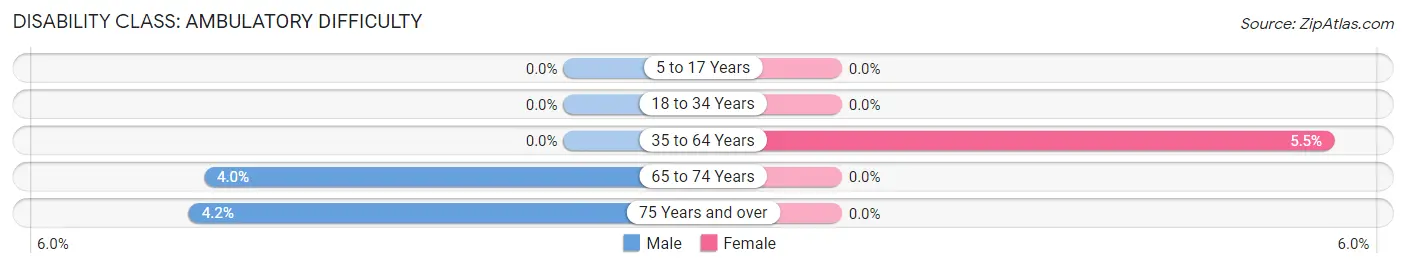
| Age Bracket | Male | Female |
| 5 to 17 Years | 0 (0.0%) | 0 (0.0%) |
| 18 to 34 Years | 0 (0.0%) | 0 (0.0%) |
| 35 to 64 Years | 0 (0.0%) | 8 (5.5%) |
| 65 to 74 Years | 1 (4.0%) | 0 (0.0%) |
| 75 Years and over | 2 (4.2%) | 0 (0.0%) |
Disability Class: Self-Care Difficulty
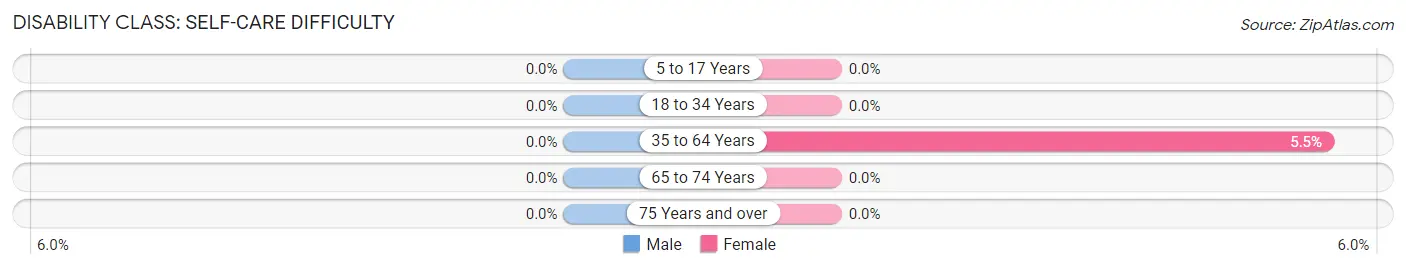
| Age Bracket | Male | Female |
| 5 to 17 Years | 0 (0.0%) | 0 (0.0%) |
| 18 to 34 Years | 0 (0.0%) | 0 (0.0%) |
| 35 to 64 Years | 0 (0.0%) | 8 (5.5%) |
| 65 to 74 Years | 0 (0.0%) | 0 (0.0%) |
| 75 Years and over | 0 (0.0%) | 0 (0.0%) |
Technology Access in Henefer
Computing Device Access in Henefer
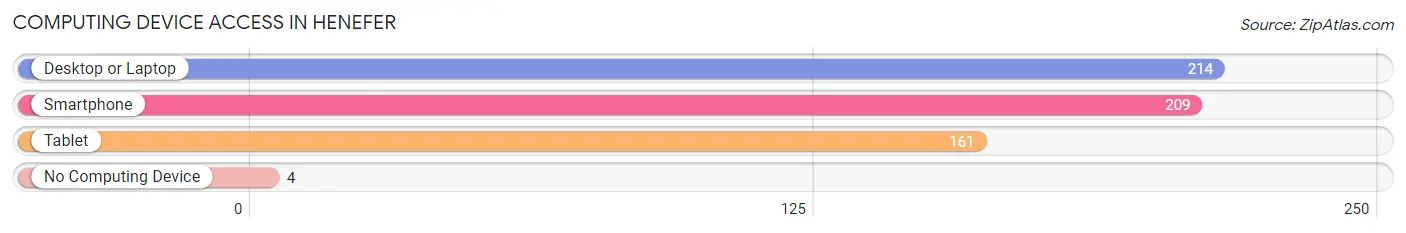
| Device Type | # Households | % Households |
| Desktop or Laptop | 214 | 87.4% |
| Smartphone | 209 | 85.3% |
| Tablet | 161 | 65.7% |
| No Computing Device | 4 | 1.6% |
| Total | 245 | 100.0% |
Internet Access in Henefer
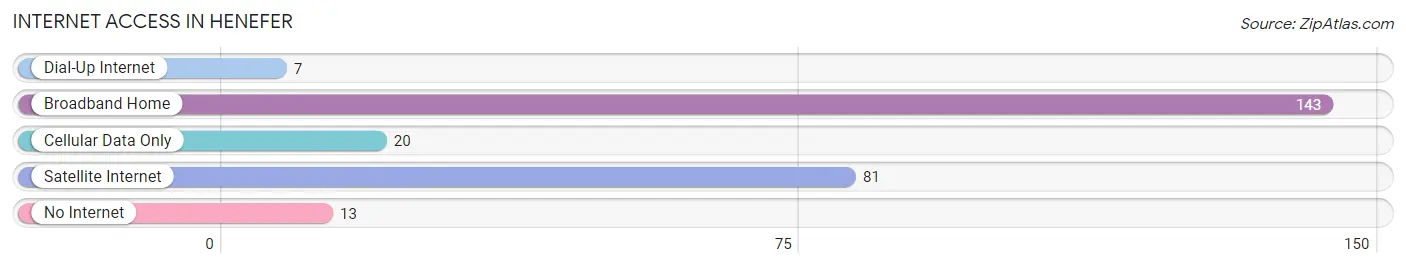
| Internet Type | # Households | % Households |
| Dial-Up Internet | 7 | 2.9% |
| Broadband Home | 143 | 58.4% |
| Cellular Data Only | 20 | 8.2% |
| Satellite Internet | 81 | 33.1% |
| No Internet | 13 | 5.3% |
| Total | 245 | 100.0% |
Henefer Summary
Heber-Henefer is a small town located in the northeastern corner of Summit County, Utah. It is situated in the Wasatch Mountains, approximately 40 miles east of Salt Lake City. The town is home to a population of approximately 500 people, and is known for its rural atmosphere and small-town charm.
Geography
Heber-Henefer is located in the Wasatch Mountains, at an elevation of 5,890 feet. The town is situated in a valley, surrounded by mountains on all sides. The nearest mountain peaks are Henefer Peak to the north, and Heber Peak to the south. The town is located on the banks of the Weber River, which flows through the valley. The area is known for its scenic beauty, and is popular with hikers, campers, and other outdoor enthusiasts.
The climate in Heber-Henefer is generally mild, with cold winters and warm summers. The average annual temperature is approximately 40 degrees Fahrenheit. The area receives an average of 20 inches of precipitation per year, with most of it falling in the form of snow.
Economy
The economy of Heber-Henefer is largely based on agriculture and tourism. The town is home to several small farms, which produce a variety of crops, including hay, corn, and wheat. The area is also popular with tourists, who come to enjoy the scenic beauty of the Wasatch Mountains.
The town is home to several small businesses, including a grocery store, a hardware store, and a restaurant. There is also a post office, a library, and a fire station.
Demographics
As of the 2010 census, the population of Heber-Henefer was 498. The racial makeup of the town was 97.2% White, 0.2% African American, 0.4% Native American, 0.2% Asian, 0.2% Pacific Islander, 0.8% from other races, and 0.8% from two or more races. Hispanic or Latino of any race were 2.2% of the population.
The median household income in Heber-Henefer was $45,000, and the median family income was $50,000. The per capita income was $20,000. About 8.5% of families and 10.2% of the population were below the poverty line, including 11.2% of those under age 18 and 8.3% of those age 65 or over.
Education
Heber-Henefer is served by the North Summit School District. The town is home to North Summit Elementary School, which serves students in grades K-6. Students in grades 7-12 attend North Summit High School, located in nearby Coalville.
Conclusion
Heber-Henefer is a small town located in the Wasatch Mountains of Summit County, Utah. It is known for its rural atmosphere and small-town charm, and is popular with tourists and outdoor enthusiasts. The economy of the town is largely based on agriculture and tourism, and the population is predominantly White. The town is served by the North Summit School District, and is home to North Summit Elementary School.
Common Questions
What is Per Capita Income in Henefer?
Per Capita income in Henefer is $37,570.
What is the Median Family Income in Henefer?
Median Family Income in Henefer is $124,306.
What is the Median Household income in Henefer?
Median Household Income in Henefer is $89,306.
What is Income or Wage Gap in Henefer?
Income or Wage Gap in Henefer is 43.2%.
Women in Henefer earn 56.8 cents for every dollar earned by a man.
What is Inequality or Gini Index in Henefer?
Inequality or Gini Index in Henefer is 0.28.
What is the Total Population of Henefer?
Total Population of Henefer is 708.
What is the Total Male Population of Henefer?
Total Male Population of Henefer is 397.
What is the Total Female Population of Henefer?
Total Female Population of Henefer is 311.
What is the Ratio of Males per 100 Females in Henefer?
There are 127.65 Males per 100 Females in Henefer.
What is the Ratio of Females per 100 Males in Henefer?
There are 78.34 Females per 100 Males in Henefer.
What is the Median Population Age in Henefer?
Median Population Age in Henefer is 43.0 Years.
What is the Average Family Size in Henefer
Average Family Size in Henefer is 3.8 People.
What is the Average Household Size in Henefer
Average Household Size in Henefer is 2.9 People.
How Large is the Labor Force in Henefer?
There are 380 People in the Labor Forcein in Henefer.
What is the Percentage of People in the Labor Force in Henefer?
70.0% of People are in the Labor Force in Henefer.
What is the Unemployment Rate in Henefer?
Unemployment Rate in Henefer is 0.5%.