Goshen, UT Map & Demographics
Goshen Map
Goshen Overview
$29,626
PER CAPITA INCOME
$89,750
AVG FAMILY INCOME
$92,232
AVG HOUSEHOLD INCOME
32.9%
WAGE / INCOME GAP [ % ]
67.1¢/ $1
WAGE / INCOME GAP [ $ ]
0.31
INEQUALITY / GINI INDEX
865
TOTAL POPULATION
416
MALE POPULATION
449
FEMALE POPULATION
92.65
MALES / 100 FEMALES
107.93
FEMALES / 100 MALES
30.3
MEDIAN AGE
3.3
AVG FAMILY SIZE
3.0
AVG HOUSEHOLD SIZE
459
LABOR FORCE [ PEOPLE ]
76.4%
PERCENT IN LABOR FORCE
1.3%
UNEMPLOYMENT RATE
Goshen Zip Codes
Goshen Area Codes
Income in Goshen
Income Overview in Goshen
Per Capita Income in Goshen is $29,626, while median incomes of families and households are $89,750 and $92,232 respectively.
| Characteristic | Number | Measure |
| Per Capita Income | 865 | $29,626 |
| Median Family Income | 227 | $89,750 |
| Mean Family Income | 227 | $90,254 |
| Median Household Income | 285 | $92,232 |
| Mean Household Income | 285 | $92,520 |
| Income Deficit | 227 | $0 |
| Wage / Income Gap (%) | 865 | 32.85% |
| Wage / Income Gap ($) | 865 | 67.15¢ per $1 |
| Gini / Inequality Index | 865 | 0.31 |
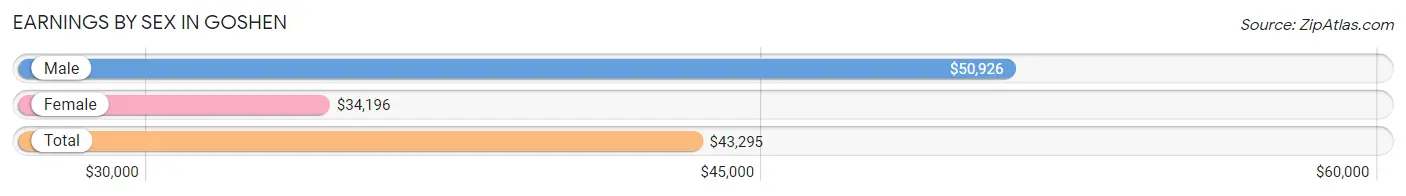
Earnings by Sex in Goshen
Average Earnings in Goshen are $43,295, $50,926 for men and $34,196 for women, a difference of 32.9%.
| Sex | Number | Average Earnings |
| Male | 252 (53.3%) | $50,926 |
| Female | 221 (46.7%) | $34,196 |
| Total | 473 (100.0%) | $43,295 |
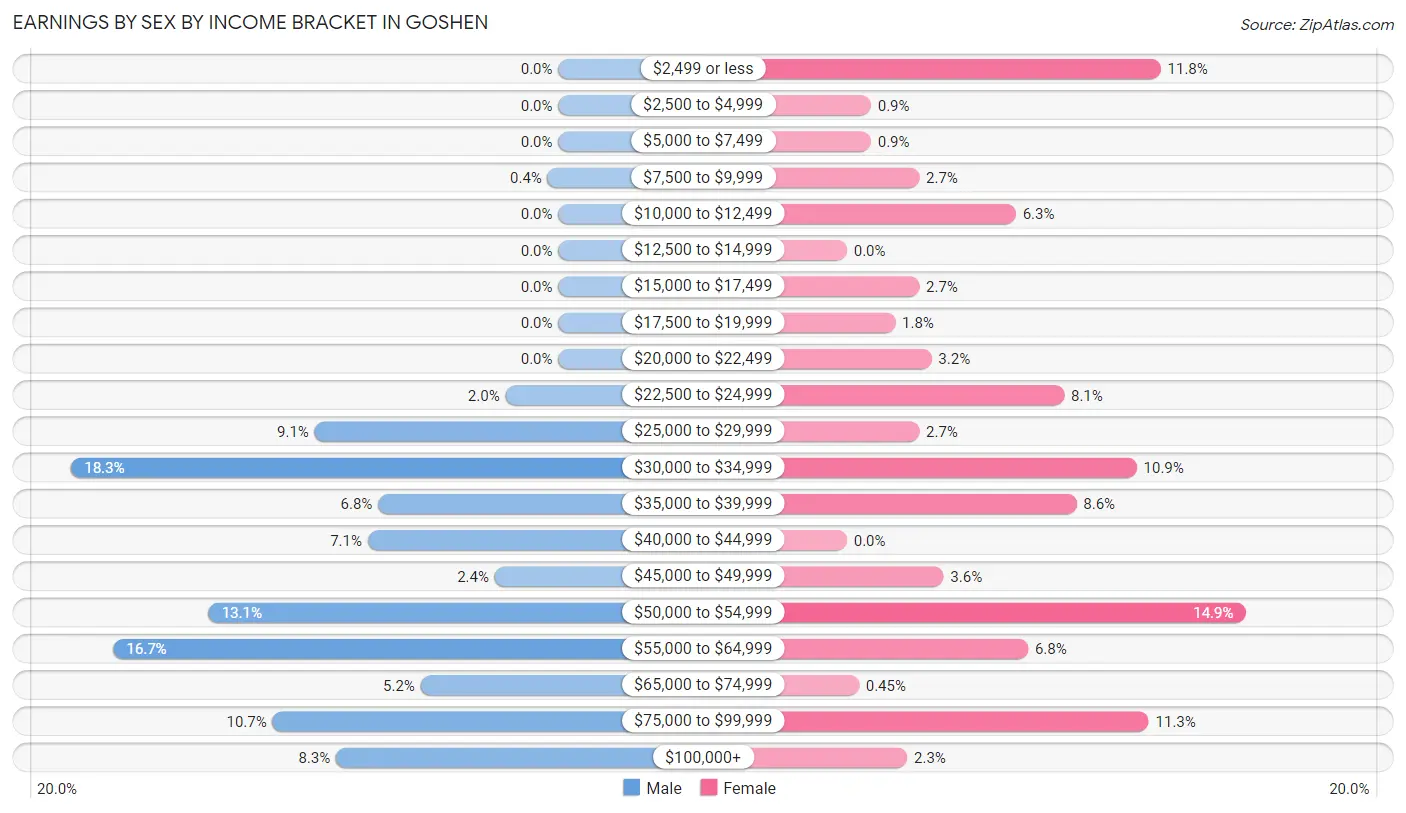
Earnings by Sex by Income Bracket in Goshen
The most common earnings brackets in Goshen are $30,000 to $34,999 for men (46 | 18.2%) and $50,000 to $54,999 for women (33 | 14.9%).
| Income | Male | Female |
| $2,499 or less | 0 (0.0%) | 26 (11.8%) |
| $2,500 to $4,999 | 0 (0.0%) | 2 (0.9%) |
| $5,000 to $7,499 | 0 (0.0%) | 2 (0.9%) |
| $7,500 to $9,999 | 1 (0.4%) | 6 (2.7%) |
| $10,000 to $12,499 | 0 (0.0%) | 14 (6.3%) |
| $12,500 to $14,999 | 0 (0.0%) | 0 (0.0%) |
| $15,000 to $17,499 | 0 (0.0%) | 6 (2.7%) |
| $17,500 to $19,999 | 0 (0.0%) | 4 (1.8%) |
| $20,000 to $22,499 | 0 (0.0%) | 7 (3.2%) |
| $22,500 to $24,999 | 5 (2.0%) | 18 (8.1%) |
| $25,000 to $29,999 | 23 (9.1%) | 6 (2.7%) |
| $30,000 to $34,999 | 46 (18.2%) | 24 (10.9%) |
| $35,000 to $39,999 | 17 (6.8%) | 19 (8.6%) |
| $40,000 to $44,999 | 18 (7.1%) | 0 (0.0%) |
| $45,000 to $49,999 | 6 (2.4%) | 8 (3.6%) |
| $50,000 to $54,999 | 33 (13.1%) | 33 (14.9%) |
| $55,000 to $64,999 | 42 (16.7%) | 15 (6.8%) |
| $65,000 to $74,999 | 13 (5.2%) | 1 (0.4%) |
| $75,000 to $99,999 | 27 (10.7%) | 25 (11.3%) |
| $100,000+ | 21 (8.3%) | 5 (2.3%) |
| Total | 252 (100.0%) | 221 (100.0%) |
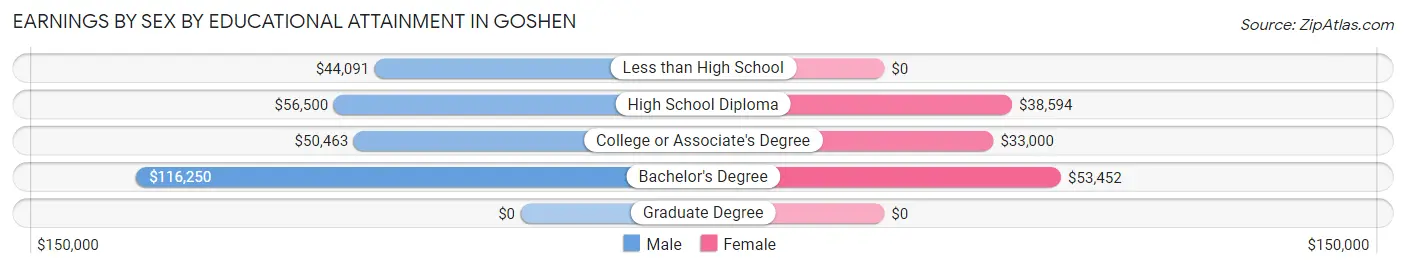
Earnings by Sex by Educational Attainment in Goshen
Average earnings in Goshen are $51,296 for men and $35,833 for women, a difference of 30.1%. Men with an educational attainment of bachelor's degree enjoy the highest average annual earnings of $116,250, while those with less than high school education earn the least with $44,091. Women with an educational attainment of bachelor's degree earn the most with the average annual earnings of $53,452, while those with college or associate's degree education have the smallest earnings of $33,000.
| Educational Attainment | Male Income | Female Income |
| Less than High School | $44,091 | $0 |
| High School Diploma | $56,500 | $38,594 |
| College or Associate's Degree | $50,463 | $33,000 |
| Bachelor's Degree | $116,250 | $53,452 |
| Graduate Degree | - | - |
| Total | $51,296 | $35,833 |
Family Income in Goshen
Family Income Brackets in Goshen
According to the Goshen family income data, there are 70 families falling into the $100,000 to $149,999 income range, which is the most common income bracket and makes up 30.8% of all families.
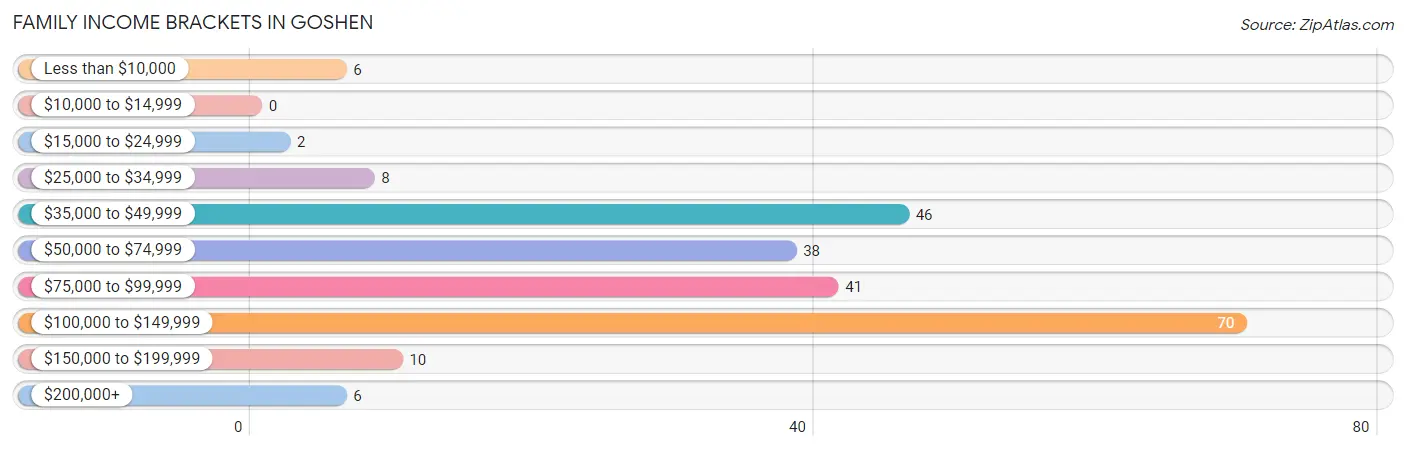
| Income Bracket | # Families | % Families |
| Less than $10,000 | 6 | 2.6% |
| $10,000 to $14,999 | 0 | 0.0% |
| $15,000 to $24,999 | 2 | 0.9% |
| $25,000 to $34,999 | 8 | 3.5% |
| $35,000 to $49,999 | 46 | 20.3% |
| $50,000 to $74,999 | 38 | 16.7% |
| $75,000 to $99,999 | 41 | 18.1% |
| $100,000 to $149,999 | 70 | 30.8% |
| $150,000 to $199,999 | 10 | 4.4% |
| $200,000+ | 6 | 2.6% |
Family Income by Famaliy Size in Goshen
3-person families (39 | 17.2%) account for the highest median family income in Goshen with $132,961 per family, while 2-person families (87 | 38.3%) have the highest median income of $44,875 per family member.
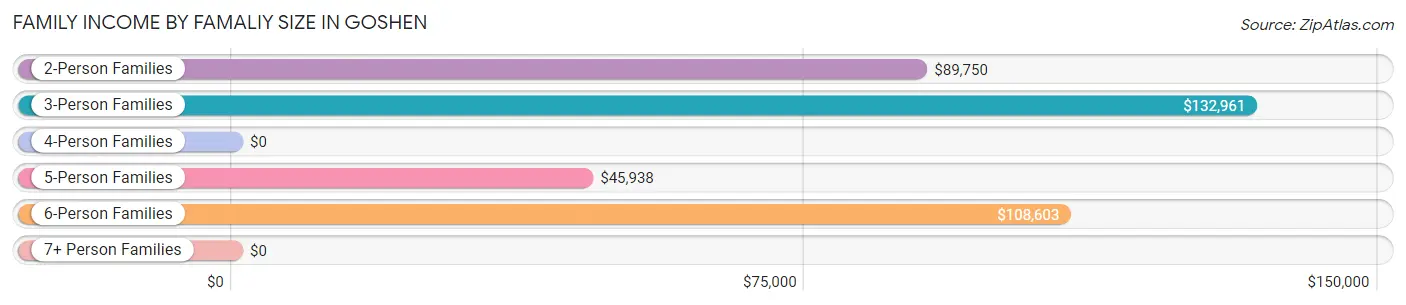
| Income Bracket | # Families | Median Income |
| 2-Person Families | 87 (38.3%) | $89,750 |
| 3-Person Families | 39 (17.2%) | $132,961 |
| 4-Person Families | 47 (20.7%) | $0 |
| 5-Person Families | 18 (7.9%) | $45,938 |
| 6-Person Families | 23 (10.1%) | $108,603 |
| 7+ Person Families | 13 (5.7%) | $0 |
| Total | 227 (100.0%) | $89,750 |
Family Income by Number of Earners in Goshen
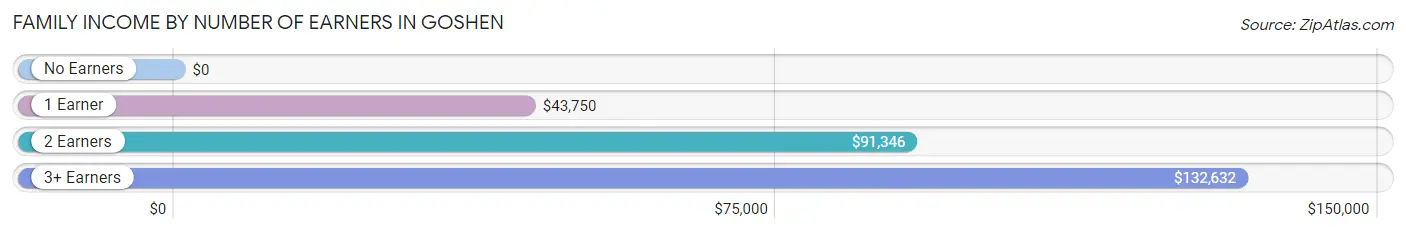
| Number of Earners | # Families | Median Income |
| No Earners | 17 (7.5%) | $0 |
| 1 Earner | 60 (26.4%) | $43,750 |
| 2 Earners | 102 (44.9%) | $91,346 |
| 3+ Earners | 48 (21.1%) | $132,632 |
| Total | 227 (100.0%) | $89,750 |
Household Income in Goshen
Household Income Brackets in Goshen
With 105 households falling in the category, the $100,000 to $149,999 income range is the most frequent in Goshen, accounting for 36.8% of all households. In contrast, only 2 households (0.7%) fall into the $10,000 to $14,999 income bracket, making it the least populous group.
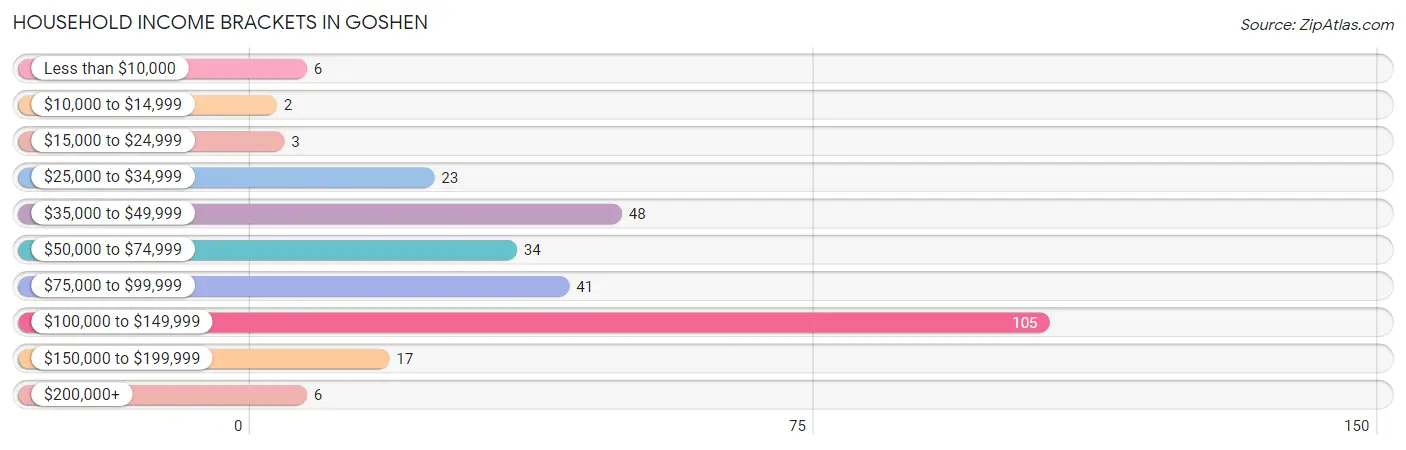
| Income Bracket | # Households | % Households |
| Less than $10,000 | 6 | 2.1% |
| $10,000 to $14,999 | 2 | 0.7% |
| $15,000 to $24,999 | 3 | 1.1% |
| $25,000 to $34,999 | 23 | 8.1% |
| $35,000 to $49,999 | 48 | 16.8% |
| $50,000 to $74,999 | 34 | 11.9% |
| $75,000 to $99,999 | 41 | 14.4% |
| $100,000 to $149,999 | 105 | 36.8% |
| $150,000 to $199,999 | 17 | 6.0% |
| $200,000+ | 6 | 2.1% |
Household Income by Householder Age in Goshen
The median household income in Goshen is $92,232, with the highest median household income of $94,375 found in the 45 to 64 years age bracket for the primary householder. A total of 134 households (47.0%) fall into this category. Meanwhile, the 15 to 24 years age bracket for the primary householder has the lowest median household income of $0, with 25 households (8.8%) in this group.
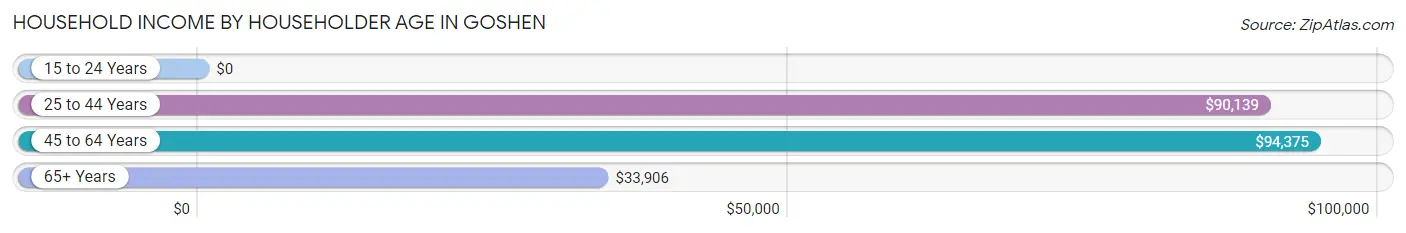
| Income Bracket | # Households | Median Income |
| 15 to 24 Years | 25 (8.8%) | $0 |
| 25 to 44 Years | 97 (34.0%) | $90,139 |
| 45 to 64 Years | 134 (47.0%) | $94,375 |
| 65+ Years | 29 (10.2%) | $33,906 |
| Total | 285 (100.0%) | $92,232 |
Poverty in Goshen
Income Below Poverty by Sex and Age in Goshen
With 18.8% poverty level for males and 19.6% for females among the residents of Goshen, 15 year old males and under 5 year old females are the most vulnerable to poverty, with 6 males (60.0%) and 21 females (55.3%) in their respective age groups living below the poverty level.
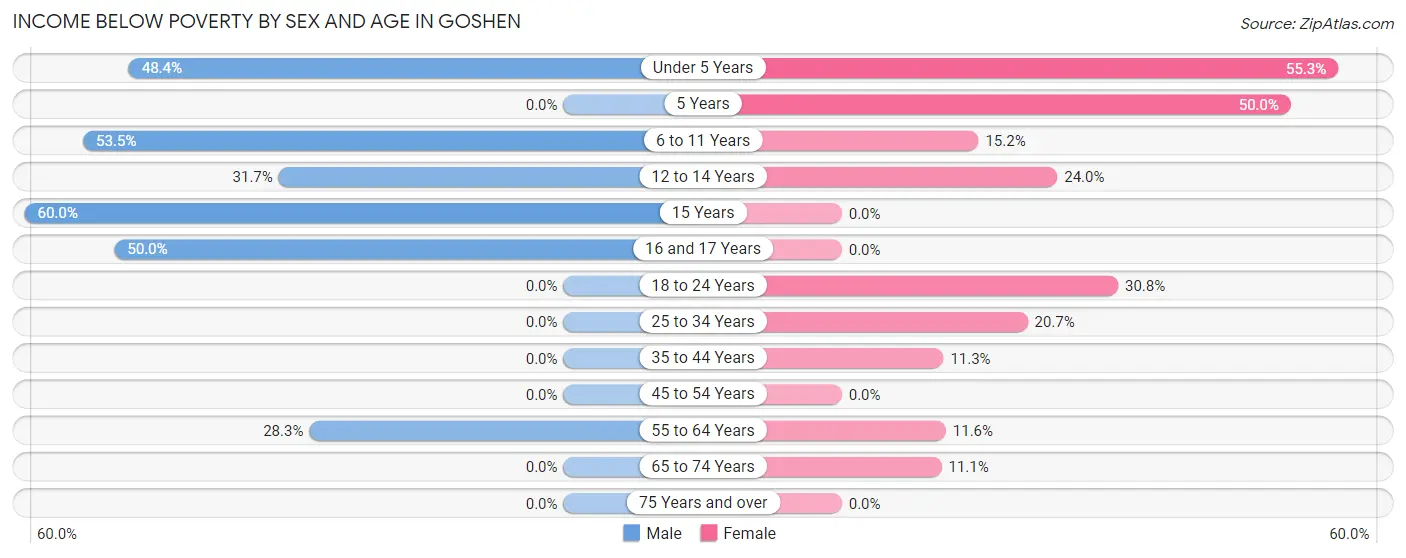
| Age Bracket | Male | Female |
| Under 5 Years | 15 (48.4%) | 21 (55.3%) |
| 5 Years | 0 (0.0%) | 6 (50.0%) |
| 6 to 11 Years | 23 (53.5%) | 7 (15.2%) |
| 12 to 14 Years | 13 (31.7%) | 6 (24.0%) |
| 15 Years | 6 (60.0%) | 0 (0.0%) |
| 16 and 17 Years | 6 (50.0%) | 0 (0.0%) |
| 18 to 24 Years | 0 (0.0%) | 20 (30.8%) |
| 25 to 34 Years | 0 (0.0%) | 12 (20.7%) |
| 35 to 44 Years | 0 (0.0%) | 6 (11.3%) |
| 45 to 54 Years | 0 (0.0%) | 0 (0.0%) |
| 55 to 64 Years | 15 (28.3%) | 8 (11.6%) |
| 65 to 74 Years | 0 (0.0%) | 2 (11.1%) |
| 75 Years and over | 0 (0.0%) | 0 (0.0%) |
| Total | 78 (18.8%) | 88 (19.6%) |
Income Above Poverty by Sex and Age in Goshen
According to the poverty statistics in Goshen, males aged 5 years and females aged 15 years are the age groups that are most secure financially, with 100.0% of males and 100.0% of females in these age groups living above the poverty line.
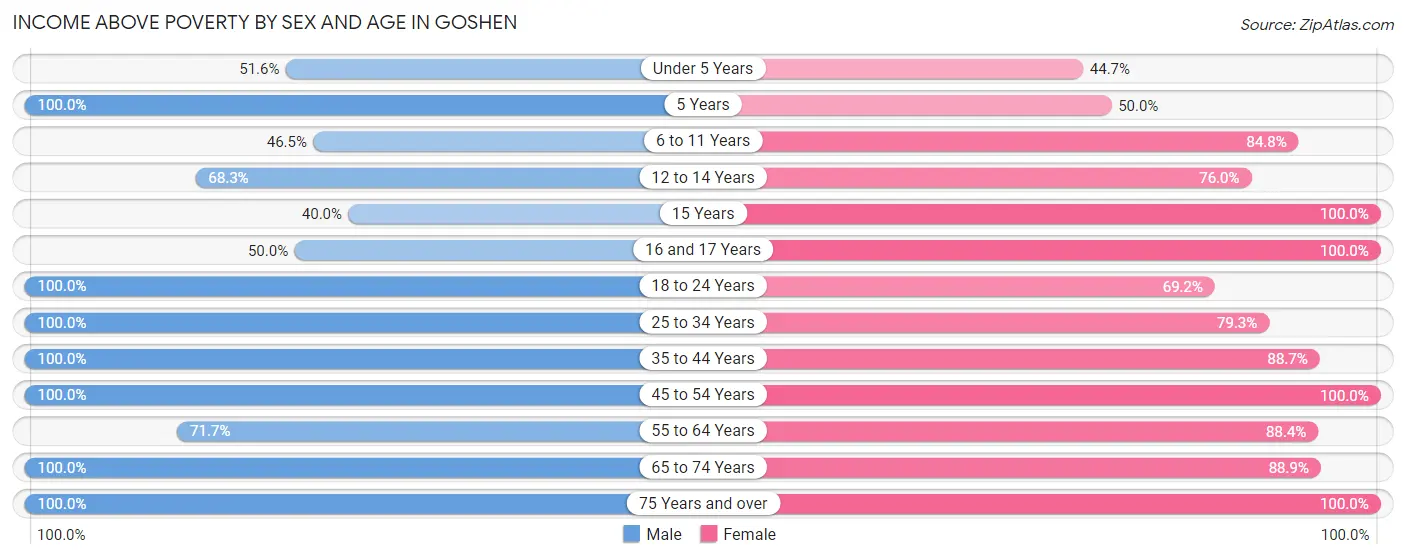
| Age Bracket | Male | Female |
| Under 5 Years | 16 (51.6%) | 17 (44.7%) |
| 5 Years | 4 (100.0%) | 6 (50.0%) |
| 6 to 11 Years | 20 (46.5%) | 39 (84.8%) |
| 12 to 14 Years | 28 (68.3%) | 19 (76.0%) |
| 15 Years | 4 (40.0%) | 14 (100.0%) |
| 16 and 17 Years | 6 (50.0%) | 13 (100.0%) |
| 18 to 24 Years | 13 (100.0%) | 45 (69.2%) |
| 25 to 34 Years | 61 (100.0%) | 46 (79.3%) |
| 35 to 44 Years | 46 (100.0%) | 47 (88.7%) |
| 45 to 54 Years | 86 (100.0%) | 27 (100.0%) |
| 55 to 64 Years | 38 (71.7%) | 61 (88.4%) |
| 65 to 74 Years | 4 (100.0%) | 16 (88.9%) |
| 75 Years and over | 12 (100.0%) | 11 (100.0%) |
| Total | 338 (81.2%) | 361 (80.4%) |
Income Below Poverty Among Married-Couple Families in Goshen
The poverty statistics for married-couple families in Goshen show that 7.7% or 15 of the total 195 families live below the poverty line. Families with 5 or more children have the highest poverty rate of 63.6%, comprising of 7 families. On the other hand, families with no children have the lowest poverty rate of 0.0%, which includes 0 families.
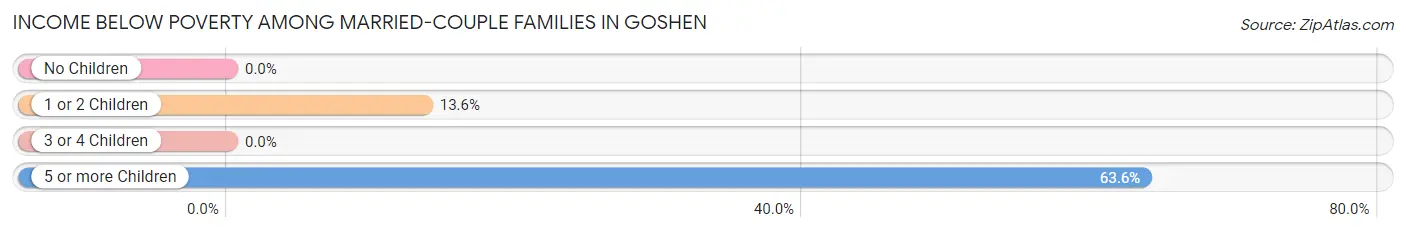
| Children | Above Poverty | Below Poverty |
| No Children | 96 (100.0%) | 0 (0.0%) |
| 1 or 2 Children | 51 (86.4%) | 8 (13.6%) |
| 3 or 4 Children | 29 (100.0%) | 0 (0.0%) |
| 5 or more Children | 4 (36.4%) | 7 (63.6%) |
| Total | 180 (92.3%) | 15 (7.7%) |
Income Below Poverty Among Single-Parent Households in Goshen
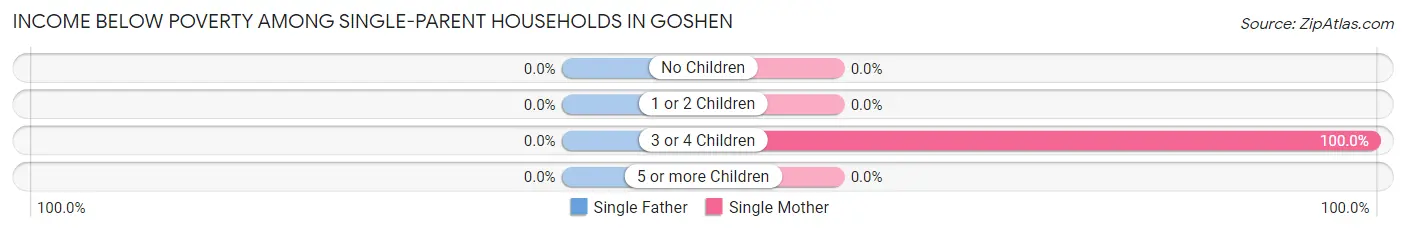
| Children | Single Father | Single Mother |
| No Children | 0 (0.0%) | 0 (0.0%) |
| 1 or 2 Children | 0 (0.0%) | 0 (0.0%) |
| 3 or 4 Children | 0 (0.0%) | 6 (100.0%) |
| 5 or more Children | 0 (0.0%) | 0 (0.0%) |
| Total | 0 (0.0%) | 6 (21.4%) |
Income Below Poverty Among Married-Couple vs Single-Parent Households in Goshen
The poverty data for Goshen shows that 15 of the married-couple family households (7.7%) and 6 of the single-parent households (18.8%) are living below the poverty level. Within the married-couple family households, those with 5 or more children have the highest poverty rate, with 7 households (63.6%) falling below the poverty line. Among the single-parent households, those with 3 or 4 children have the highest poverty rate, with 6 household (60.0%) living below poverty.
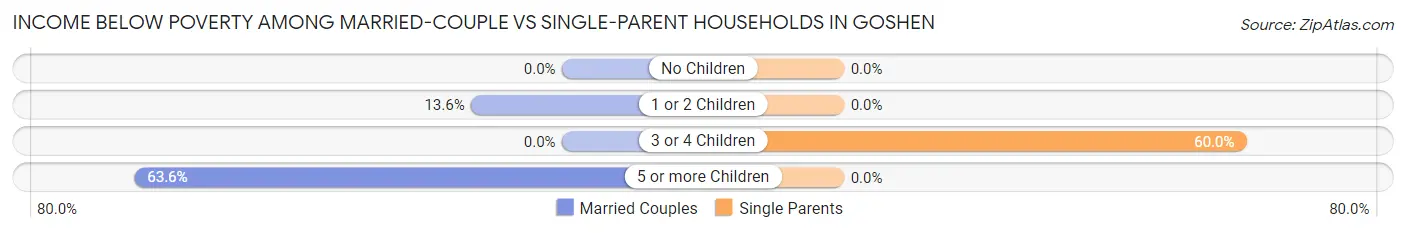
| Children | Married-Couple Families | Single-Parent Households |
| No Children | 0 (0.0%) | 0 (0.0%) |
| 1 or 2 Children | 8 (13.6%) | 0 (0.0%) |
| 3 or 4 Children | 0 (0.0%) | 6 (60.0%) |
| 5 or more Children | 7 (63.6%) | 0 (0.0%) |
| Total | 15 (7.7%) | 6 (18.8%) |
Race in Goshen
The most populous races in Goshen are White / Caucasian (651 | 75.3%), Hispanic or Latino (269 | 31.1%), and Some other Race (161 | 18.6%).
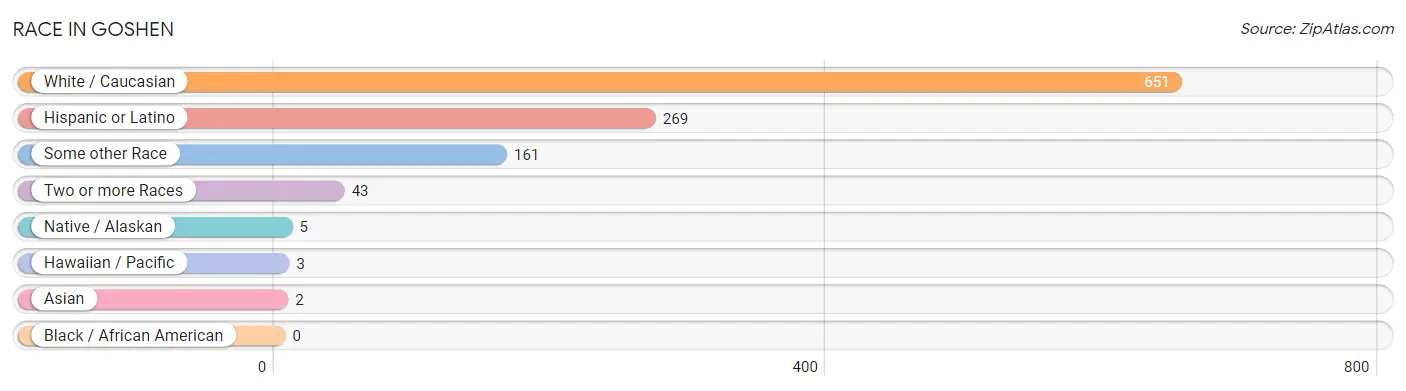
| Race | # Population | % Population |
| Asian | 2 | 0.2% |
| Black / African American | 0 | 0.0% |
| Hawaiian / Pacific | 3 | 0.4% |
| Hispanic or Latino | 269 | 31.1% |
| Native / Alaskan | 5 | 0.6% |
| White / Caucasian | 651 | 75.3% |
| Two or more Races | 43 | 5.0% |
| Some other Race | 161 | 18.6% |
| Total | 865 | 100.0% |
Ancestry in Goshen
The most populous ancestries reported in Goshen are Mexican (221 | 25.6%), English (144 | 16.7%), German (51 | 5.9%), Central American (48 | 5.6%), and Honduran (42 | 4.9%), together accounting for 58.5% of all Goshen residents.
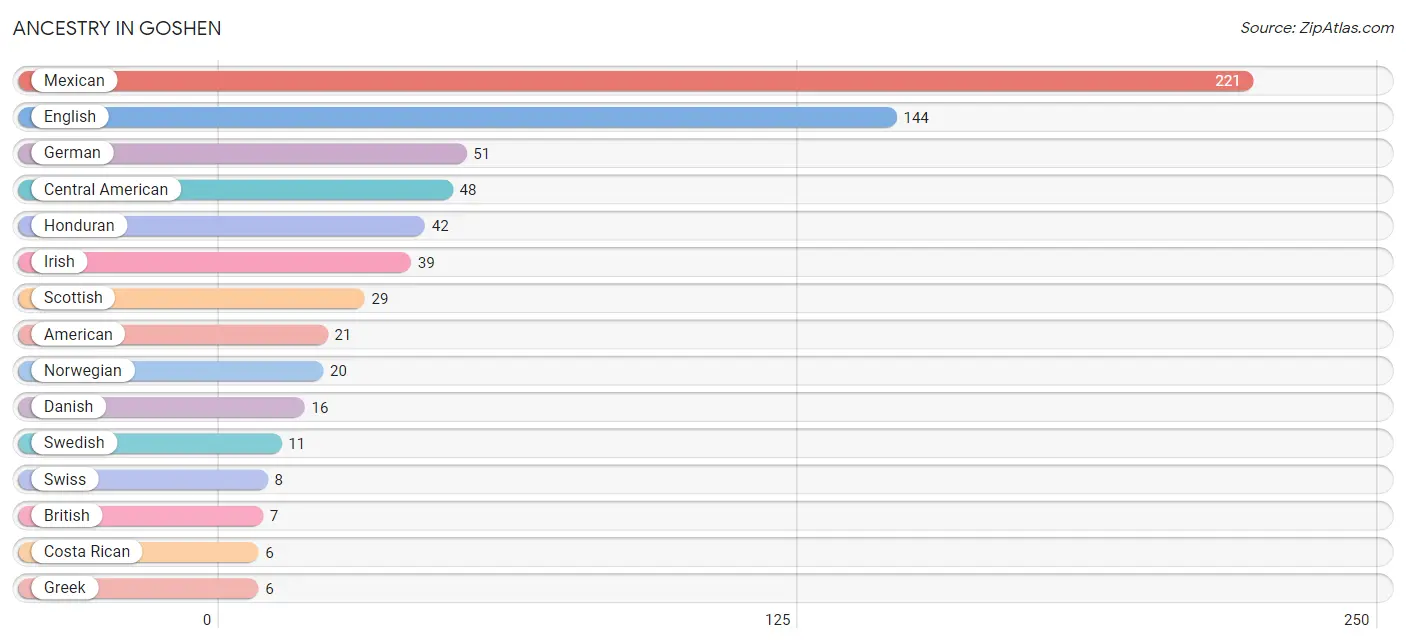
| Ancestry | # Population | % Population |
| American | 21 | 2.4% |
| British | 7 | 0.8% |
| Central American | 48 | 5.6% |
| Cherokee | 5 | 0.6% |
| Costa Rican | 6 | 0.7% |
| Danish | 16 | 1.8% |
| Dutch | 4 | 0.5% |
| English | 144 | 16.7% |
| European | 5 | 0.6% |
| French | 2 | 0.2% |
| German | 51 | 5.9% |
| Greek | 6 | 0.7% |
| Honduran | 42 | 4.9% |
| Irish | 39 | 4.5% |
| Italian | 6 | 0.7% |
| Korean | 1 | 0.1% |
| Mexican | 221 | 25.6% |
| Norwegian | 20 | 2.3% |
| Pakistani | 2 | 0.2% |
| Scotch-Irish | 2 | 0.2% |
| Scottish | 29 | 3.4% |
| South African | 1 | 0.1% |
| Subsaharan African | 1 | 0.1% |
| Swedish | 11 | 1.3% |
| Swiss | 8 | 0.9% |
| Tongan | 3 | 0.4% | View All 26 Rows |
Immigrants in Goshen
The most numerous immigrant groups reported in Goshen came from Central America (108 | 12.5%), Latin America (108 | 12.5%), Mexico (74 | 8.6%), Honduras (21 | 2.4%), and Guatemala (13 | 1.5%), together accounting for 37.5% of all Goshen residents.
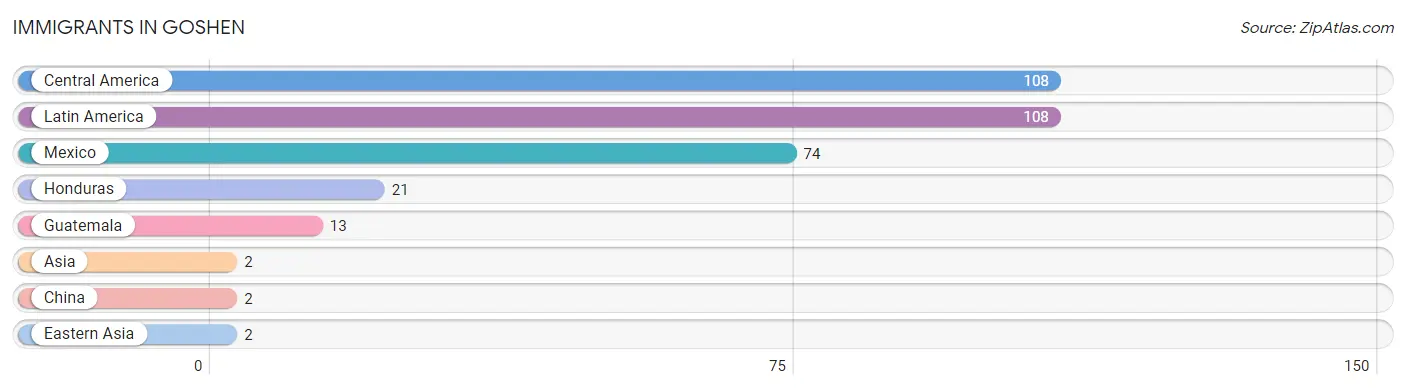
| Immigration Origin | # Population | % Population |
| Asia | 2 | 0.2% |
| Central America | 108 | 12.5% |
| China | 2 | 0.2% |
| Eastern Asia | 2 | 0.2% |
| Guatemala | 13 | 1.5% |
| Honduras | 21 | 2.4% |
| Latin America | 108 | 12.5% |
| Mexico | 74 | 8.6% | View All 8 Rows |
Sex and Age in Goshen
Sex and Age in Goshen
The most populous age groups in Goshen are 10 to 14 Years (70 | 16.8%) for men and 20 to 24 Years (58 | 12.9%) for women.
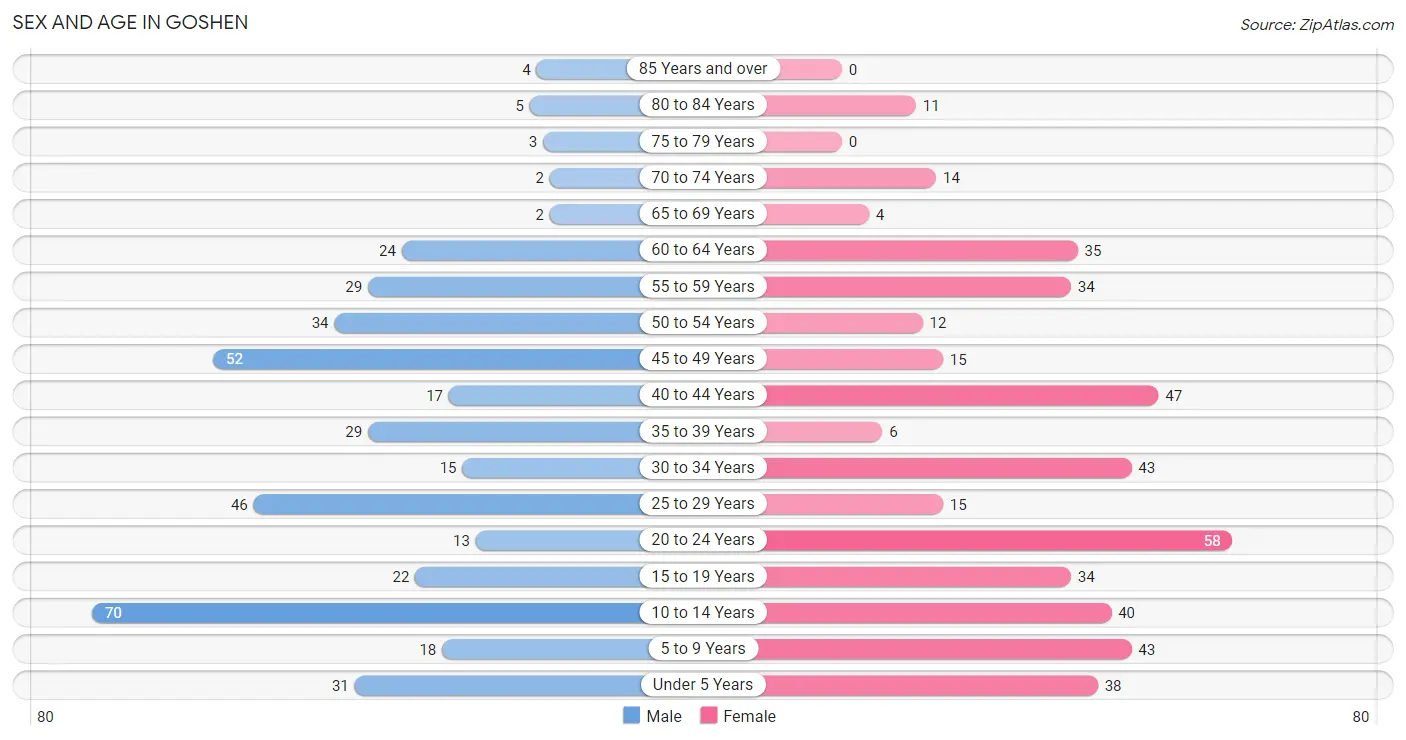
| Age Bracket | Male | Female |
| Under 5 Years | 31 (7.4%) | 38 (8.5%) |
| 5 to 9 Years | 18 (4.3%) | 43 (9.6%) |
| 10 to 14 Years | 70 (16.8%) | 40 (8.9%) |
| 15 to 19 Years | 22 (5.3%) | 34 (7.6%) |
| 20 to 24 Years | 13 (3.1%) | 58 (12.9%) |
| 25 to 29 Years | 46 (11.1%) | 15 (3.3%) |
| 30 to 34 Years | 15 (3.6%) | 43 (9.6%) |
| 35 to 39 Years | 29 (7.0%) | 6 (1.3%) |
| 40 to 44 Years | 17 (4.1%) | 47 (10.5%) |
| 45 to 49 Years | 52 (12.5%) | 15 (3.3%) |
| 50 to 54 Years | 34 (8.2%) | 12 (2.7%) |
| 55 to 59 Years | 29 (7.0%) | 34 (7.6%) |
| 60 to 64 Years | 24 (5.8%) | 35 (7.8%) |
| 65 to 69 Years | 2 (0.5%) | 4 (0.9%) |
| 70 to 74 Years | 2 (0.5%) | 14 (3.1%) |
| 75 to 79 Years | 3 (0.7%) | 0 (0.0%) |
| 80 to 84 Years | 5 (1.2%) | 11 (2.5%) |
| 85 Years and over | 4 (1.0%) | 0 (0.0%) |
| Total | 416 (100.0%) | 449 (100.0%) |
Families and Households in Goshen
Median Family Size in Goshen
The median family size in Goshen is 3.32 persons per family, with single male/father families (4 | 1.8%) accounting for the largest median family size of 3.75 persons per family. On the other hand, single female/mother families (28 | 12.3%) represent the smallest median family size with 2.86 persons per family.
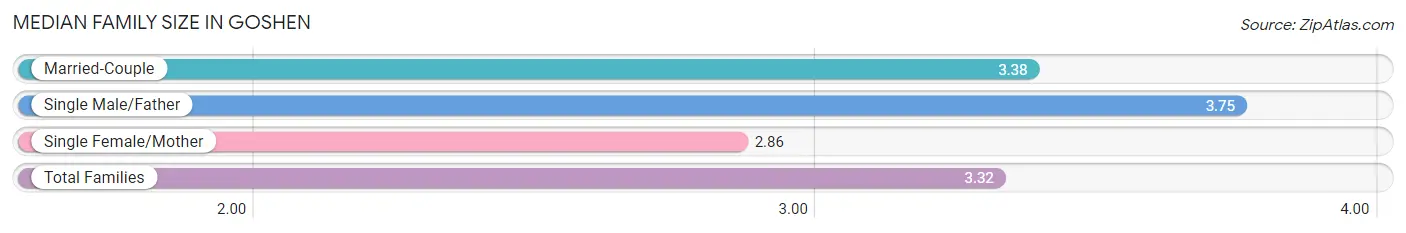
| Family Type | # Families | Family Size |
| Married-Couple | 195 (85.9%) | 3.38 |
| Single Male/Father | 4 (1.8%) | 3.75 |
| Single Female/Mother | 28 (12.3%) | 2.86 |
| Total Families | 227 (100.0%) | 3.32 |
Median Household Size in Goshen
The median household size in Goshen is 3.04 persons per household, with single male/father households (4 | 1.4%) accounting for the largest median household size of 4.5 persons per household. non-family households (58 | 20.3%) represent the smallest median household size with 1.52 persons per household.
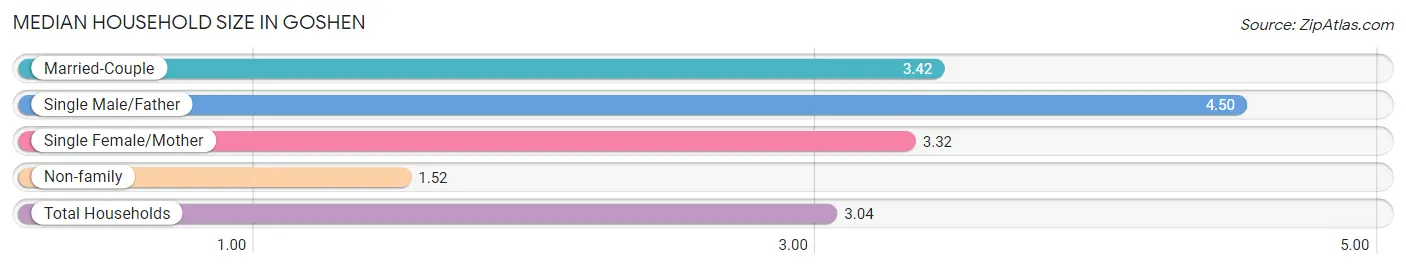
| Household Type | # Households | Household Size |
| Married-Couple | 195 (68.4%) | 3.42 |
| Single Male/Father | 4 (1.4%) | 4.50 |
| Single Female/Mother | 28 (9.8%) | 3.32 |
| Non-family | 58 (20.3%) | 1.52 |
| Total Households | 285 (100.0%) | 3.04 |
Household Size by Marriage Status in Goshen
Out of a total of 285 households in Goshen, 227 (79.6%) are family households, while 58 (20.3%) are nonfamily households. The most numerous type of family households are 2-person households, comprising 81, and the most common type of nonfamily households are 2-person households, comprising 30.
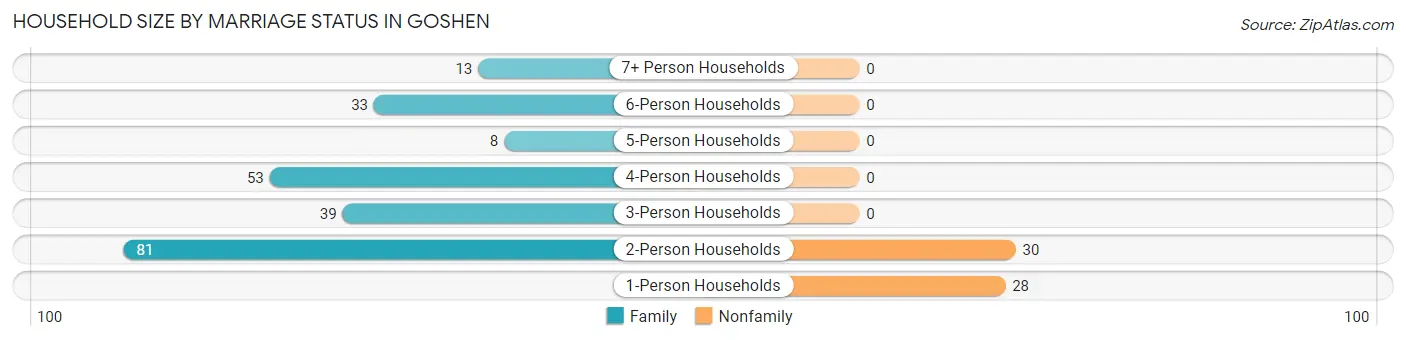
| Household Size | Family Households | Nonfamily Households |
| 1-Person Households | - | 28 (9.8%) |
| 2-Person Households | 81 (28.4%) | 30 (10.5%) |
| 3-Person Households | 39 (13.7%) | 0 (0.0%) |
| 4-Person Households | 53 (18.6%) | 0 (0.0%) |
| 5-Person Households | 8 (2.8%) | 0 (0.0%) |
| 6-Person Households | 33 (11.6%) | 0 (0.0%) |
| 7+ Person Households | 13 (4.6%) | 0 (0.0%) |
| Total | 227 (79.6%) | 58 (20.3%) |
Female Fertility in Goshen
Fertility by Age in Goshen
Average fertility rate in Goshen is 44.0 births per 1,000 women. Women in the age bracket of 20 to 34 years have the highest fertility rate with 86.0 births per 1,000 women. Women in the age bracket of 20 to 34 years acount for 100.0% of all women with births.
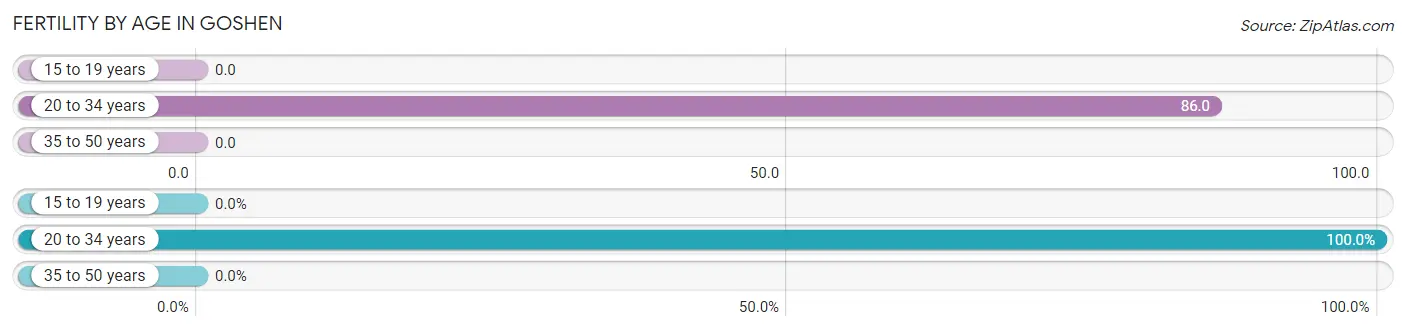
| Age Bracket | Women with Births | Births / 1,000 Women |
| 15 to 19 years | 0 (0.0%) | 0.0 |
| 20 to 34 years | 10 (100.0%) | 86.0 |
| 35 to 50 years | 0 (0.0%) | 0.0 |
| Total | 10 (100.0%) | 44.0 |
Fertility by Age by Marriage Status in Goshen
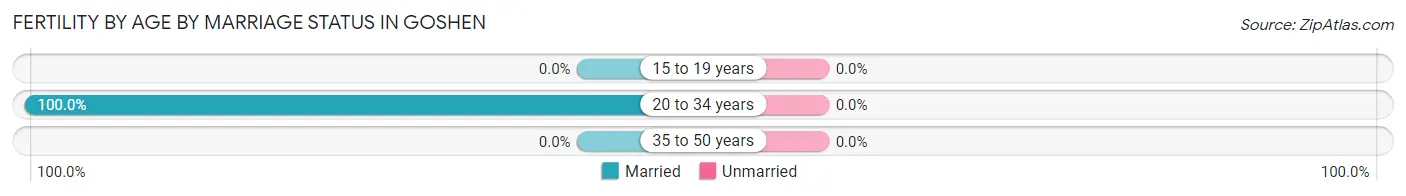
| Age Bracket | Married | Unmarried |
| 15 to 19 years | 0 (0.0%) | 0 (0.0%) |
| 20 to 34 years | 10 (100.0%) | 0 (0.0%) |
| 35 to 50 years | 0 (0.0%) | 0 (0.0%) |
| Total | 10 (100.0%) | 0 (0.0%) |
Fertility by Education in Goshen
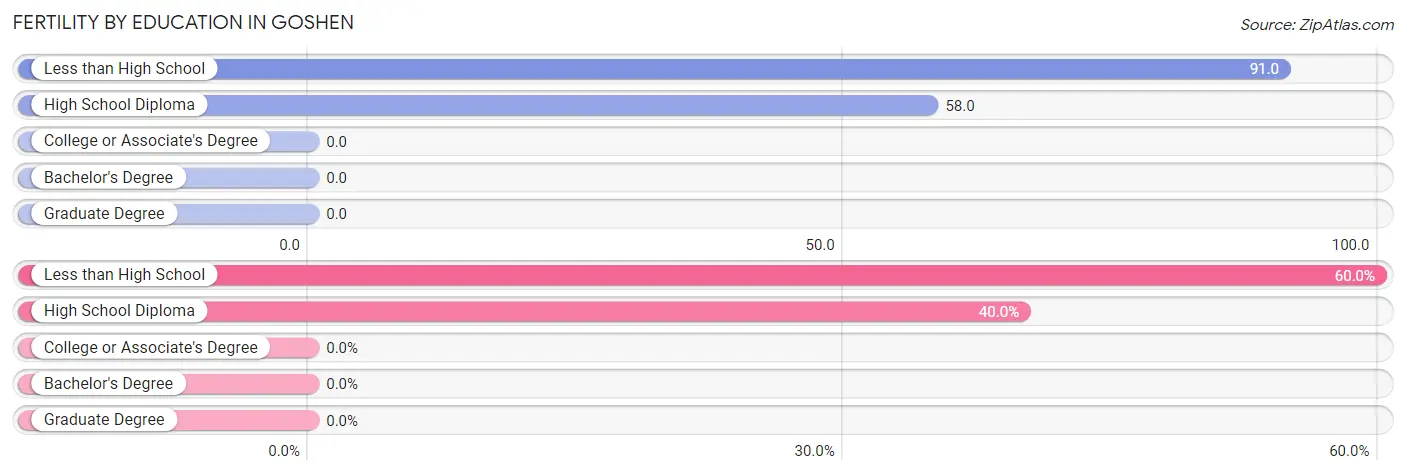
| Educational Attainment | Women with Births | Births / 1,000 Women |
| Less than High School | 6 (60.0%) | 91.0 |
| High School Diploma | 4 (40.0%) | 58.0 |
| College or Associate's Degree | 0 (0.0%) | 0.0 |
| Bachelor's Degree | 0 (0.0%) | 0.0 |
| Graduate Degree | 0 (0.0%) | 0.0 |
| Total | 10 (100.0%) | 44.0 |
Fertility by Education by Marriage Status in Goshen
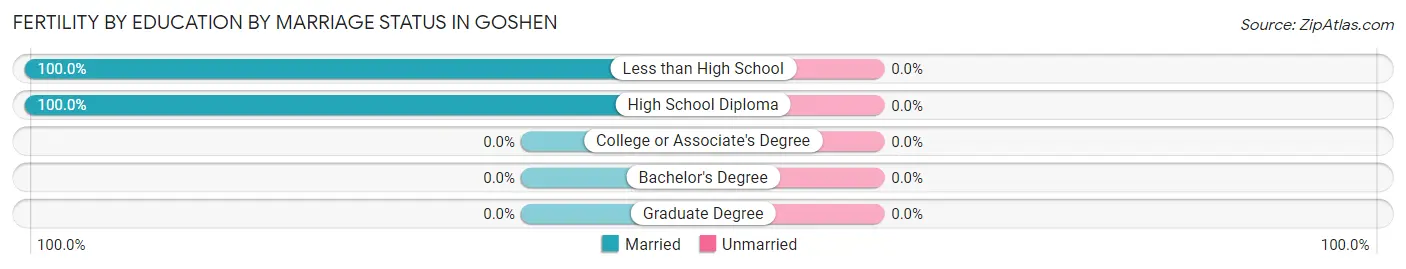
| Educational Attainment | Married | Unmarried |
| Less than High School | 6 (100.0%) | 0 (0.0%) |
| High School Diploma | 4 (100.0%) | 0 (0.0%) |
| College or Associate's Degree | 0 (0.0%) | 0 (0.0%) |
| Bachelor's Degree | 0 (0.0%) | 0 (0.0%) |
| Graduate Degree | 0 (0.0%) | 0 (0.0%) |
| Total | 10 (100.0%) | 0 (0.0%) |
Employment Characteristics in Goshen
Employment by Class of Employer in Goshen
Among the 453 employed individuals in Goshen, private company employees (330 | 72.9%), local government employees (52 | 11.5%), and self-employed (not incorporated) (42 | 9.3%) make up the most common classes of employment.
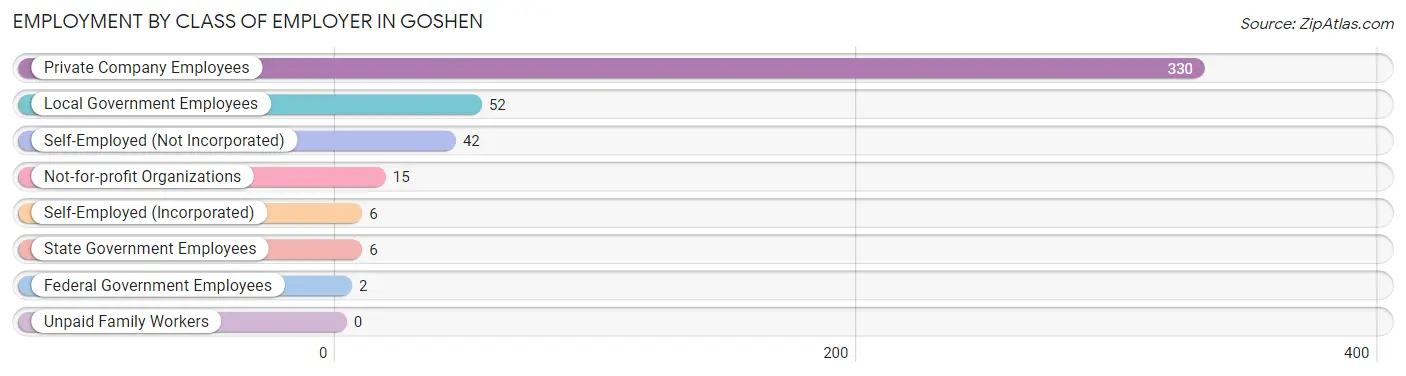
| Employer Class | # Employees | % Employees |
| Private Company Employees | 330 | 72.9% |
| Self-Employed (Incorporated) | 6 | 1.3% |
| Self-Employed (Not Incorporated) | 42 | 9.3% |
| Not-for-profit Organizations | 15 | 3.3% |
| Local Government Employees | 52 | 11.5% |
| State Government Employees | 6 | 1.3% |
| Federal Government Employees | 2 | 0.4% |
| Unpaid Family Workers | 0 | 0.0% |
| Total | 453 | 100.0% |
Employment Status by Age in Goshen
According to the labor force statistics for Goshen, out of the total population over 16 years of age (601), 76.4% or 459 individuals are in the labor force, with 1.3% or 6 of them unemployed. The age group with the highest labor force participation rate is 45 to 54 years, with 96.5% or 109 individuals in the labor force. Within the labor force, the 35 to 44 years age range has the highest percentage of unemployed individuals, with 7.1% or 6 of them being unemployed.
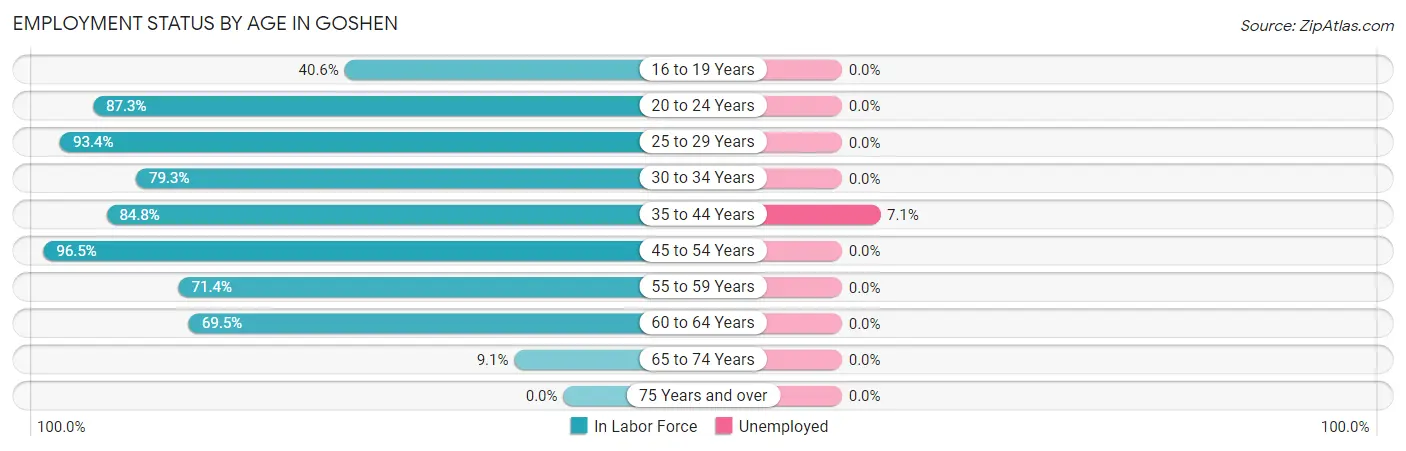
| Age Bracket | In Labor Force | Unemployed |
| 16 to 19 Years | 13 (40.6%) | 0 (0.0%) |
| 20 to 24 Years | 62 (87.3%) | 0 (0.0%) |
| 25 to 29 Years | 57 (93.4%) | 0 (0.0%) |
| 30 to 34 Years | 46 (79.3%) | 0 (0.0%) |
| 35 to 44 Years | 84 (84.8%) | 6 (7.1%) |
| 45 to 54 Years | 109 (96.5%) | 0 (0.0%) |
| 55 to 59 Years | 45 (71.4%) | 0 (0.0%) |
| 60 to 64 Years | 41 (69.5%) | 0 (0.0%) |
| 65 to 74 Years | 2 (9.1%) | 0 (0.0%) |
| 75 Years and over | 0 (0.0%) | 0 (0.0%) |
| Total | 459 (76.4%) | 6 (1.3%) |
Employment Status by Educational Attainment in Goshen
According to labor force statistics for Goshen, 84.3% of individuals (382) out of the total population between 25 and 64 years of age (453) are in the labor force, with 1.6% or 6 of them being unemployed. The group with the highest labor force participation rate are those with the educational attainment of bachelor's degree or higher, with 100.0% or 40 individuals in the labor force. Within the labor force, individuals with high school diploma education have the highest percentage of unemployment, with 5.4% or 6 of them being unemployed.
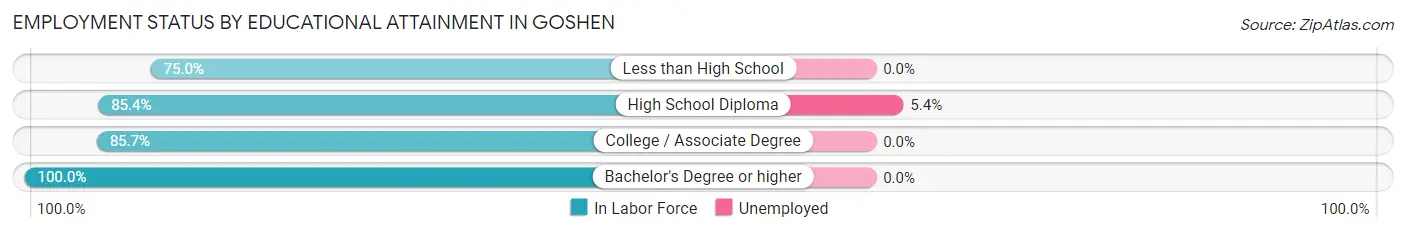
| Educational Attainment | In Labor Force | Unemployed |
| Less than High School | 81 (75.0%) | 0 (0.0%) |
| High School Diploma | 111 (85.4%) | 7 (5.4%) |
| College / Associate Degree | 150 (85.7%) | 0 (0.0%) |
| Bachelor's Degree or higher | 40 (100.0%) | 0 (0.0%) |
| Total | 382 (84.3%) | 7 (1.6%) |
Employment Occupations by Sex in Goshen
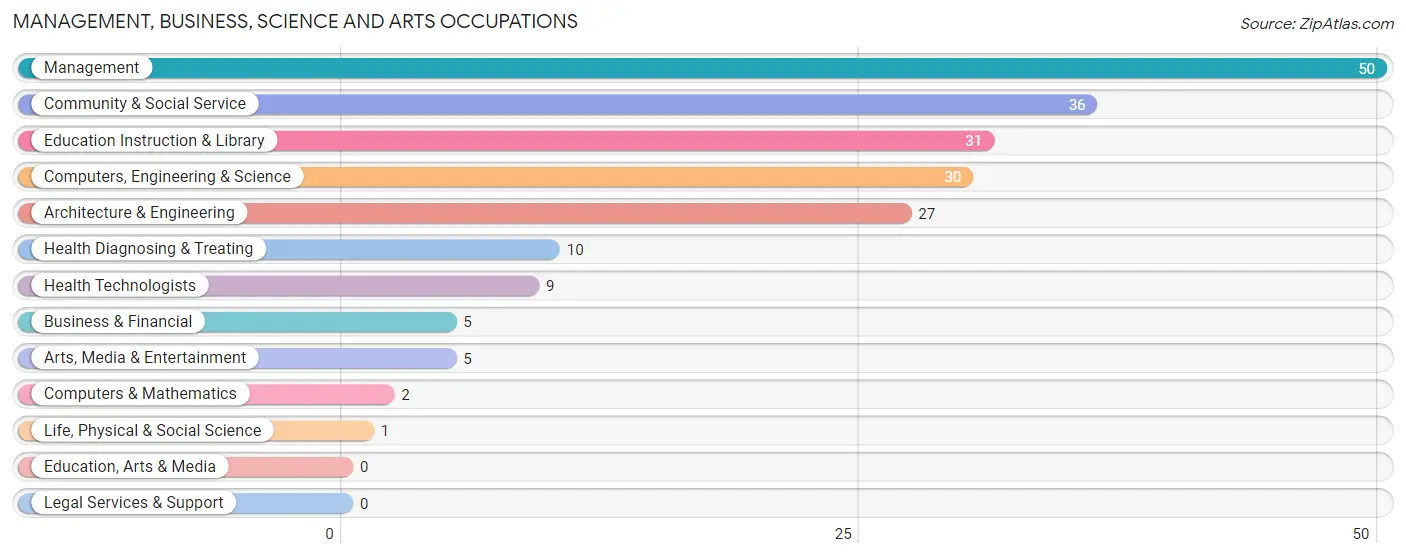
Management, Business, Science and Arts Occupations
The most common Management, Business, Science and Arts occupations in Goshen are Management (50 | 11.0%), Community & Social Service (36 | 8.0%), Education Instruction & Library (31 | 6.8%), Computers, Engineering & Science (30 | 6.6%), and Architecture & Engineering (27 | 6.0%).
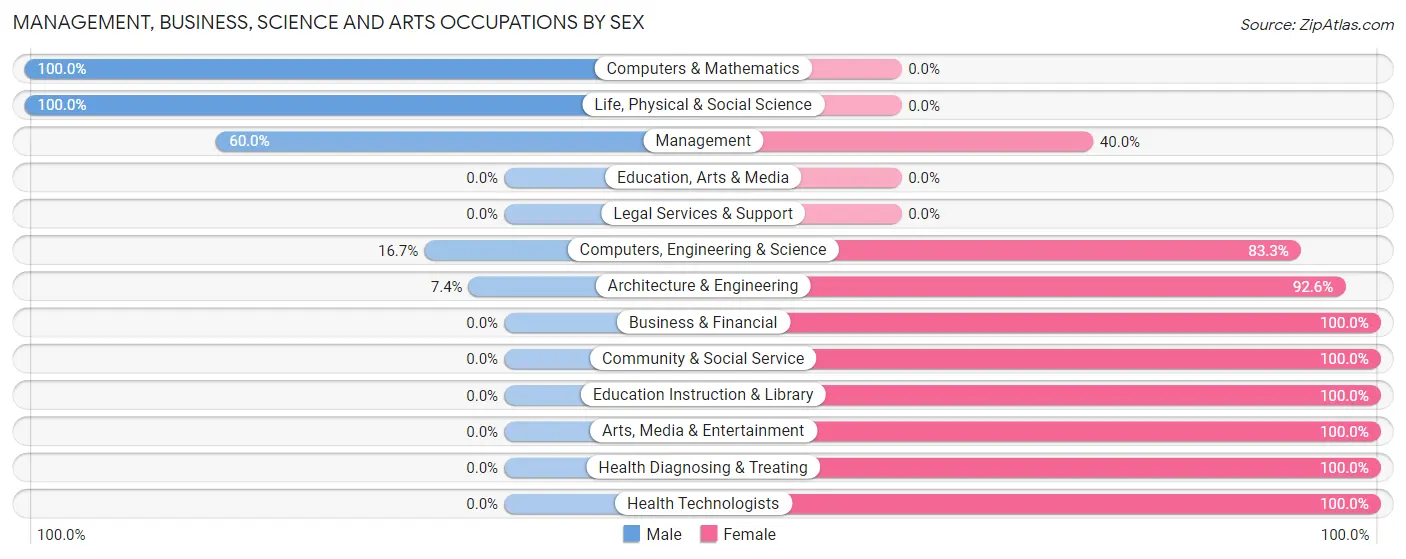
Management, Business, Science and Arts Occupations by Sex
Within the Management, Business, Science and Arts occupations in Goshen, the most male-oriented occupations are Computers & Mathematics (100.0%), Life, Physical & Social Science (100.0%), and Management (60.0%), while the most female-oriented occupations are Business & Financial (100.0%), Community & Social Service (100.0%), and Education Instruction & Library (100.0%).
| Occupation | Male | Female |
| Management | 30 (60.0%) | 20 (40.0%) |
| Business & Financial | 0 (0.0%) | 5 (100.0%) |
| Computers, Engineering & Science | 5 (16.7%) | 25 (83.3%) |
| Computers & Mathematics | 2 (100.0%) | 0 (0.0%) |
| Architecture & Engineering | 2 (7.4%) | 25 (92.6%) |
| Life, Physical & Social Science | 1 (100.0%) | 0 (0.0%) |
| Community & Social Service | 0 (0.0%) | 36 (100.0%) |
| Education, Arts & Media | 0 (0.0%) | 0 (0.0%) |
| Legal Services & Support | 0 (0.0%) | 0 (0.0%) |
| Education Instruction & Library | 0 (0.0%) | 31 (100.0%) |
| Arts, Media & Entertainment | 0 (0.0%) | 5 (100.0%) |
| Health Diagnosing & Treating | 0 (0.0%) | 10 (100.0%) |
| Health Technologists | 0 (0.0%) | 9 (100.0%) |
| Total (Category) | 35 (26.7%) | 96 (73.3%) |
| Total (Overall) | 246 (54.3%) | 207 (45.7%) |
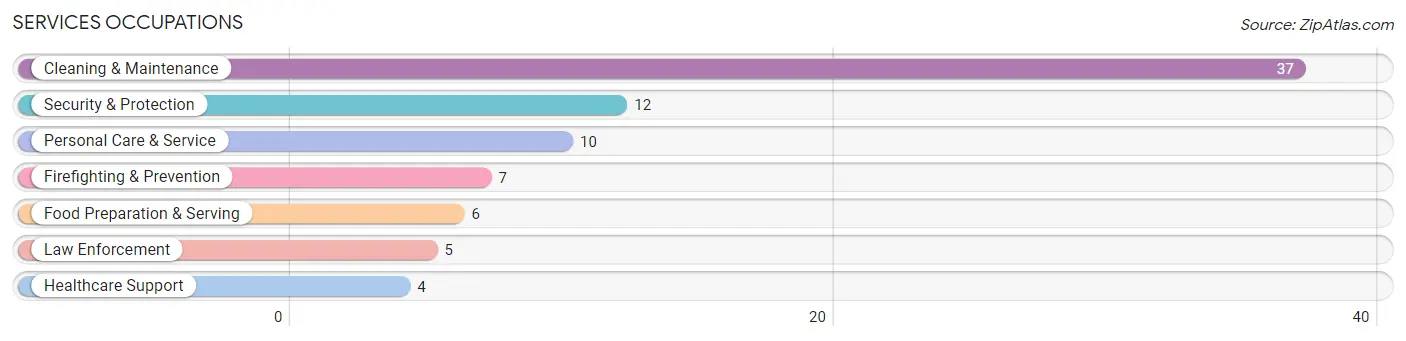
Services Occupations
The most common Services occupations in Goshen are Cleaning & Maintenance (37 | 8.2%), Security & Protection (12 | 2.6%), Personal Care & Service (10 | 2.2%), Firefighting & Prevention (7 | 1.5%), and Food Preparation & Serving (6 | 1.3%).
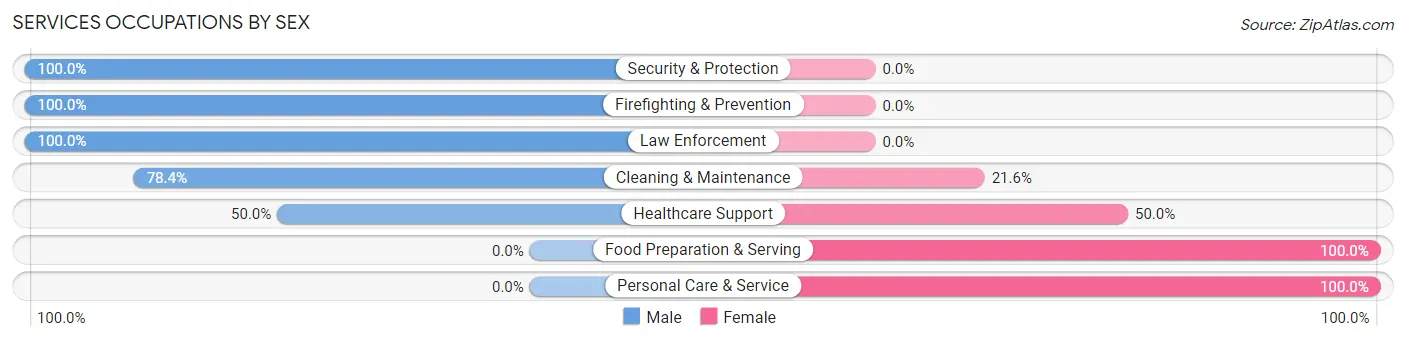
Services Occupations by Sex
Within the Services occupations in Goshen, the most male-oriented occupations are Security & Protection (100.0%), Firefighting & Prevention (100.0%), and Law Enforcement (100.0%), while the most female-oriented occupations are Food Preparation & Serving (100.0%), Personal Care & Service (100.0%), and Healthcare Support (50.0%).
| Occupation | Male | Female |
| Healthcare Support | 2 (50.0%) | 2 (50.0%) |
| Security & Protection | 12 (100.0%) | 0 (0.0%) |
| Firefighting & Prevention | 7 (100.0%) | 0 (0.0%) |
| Law Enforcement | 5 (100.0%) | 0 (0.0%) |
| Food Preparation & Serving | 0 (0.0%) | 6 (100.0%) |
| Cleaning & Maintenance | 29 (78.4%) | 8 (21.6%) |
| Personal Care & Service | 0 (0.0%) | 10 (100.0%) |
| Total (Category) | 43 (62.3%) | 26 (37.7%) |
| Total (Overall) | 246 (54.3%) | 207 (45.7%) |
Sales and Office Occupations
The most common Sales and Office occupations in Goshen are Office & Administration (47 | 10.4%), and Sales & Related (11 | 2.4%).
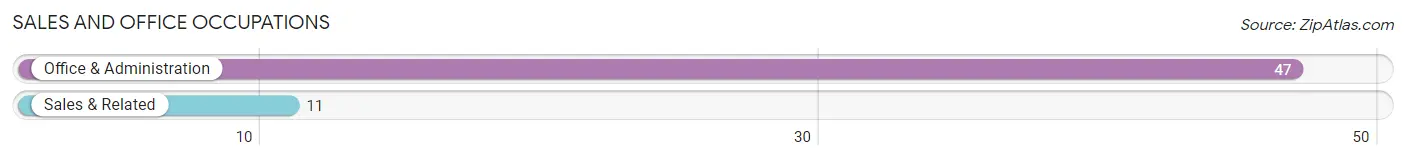
Sales and Office Occupations by Sex
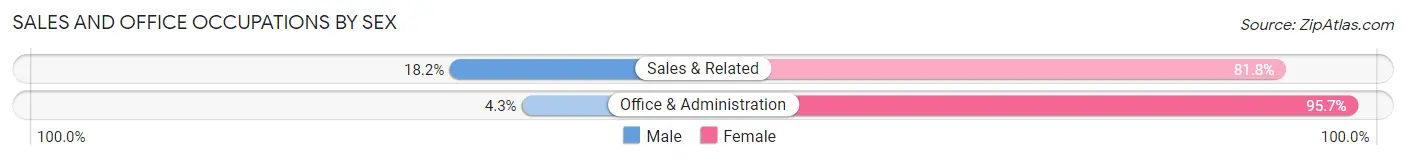
| Occupation | Male | Female |
| Sales & Related | 2 (18.2%) | 9 (81.8%) |
| Office & Administration | 2 (4.3%) | 45 (95.7%) |
| Total (Category) | 4 (6.9%) | 54 (93.1%) |
| Total (Overall) | 246 (54.3%) | 207 (45.7%) |
Natural Resources, Construction and Maintenance Occupations
The most common Natural Resources, Construction and Maintenance occupations in Goshen are Construction & Extraction (64 | 14.1%), Installation, Maintenance & Repair (41 | 9.0%), and Farming, Fishing & Forestry (29 | 6.4%).
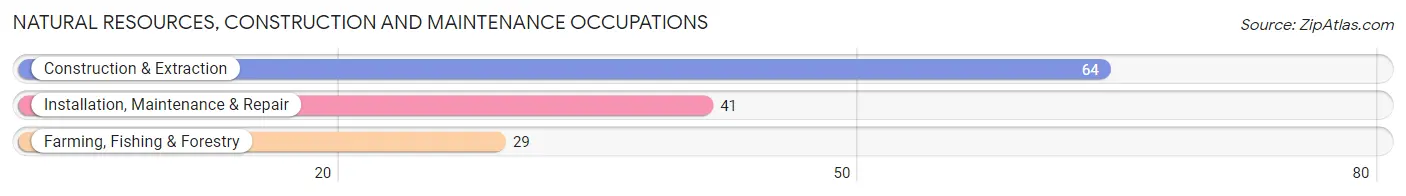
Natural Resources, Construction and Maintenance Occupations by Sex
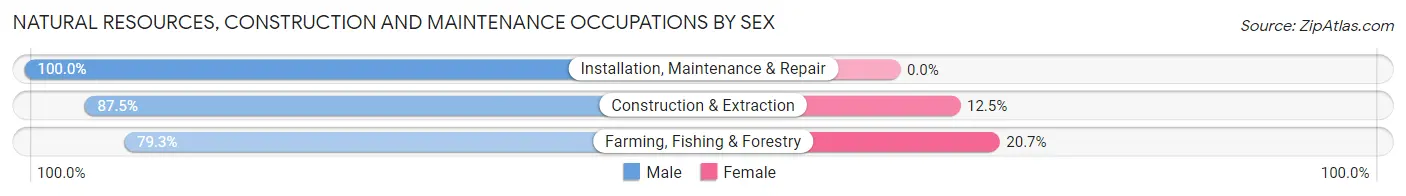
| Occupation | Male | Female |
| Farming, Fishing & Forestry | 23 (79.3%) | 6 (20.7%) |
| Construction & Extraction | 56 (87.5%) | 8 (12.5%) |
| Installation, Maintenance & Repair | 41 (100.0%) | 0 (0.0%) |
| Total (Category) | 120 (89.5%) | 14 (10.4%) |
| Total (Overall) | 246 (54.3%) | 207 (45.7%) |
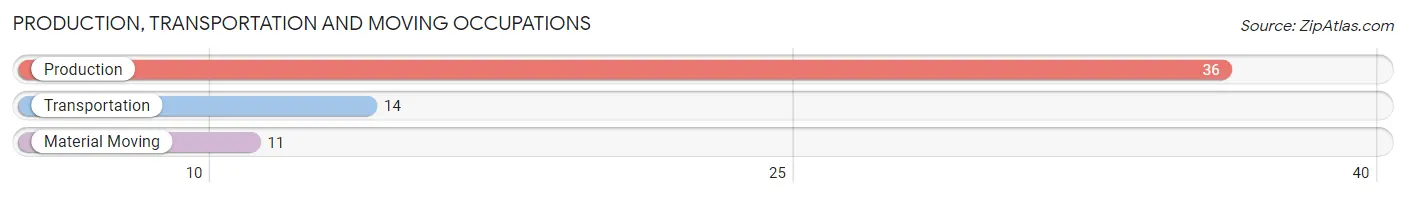
Production, Transportation and Moving Occupations
The most common Production, Transportation and Moving occupations in Goshen are Production (36 | 8.0%), Transportation (14 | 3.1%), and Material Moving (11 | 2.4%).
Production, Transportation and Moving Occupations by Sex
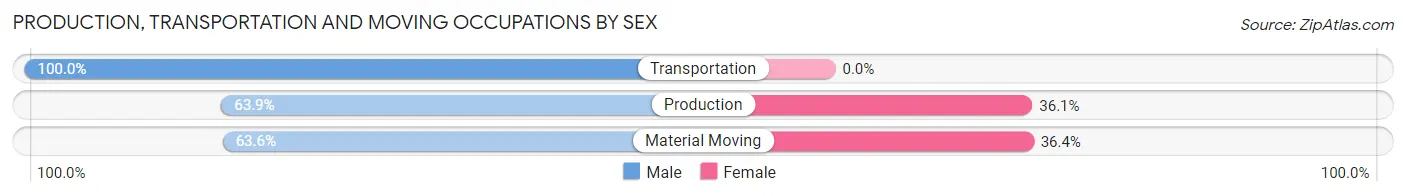
| Occupation | Male | Female |
| Production | 23 (63.9%) | 13 (36.1%) |
| Transportation | 14 (100.0%) | 0 (0.0%) |
| Material Moving | 7 (63.6%) | 4 (36.4%) |
| Total (Category) | 44 (72.1%) | 17 (27.9%) |
| Total (Overall) | 246 (54.3%) | 207 (45.7%) |
Employment Industries by Sex in Goshen
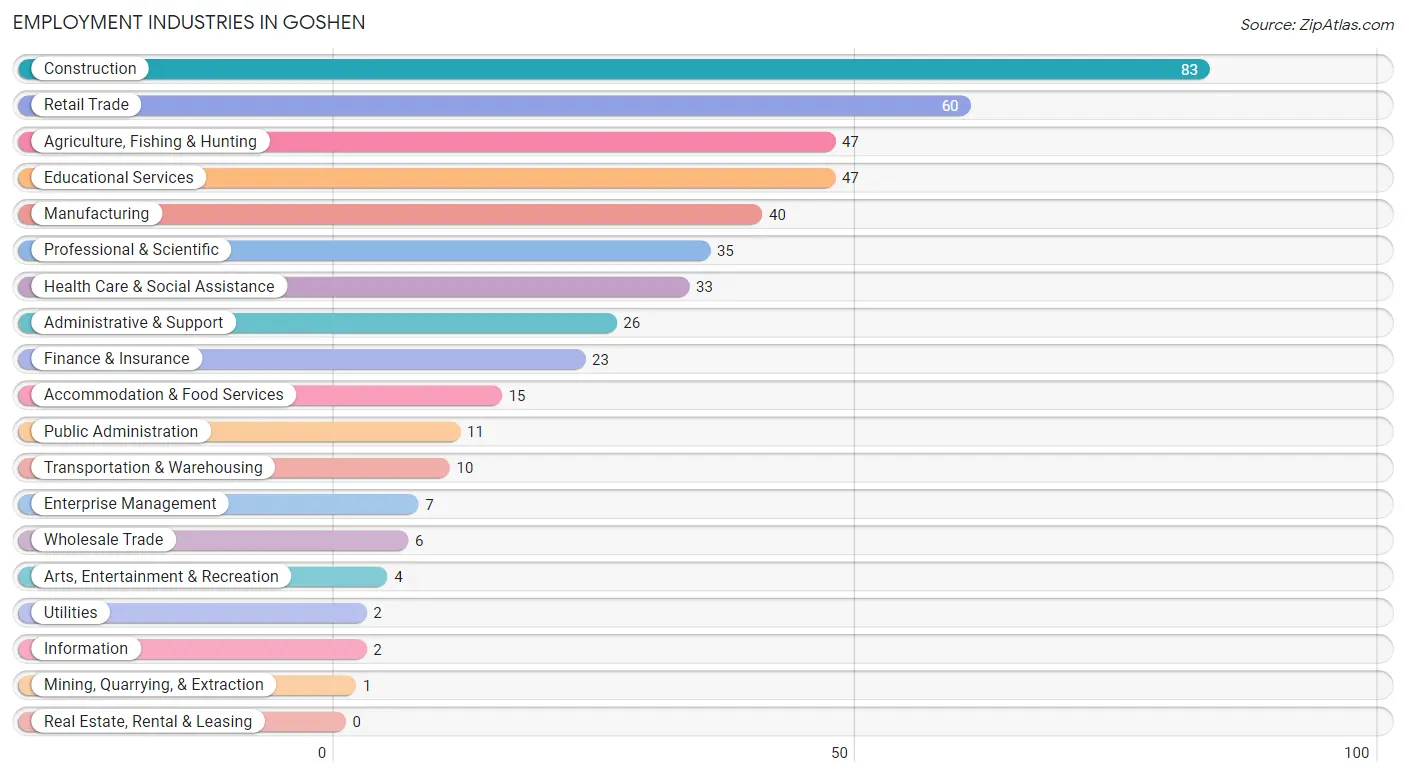
Employment Industries in Goshen
The major employment industries in Goshen include Construction (83 | 18.3%), Retail Trade (60 | 13.3%), Agriculture, Fishing & Hunting (47 | 10.4%), Educational Services (47 | 10.4%), and Manufacturing (40 | 8.8%).
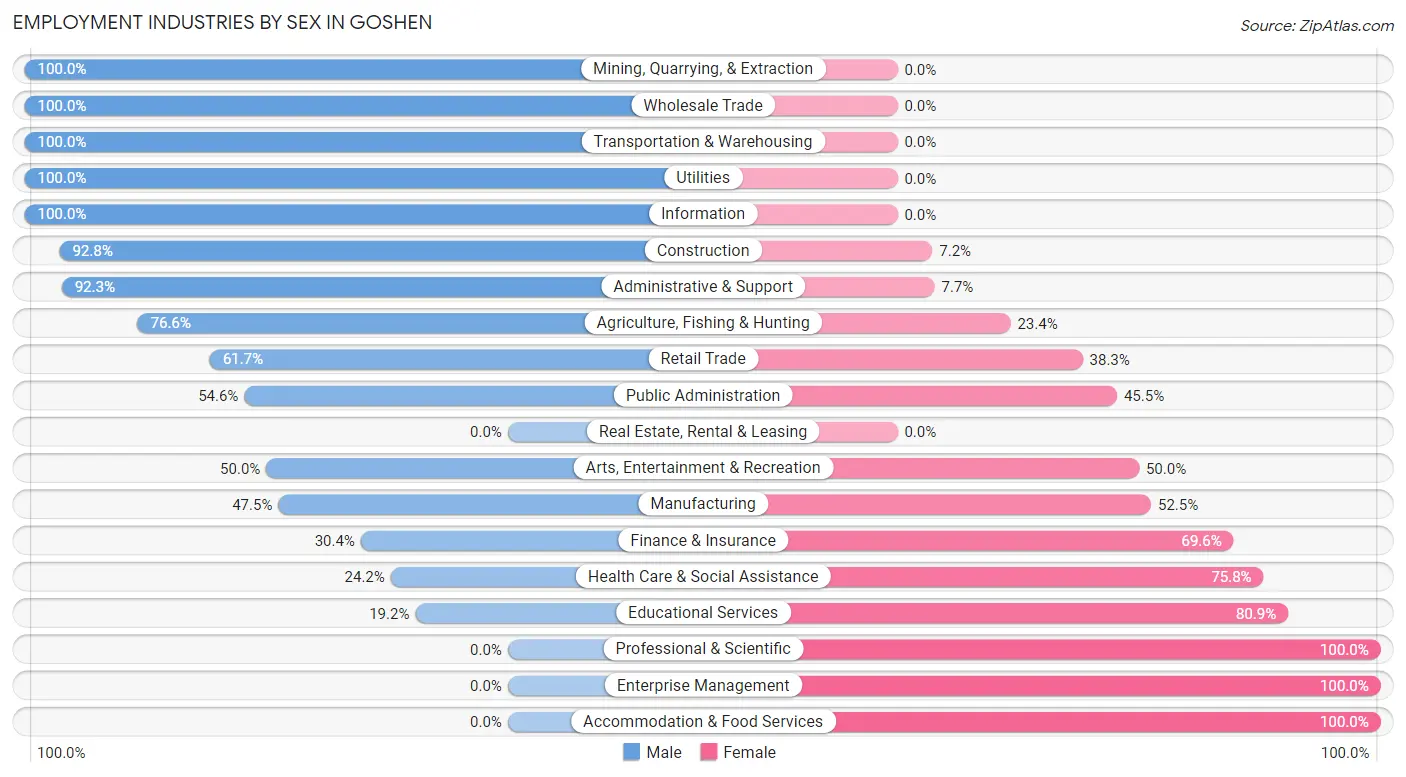
Employment Industries by Sex in Goshen
The Goshen industries that see more men than women are Mining, Quarrying, & Extraction (100.0%), Wholesale Trade (100.0%), and Transportation & Warehousing (100.0%), whereas the industries that tend to have a higher number of women are Professional & Scientific (100.0%), Enterprise Management (100.0%), and Accommodation & Food Services (100.0%).
| Industry | Male | Female |
| Agriculture, Fishing & Hunting | 36 (76.6%) | 11 (23.4%) |
| Mining, Quarrying, & Extraction | 1 (100.0%) | 0 (0.0%) |
| Construction | 77 (92.8%) | 6 (7.2%) |
| Manufacturing | 19 (47.5%) | 21 (52.5%) |
| Wholesale Trade | 6 (100.0%) | 0 (0.0%) |
| Retail Trade | 37 (61.7%) | 23 (38.3%) |
| Transportation & Warehousing | 10 (100.0%) | 0 (0.0%) |
| Utilities | 2 (100.0%) | 0 (0.0%) |
| Information | 2 (100.0%) | 0 (0.0%) |
| Finance & Insurance | 7 (30.4%) | 16 (69.6%) |
| Real Estate, Rental & Leasing | 0 (0.0%) | 0 (0.0%) |
| Professional & Scientific | 0 (0.0%) | 35 (100.0%) |
| Enterprise Management | 0 (0.0%) | 7 (100.0%) |
| Administrative & Support | 24 (92.3%) | 2 (7.7%) |
| Educational Services | 9 (19.2%) | 38 (80.8%) |
| Health Care & Social Assistance | 8 (24.2%) | 25 (75.8%) |
| Arts, Entertainment & Recreation | 2 (50.0%) | 2 (50.0%) |
| Accommodation & Food Services | 0 (0.0%) | 15 (100.0%) |
| Public Administration | 6 (54.5%) | 5 (45.5%) |
| Total | 246 (54.3%) | 207 (45.7%) |
Education in Goshen
School Enrollment in Goshen
The most common levels of schooling among the 247 students in Goshen are middle school (87 | 35.2%), high school (55 | 22.3%), and elementary school (46 | 18.6%).
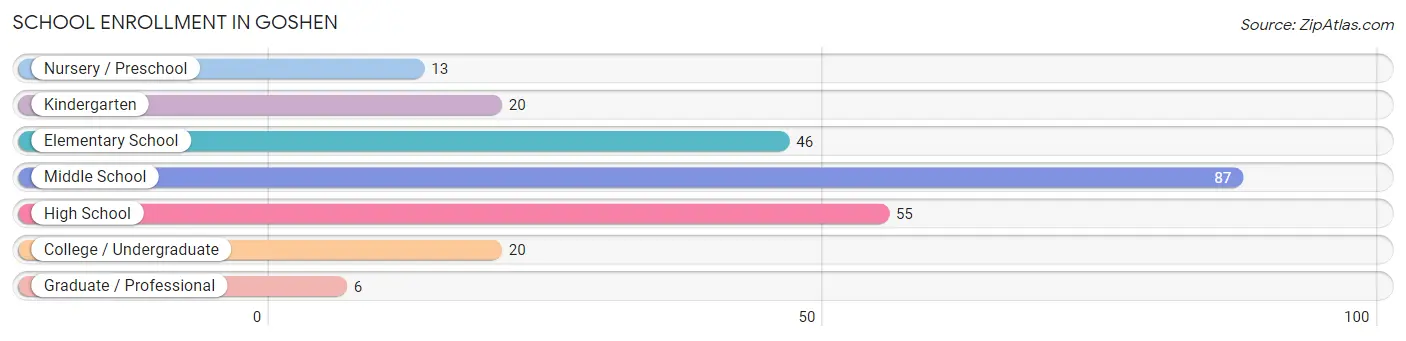
| School Level | # Students | % Students |
| Nursery / Preschool | 13 | 5.3% |
| Kindergarten | 20 | 8.1% |
| Elementary School | 46 | 18.6% |
| Middle School | 87 | 35.2% |
| High School | 55 | 22.3% |
| College / Undergraduate | 20 | 8.1% |
| Graduate / Professional | 6 | 2.4% |
| Total | 247 | 100.0% |
School Enrollment by Age by Funding Source in Goshen
Out of a total of 247 students who are enrolled in schools in Goshen, 28 (11.3%) attend a private institution, while the remaining 219 (88.7%) are enrolled in public schools. The age group of 35 years and over has the highest likelihood of being enrolled in private schools, with 6 (60.0% in the age bracket) enrolled. Conversely, the age group of 3 to 4 year olds has the lowest likelihood of being enrolled in a private school, with 21 (100.0% in the age bracket) attending a public institution.
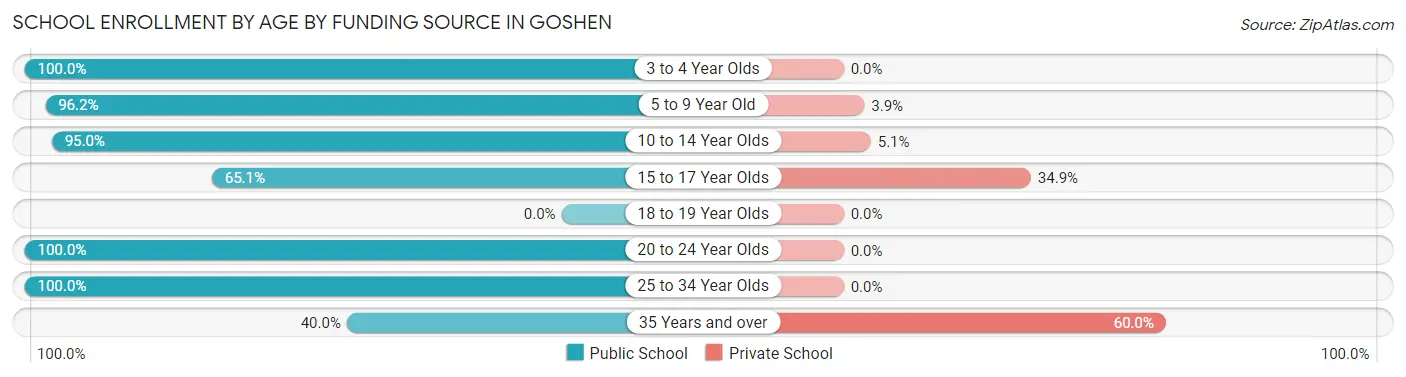
| Age Bracket | Public School | Private School |
| 3 to 4 Year Olds | 21 (100.0%) | 0 (0.0%) |
| 5 to 9 Year Old | 50 (96.2%) | 2 (3.8%) |
| 10 to 14 Year Olds | 94 (95.0%) | 5 (5.1%) |
| 15 to 17 Year Olds | 28 (65.1%) | 15 (34.9%) |
| 18 to 19 Year Olds | 0 (0.0%) | 0 (0.0%) |
| 20 to 24 Year Olds | 2 (100.0%) | 0 (0.0%) |
| 25 to 34 Year Olds | 20 (100.0%) | 0 (0.0%) |
| 35 Years and over | 4 (40.0%) | 6 (60.0%) |
| Total | 219 (88.7%) | 28 (11.3%) |
Educational Attainment by Field of Study in Goshen
Bio, nature & agricultural (24 | 33.3%), science & technology (22 | 30.6%), education (11 | 15.3%), business (7 | 9.7%), and computers & mathematics (2 | 2.8%) are the most common fields of study among 72 individuals in Goshen who have obtained a bachelor's degree or higher.
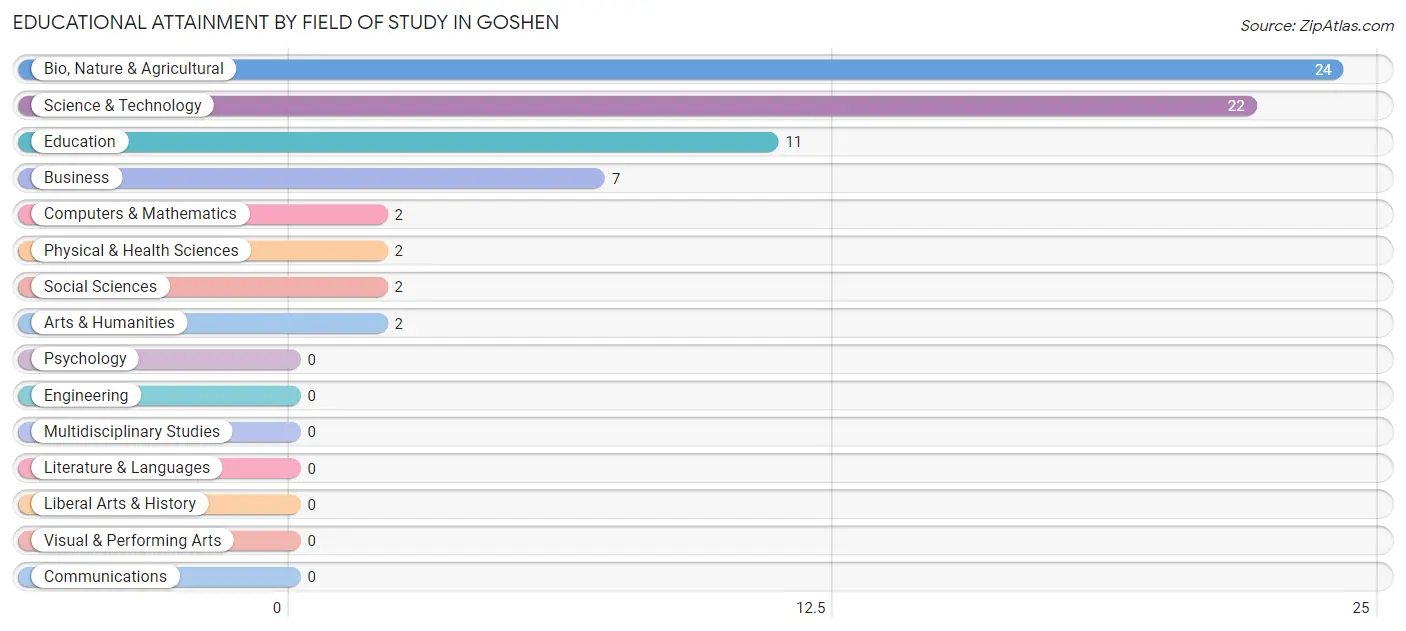
| Field of Study | # Graduates | % Graduates |
| Computers & Mathematics | 2 | 2.8% |
| Bio, Nature & Agricultural | 24 | 33.3% |
| Physical & Health Sciences | 2 | 2.8% |
| Psychology | 0 | 0.0% |
| Social Sciences | 2 | 2.8% |
| Engineering | 0 | 0.0% |
| Multidisciplinary Studies | 0 | 0.0% |
| Science & Technology | 22 | 30.6% |
| Business | 7 | 9.7% |
| Education | 11 | 15.3% |
| Literature & Languages | 0 | 0.0% |
| Liberal Arts & History | 0 | 0.0% |
| Visual & Performing Arts | 0 | 0.0% |
| Communications | 0 | 0.0% |
| Arts & Humanities | 2 | 2.8% |
| Total | 72 | 100.0% |
Transportation & Commute in Goshen
Vehicle Availability by Sex in Goshen
The most prevalent vehicle ownership categories in Goshen are males with 3 vehicles (93, accounting for 37.8%) and females with 3 vehicles (107, making up 44.9%).
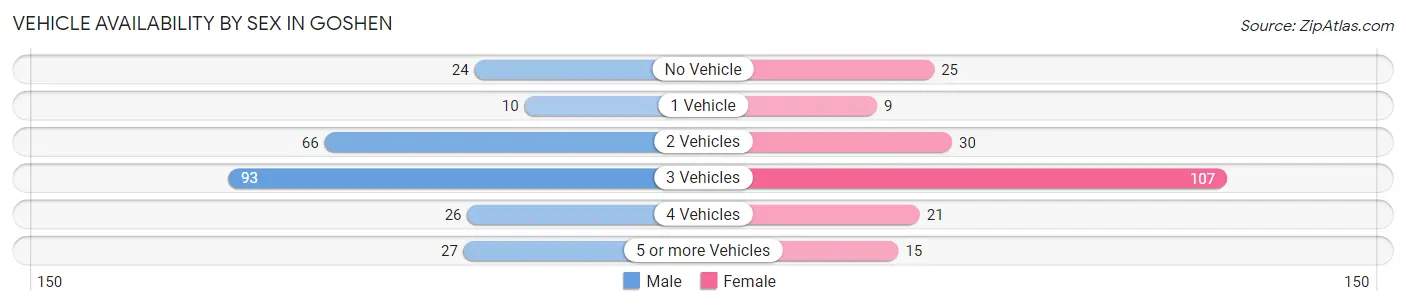
| Vehicles Available | Male | Female |
| No Vehicle | 24 (9.8%) | 25 (12.1%) |
| 1 Vehicle | 10 (4.1%) | 9 (4.3%) |
| 2 Vehicles | 66 (26.8%) | 30 (14.5%) |
| 3 Vehicles | 93 (37.8%) | 107 (51.7%) |
| 4 Vehicles | 26 (10.6%) | 21 (10.1%) |
| 5 or more Vehicles | 27 (11.0%) | 15 (7.2%) |
| Total | 246 (100.0%) | 207 (100.0%) |
Commute Time in Goshen
The most frequently occuring commute durations in Goshen are 30 to 34 minutes (114 commuters, 26.6%), 45 to 59 minutes (81 commuters, 18.9%), and 25 to 29 minutes (49 commuters, 11.5%).
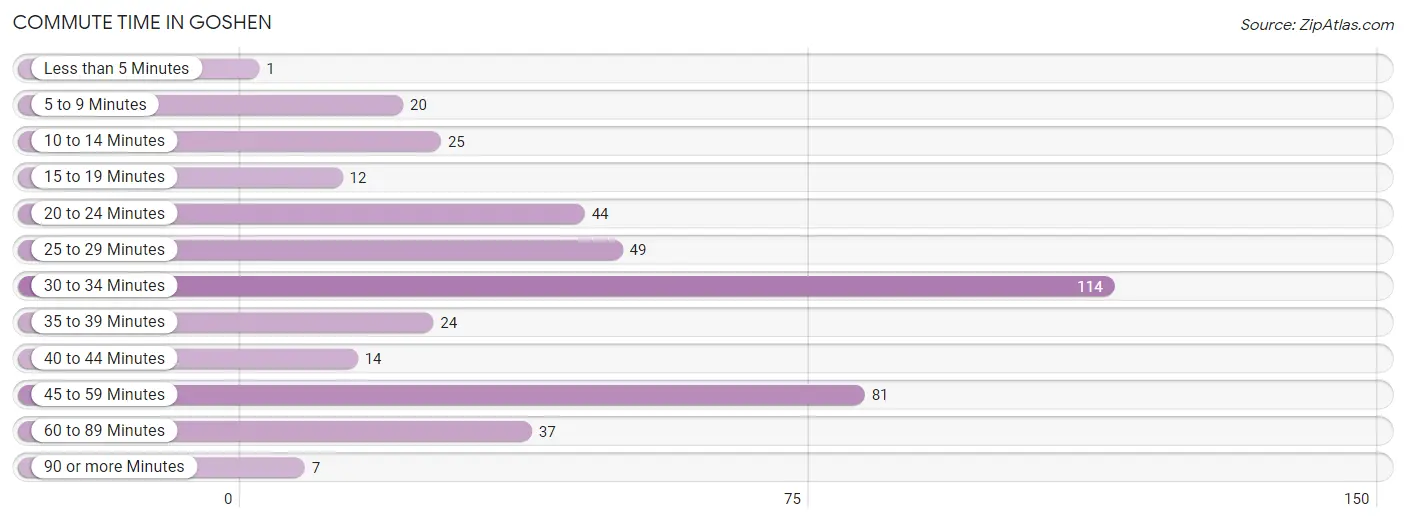
| Commute Time | # Commuters | % Commuters |
| Less than 5 Minutes | 1 | 0.2% |
| 5 to 9 Minutes | 20 | 4.7% |
| 10 to 14 Minutes | 25 | 5.8% |
| 15 to 19 Minutes | 12 | 2.8% |
| 20 to 24 Minutes | 44 | 10.3% |
| 25 to 29 Minutes | 49 | 11.5% |
| 30 to 34 Minutes | 114 | 26.6% |
| 35 to 39 Minutes | 24 | 5.6% |
| 40 to 44 Minutes | 14 | 3.3% |
| 45 to 59 Minutes | 81 | 18.9% |
| 60 to 89 Minutes | 37 | 8.6% |
| 90 or more Minutes | 7 | 1.6% |
Commute Time by Sex in Goshen
The most common commute times in Goshen are 30 to 34 minutes (64 commuters, 27.0%) for males and 45 to 59 minutes (52 commuters, 27.2%) for females.
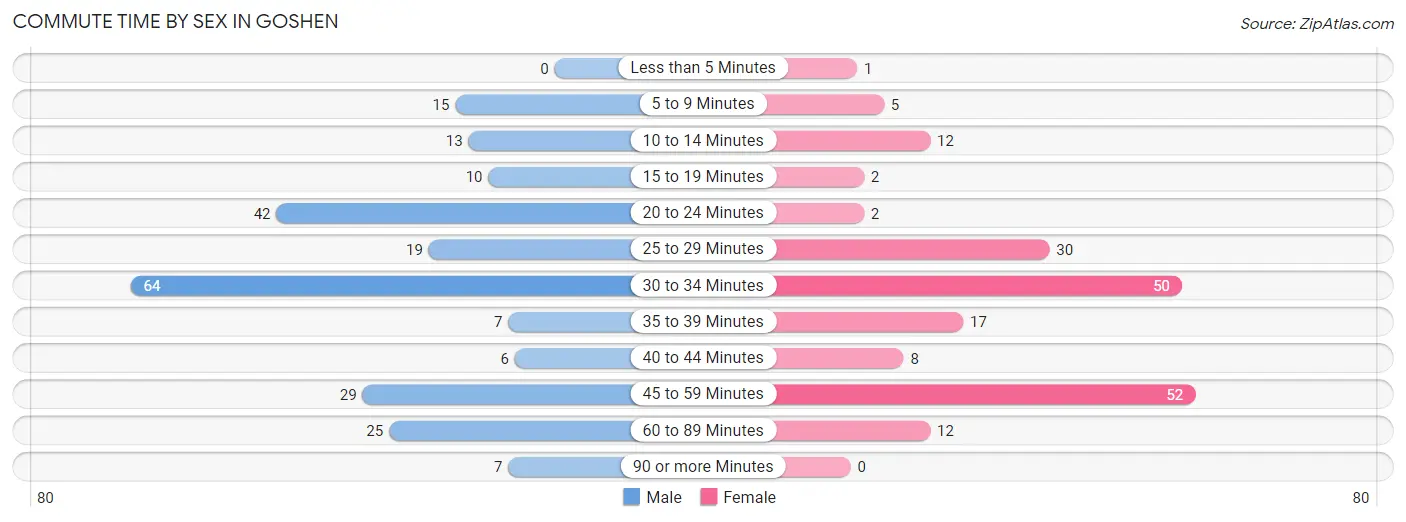
| Commute Time | Male | Female |
| Less than 5 Minutes | 0 (0.0%) | 1 (0.5%) |
| 5 to 9 Minutes | 15 (6.3%) | 5 (2.6%) |
| 10 to 14 Minutes | 13 (5.5%) | 12 (6.3%) |
| 15 to 19 Minutes | 10 (4.2%) | 2 (1.1%) |
| 20 to 24 Minutes | 42 (17.7%) | 2 (1.1%) |
| 25 to 29 Minutes | 19 (8.0%) | 30 (15.7%) |
| 30 to 34 Minutes | 64 (27.0%) | 50 (26.2%) |
| 35 to 39 Minutes | 7 (2.9%) | 17 (8.9%) |
| 40 to 44 Minutes | 6 (2.5%) | 8 (4.2%) |
| 45 to 59 Minutes | 29 (12.2%) | 52 (27.2%) |
| 60 to 89 Minutes | 25 (10.5%) | 12 (6.3%) |
| 90 or more Minutes | 7 (2.9%) | 0 (0.0%) |
Time of Departure to Work by Sex in Goshen
The most frequent times of departure to work in Goshen are 12:00 AM to 4:59 AM (50, 21.1%) for males and 6:30 AM to 6:59 AM (41, 21.5%) for females.
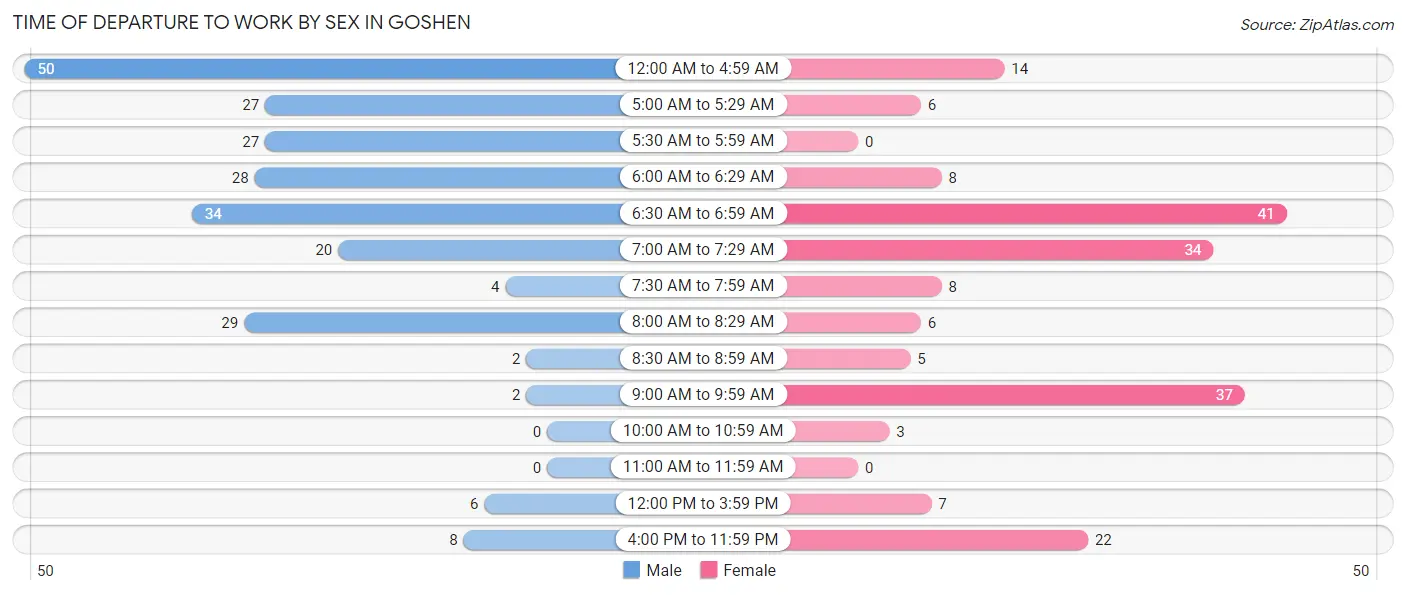
| Time of Departure | Male | Female |
| 12:00 AM to 4:59 AM | 50 (21.1%) | 14 (7.3%) |
| 5:00 AM to 5:29 AM | 27 (11.4%) | 6 (3.1%) |
| 5:30 AM to 5:59 AM | 27 (11.4%) | 0 (0.0%) |
| 6:00 AM to 6:29 AM | 28 (11.8%) | 8 (4.2%) |
| 6:30 AM to 6:59 AM | 34 (14.3%) | 41 (21.5%) |
| 7:00 AM to 7:29 AM | 20 (8.4%) | 34 (17.8%) |
| 7:30 AM to 7:59 AM | 4 (1.7%) | 8 (4.2%) |
| 8:00 AM to 8:29 AM | 29 (12.2%) | 6 (3.1%) |
| 8:30 AM to 8:59 AM | 2 (0.8%) | 5 (2.6%) |
| 9:00 AM to 9:59 AM | 2 (0.8%) | 37 (19.4%) |
| 10:00 AM to 10:59 AM | 0 (0.0%) | 3 (1.6%) |
| 11:00 AM to 11:59 AM | 0 (0.0%) | 0 (0.0%) |
| 12:00 PM to 3:59 PM | 6 (2.5%) | 7 (3.7%) |
| 4:00 PM to 11:59 PM | 8 (3.4%) | 22 (11.5%) |
| Total | 237 (100.0%) | 191 (100.0%) |
Housing Occupancy in Goshen
Occupancy by Ownership in Goshen
Of the total 285 dwellings in Goshen, owner-occupied units account for 208 (73.0%), while renter-occupied units make up 77 (27.0%).
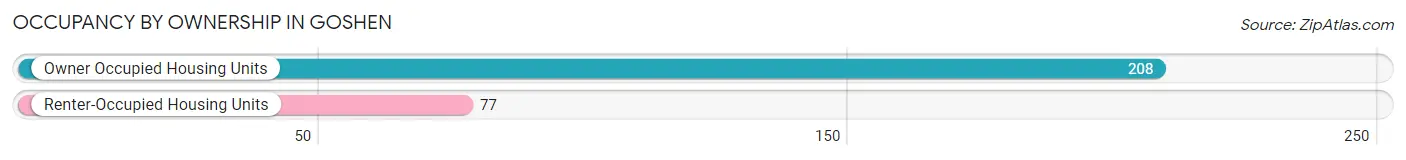
| Occupancy | # Housing Units | % Housing Units |
| Owner Occupied Housing Units | 208 | 73.0% |
| Renter-Occupied Housing Units | 77 | 27.0% |
| Total Occupied Housing Units | 285 | 100.0% |
Occupancy by Household Size in Goshen
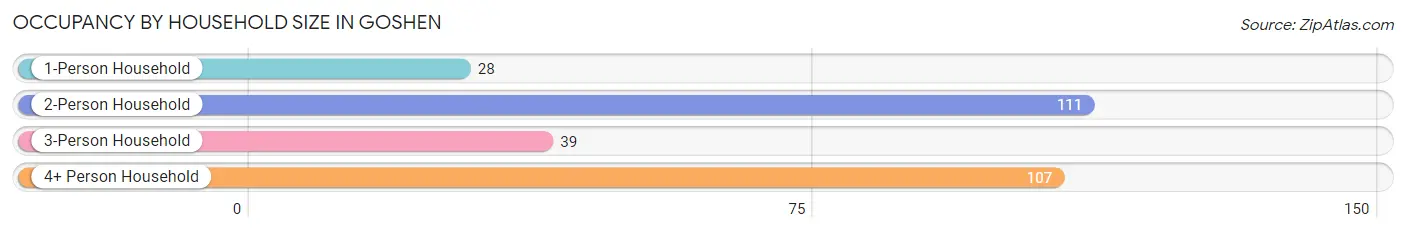
| Household Size | # Housing Units | % Housing Units |
| 1-Person Household | 28 | 9.8% |
| 2-Person Household | 111 | 39.0% |
| 3-Person Household | 39 | 13.7% |
| 4+ Person Household | 107 | 37.5% |
| Total Housing Units | 285 | 100.0% |
Occupancy by Ownership by Household Size in Goshen
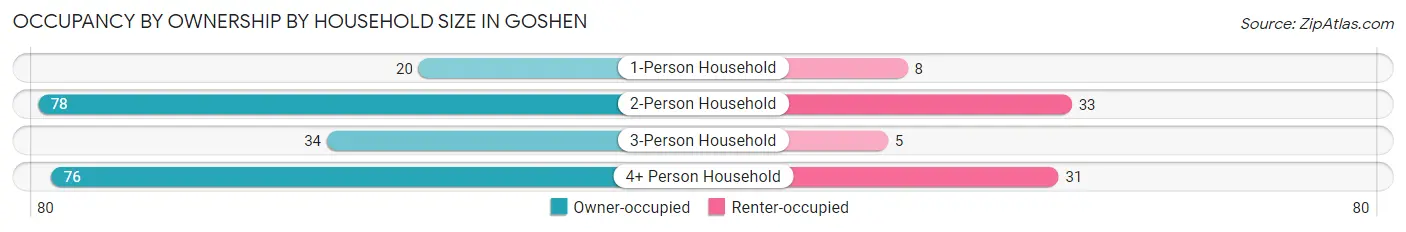
| Household Size | Owner-occupied | Renter-occupied |
| 1-Person Household | 20 (71.4%) | 8 (28.6%) |
| 2-Person Household | 78 (70.3%) | 33 (29.7%) |
| 3-Person Household | 34 (87.2%) | 5 (12.8%) |
| 4+ Person Household | 76 (71.0%) | 31 (29.0%) |
| Total Housing Units | 208 (73.0%) | 77 (27.0%) |
Occupancy by Educational Attainment in Goshen
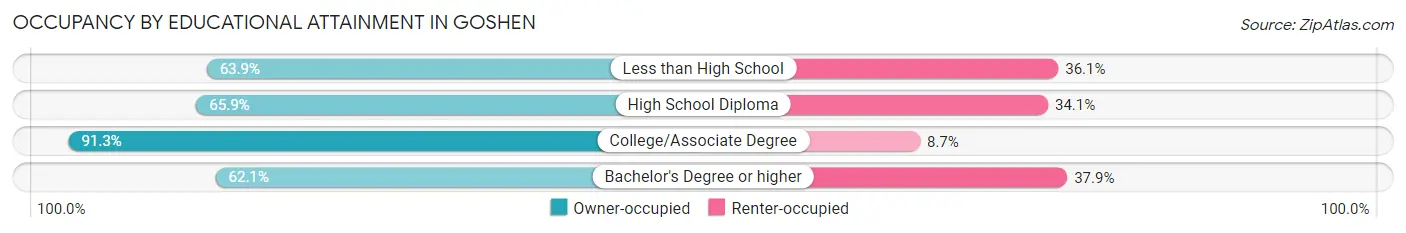
| Household Size | Owner-occupied | Renter-occupied |
| Less than High School | 23 (63.9%) | 13 (36.1%) |
| High School Diploma | 60 (65.9%) | 31 (34.1%) |
| College/Associate Degree | 84 (91.3%) | 8 (8.7%) |
| Bachelor's Degree or higher | 41 (62.1%) | 25 (37.9%) |
Occupancy by Age of Householder in Goshen
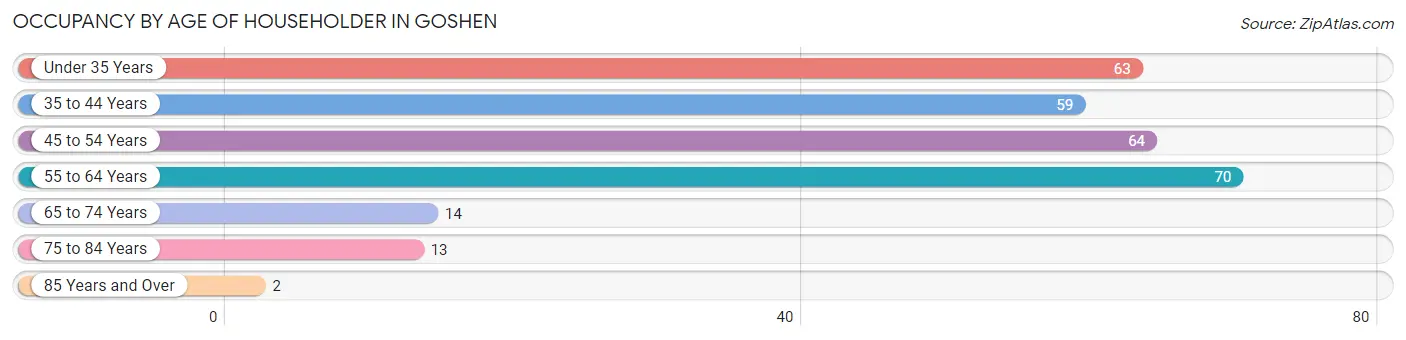
| Age Bracket | # Households | % Households |
| Under 35 Years | 63 | 22.1% |
| 35 to 44 Years | 59 | 20.7% |
| 45 to 54 Years | 64 | 22.5% |
| 55 to 64 Years | 70 | 24.6% |
| 65 to 74 Years | 14 | 4.9% |
| 75 to 84 Years | 13 | 4.6% |
| 85 Years and Over | 2 | 0.7% |
| Total | 285 | 100.0% |
Housing Finances in Goshen
Median Income by Occupancy in Goshen
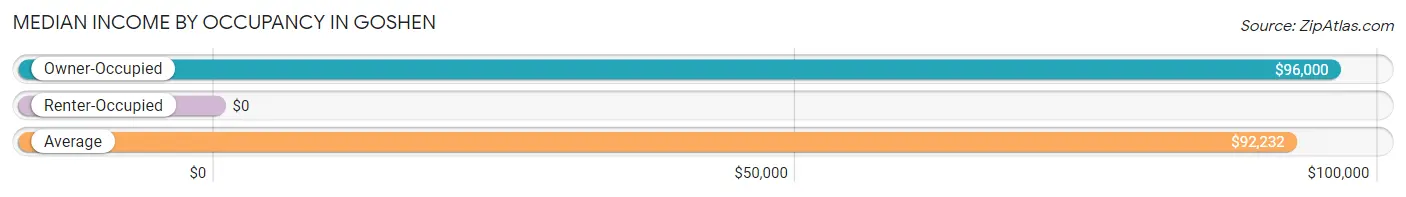
| Occupancy Type | # Households | Median Income |
| Owner-Occupied | 208 (73.0%) | $96,000 |
| Renter-Occupied | 77 (27.0%) | $0 |
| Average | 285 (100.0%) | $92,232 |
Occupancy by Householder Income Bracket in Goshen
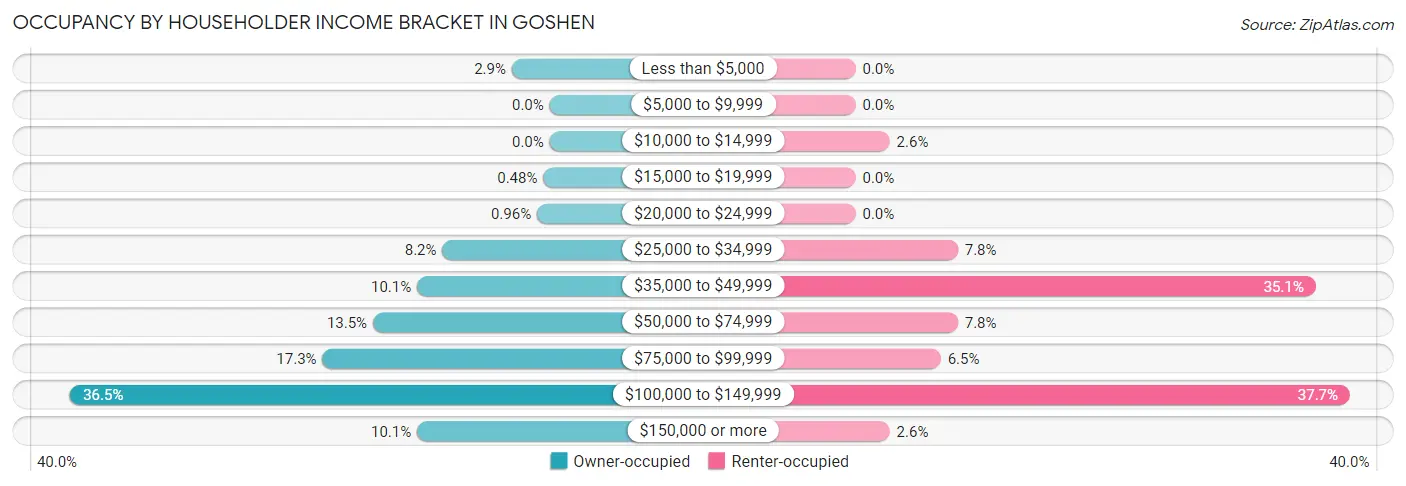
| Income Bracket | Owner-occupied | Renter-occupied |
| Less than $5,000 | 6 (2.9%) | 0 (0.0%) |
| $5,000 to $9,999 | 0 (0.0%) | 0 (0.0%) |
| $10,000 to $14,999 | 0 (0.0%) | 2 (2.6%) |
| $15,000 to $19,999 | 1 (0.5%) | 0 (0.0%) |
| $20,000 to $24,999 | 2 (1.0%) | 0 (0.0%) |
| $25,000 to $34,999 | 17 (8.2%) | 6 (7.8%) |
| $35,000 to $49,999 | 21 (10.1%) | 27 (35.1%) |
| $50,000 to $74,999 | 28 (13.5%) | 6 (7.8%) |
| $75,000 to $99,999 | 36 (17.3%) | 5 (6.5%) |
| $100,000 to $149,999 | 76 (36.5%) | 29 (37.7%) |
| $150,000 or more | 21 (10.1%) | 2 (2.6%) |
| Total | 208 (100.0%) | 77 (100.0%) |
Monthly Housing Cost Tiers in Goshen
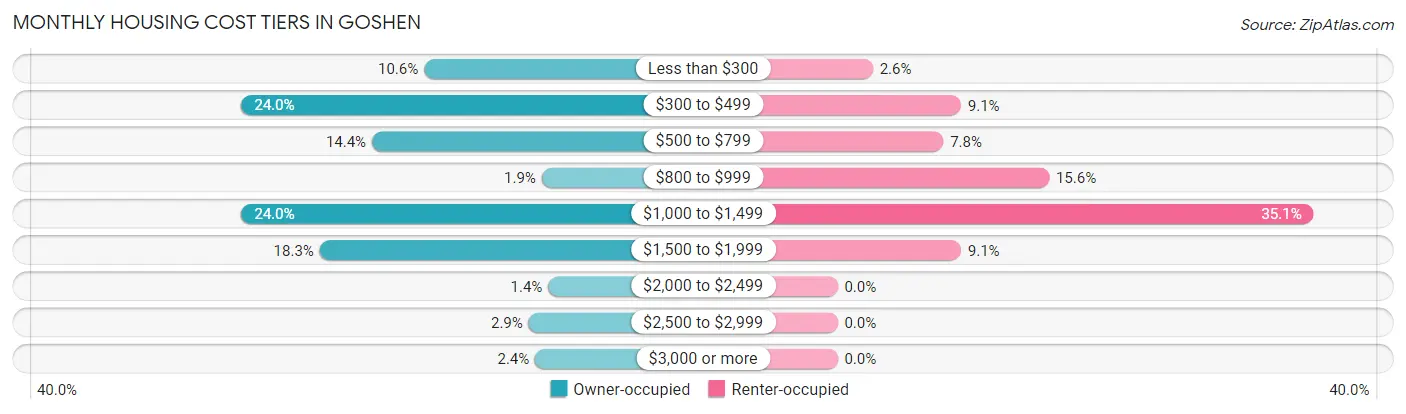
| Monthly Cost | Owner-occupied | Renter-occupied |
| Less than $300 | 22 (10.6%) | 2 (2.6%) |
| $300 to $499 | 50 (24.0%) | 7 (9.1%) |
| $500 to $799 | 30 (14.4%) | 6 (7.8%) |
| $800 to $999 | 4 (1.9%) | 12 (15.6%) |
| $1,000 to $1,499 | 50 (24.0%) | 27 (35.1%) |
| $1,500 to $1,999 | 38 (18.3%) | 7 (9.1%) |
| $2,000 to $2,499 | 3 (1.4%) | 0 (0.0%) |
| $2,500 to $2,999 | 6 (2.9%) | 0 (0.0%) |
| $3,000 or more | 5 (2.4%) | 0 (0.0%) |
| Total | 208 (100.0%) | 77 (100.0%) |
Physical Housing Characteristics in Goshen
Housing Structures in Goshen
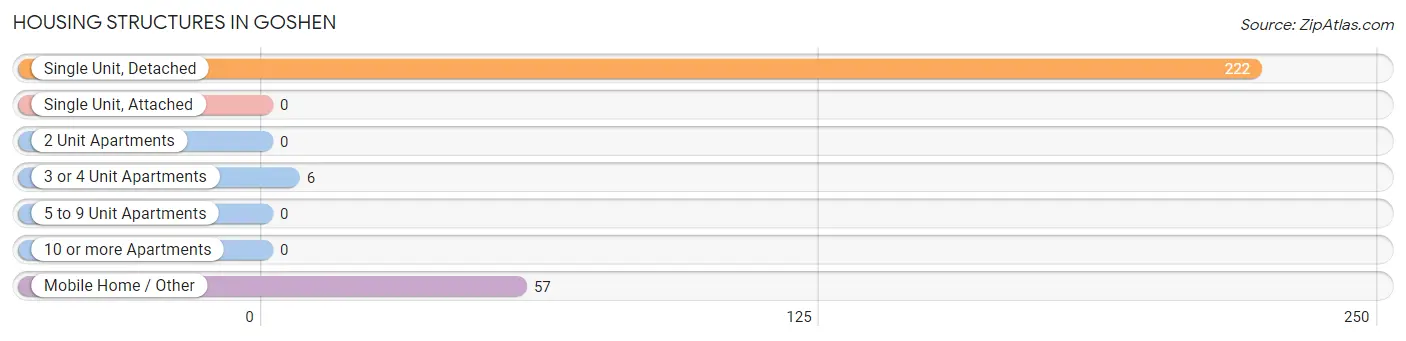
| Structure Type | # Housing Units | % Housing Units |
| Single Unit, Detached | 222 | 77.9% |
| Single Unit, Attached | 0 | 0.0% |
| 2 Unit Apartments | 0 | 0.0% |
| 3 or 4 Unit Apartments | 6 | 2.1% |
| 5 to 9 Unit Apartments | 0 | 0.0% |
| 10 or more Apartments | 0 | 0.0% |
| Mobile Home / Other | 57 | 20.0% |
| Total | 285 | 100.0% |
Housing Structures by Occupancy in Goshen
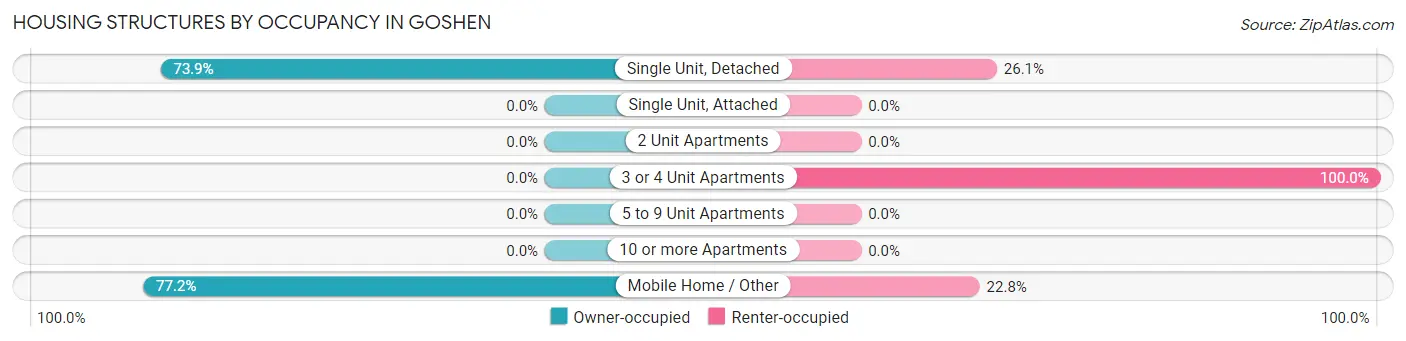
| Structure Type | Owner-occupied | Renter-occupied |
| Single Unit, Detached | 164 (73.9%) | 58 (26.1%) |
| Single Unit, Attached | 0 (0.0%) | 0 (0.0%) |
| 2 Unit Apartments | 0 (0.0%) | 0 (0.0%) |
| 3 or 4 Unit Apartments | 0 (0.0%) | 6 (100.0%) |
| 5 to 9 Unit Apartments | 0 (0.0%) | 0 (0.0%) |
| 10 or more Apartments | 0 (0.0%) | 0 (0.0%) |
| Mobile Home / Other | 44 (77.2%) | 13 (22.8%) |
| Total | 208 (73.0%) | 77 (27.0%) |
Housing Structures by Number of Rooms in Goshen
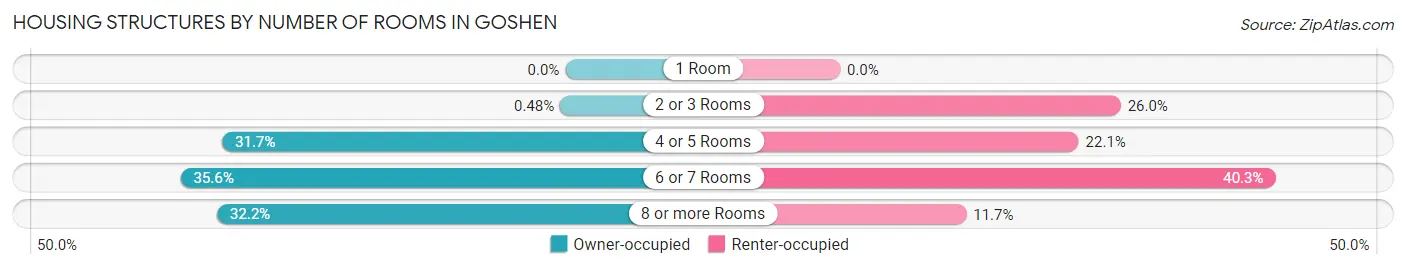
| Number of Rooms | Owner-occupied | Renter-occupied |
| 1 Room | 0 (0.0%) | 0 (0.0%) |
| 2 or 3 Rooms | 1 (0.5%) | 20 (26.0%) |
| 4 or 5 Rooms | 66 (31.7%) | 17 (22.1%) |
| 6 or 7 Rooms | 74 (35.6%) | 31 (40.3%) |
| 8 or more Rooms | 67 (32.2%) | 9 (11.7%) |
| Total | 208 (100.0%) | 77 (100.0%) |
Housing Structure by Heating Type in Goshen
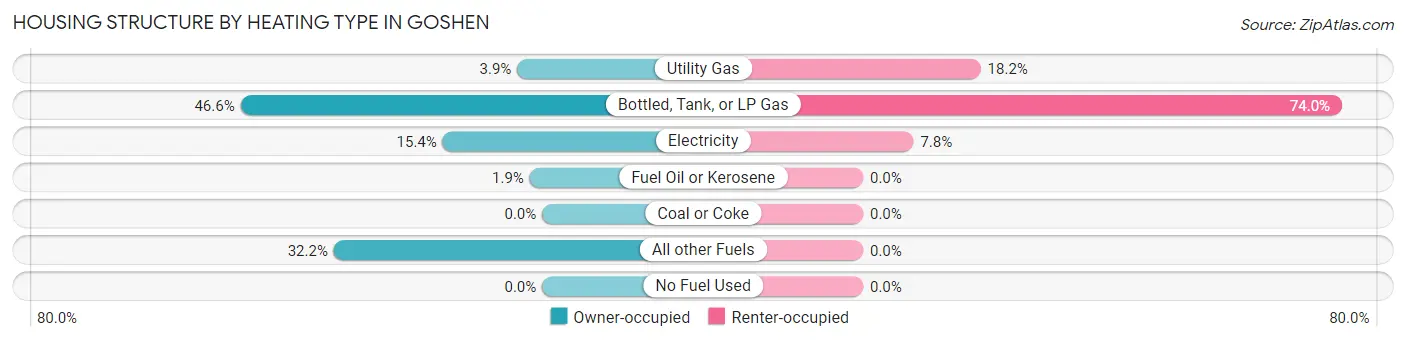
| Heating Type | Owner-occupied | Renter-occupied |
| Utility Gas | 8 (3.8%) | 14 (18.2%) |
| Bottled, Tank, or LP Gas | 97 (46.6%) | 57 (74.0%) |
| Electricity | 32 (15.4%) | 6 (7.8%) |
| Fuel Oil or Kerosene | 4 (1.9%) | 0 (0.0%) |
| Coal or Coke | 0 (0.0%) | 0 (0.0%) |
| All other Fuels | 67 (32.2%) | 0 (0.0%) |
| No Fuel Used | 0 (0.0%) | 0 (0.0%) |
| Total | 208 (100.0%) | 77 (100.0%) |
Household Vehicle Usage in Goshen
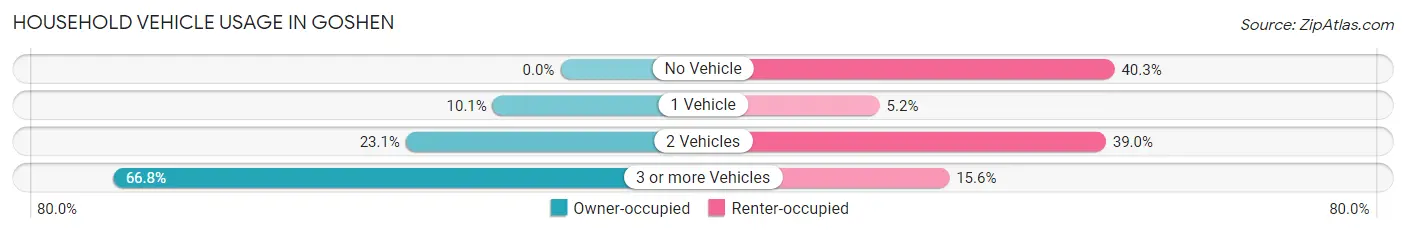
| Vehicles per Household | Owner-occupied | Renter-occupied |
| No Vehicle | 0 (0.0%) | 31 (40.3%) |
| 1 Vehicle | 21 (10.1%) | 4 (5.2%) |
| 2 Vehicles | 48 (23.1%) | 30 (39.0%) |
| 3 or more Vehicles | 139 (66.8%) | 12 (15.6%) |
| Total | 208 (100.0%) | 77 (100.0%) |
Real Estate & Mortgages in Goshen
Real Estate and Mortgage Overview in Goshen
| Characteristic | Without Mortgage | With Mortgage |
| Housing Units | 111 | 97 |
| Median Property Value | $218,500 | $247,900 |
| Median Household Income | $108,456 | $13 |
| Monthly Housing Costs | $425 | $5 |
| Real Estate Taxes | $885 | $8 |
Property Value by Mortgage Status in Goshen
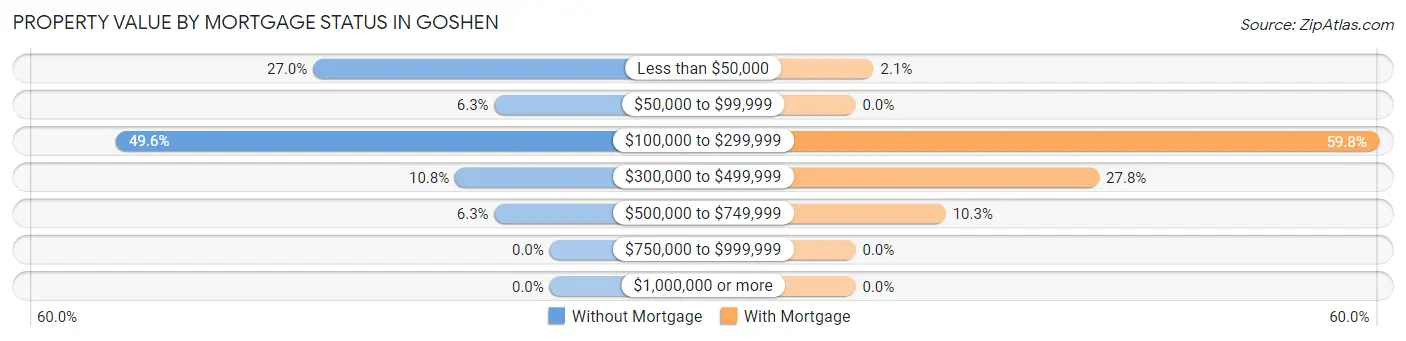
| Property Value | Without Mortgage | With Mortgage |
| Less than $50,000 | 30 (27.0%) | 2 (2.1%) |
| $50,000 to $99,999 | 7 (6.3%) | 0 (0.0%) |
| $100,000 to $299,999 | 55 (49.5%) | 58 (59.8%) |
| $300,000 to $499,999 | 12 (10.8%) | 27 (27.8%) |
| $500,000 to $749,999 | 7 (6.3%) | 10 (10.3%) |
| $750,000 to $999,999 | 0 (0.0%) | 0 (0.0%) |
| $1,000,000 or more | 0 (0.0%) | 0 (0.0%) |
| Total | 111 (100.0%) | 97 (100.0%) |
Household Income by Mortgage Status in Goshen
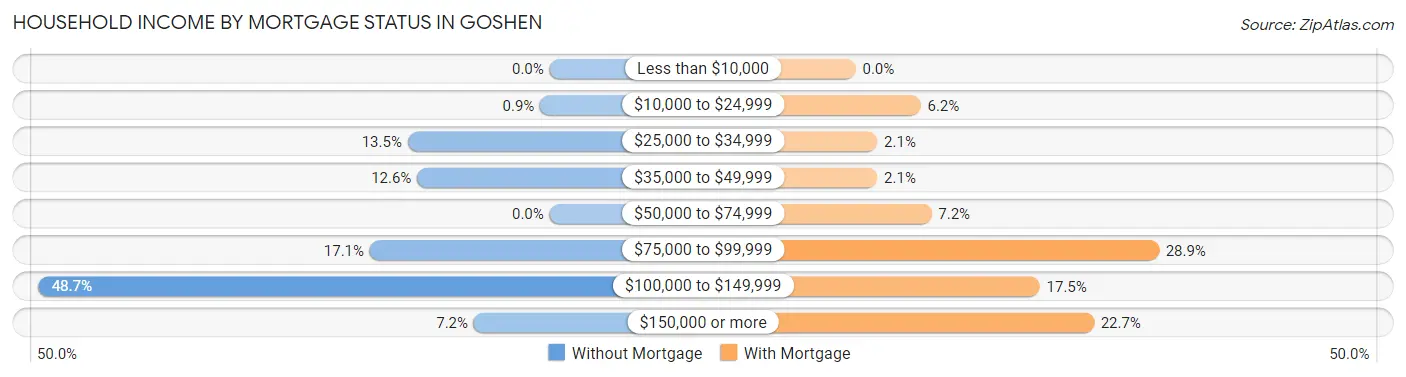
| Household Income | Without Mortgage | With Mortgage |
| Less than $10,000 | 0 (0.0%) | 0 (0.0%) |
| $10,000 to $24,999 | 1 (0.9%) | 6 (6.2%) |
| $25,000 to $34,999 | 15 (13.5%) | 2 (2.1%) |
| $35,000 to $49,999 | 14 (12.6%) | 2 (2.1%) |
| $50,000 to $74,999 | 0 (0.0%) | 7 (7.2%) |
| $75,000 to $99,999 | 19 (17.1%) | 28 (28.9%) |
| $100,000 to $149,999 | 54 (48.6%) | 17 (17.5%) |
| $150,000 or more | 8 (7.2%) | 22 (22.7%) |
| Total | 111 (100.0%) | 97 (100.0%) |
Property Value to Household Income Ratio in Goshen
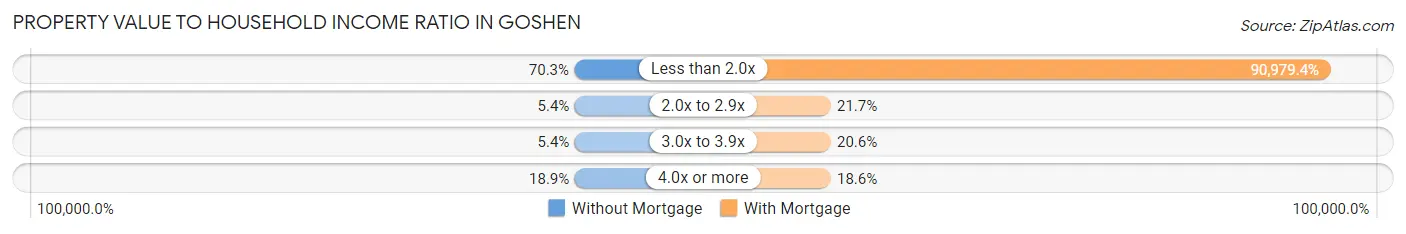
| Value-to-Income Ratio | Without Mortgage | With Mortgage |
| Less than 2.0x | 78 (70.3%) | 88,250 (90,979.4%) |
| 2.0x to 2.9x | 6 (5.4%) | 21 (21.6%) |
| 3.0x to 3.9x | 6 (5.4%) | 20 (20.6%) |
| 4.0x or more | 21 (18.9%) | 18 (18.6%) |
| Total | 111 (100.0%) | 97 (100.0%) |
Real Estate Taxes by Mortgage Status in Goshen
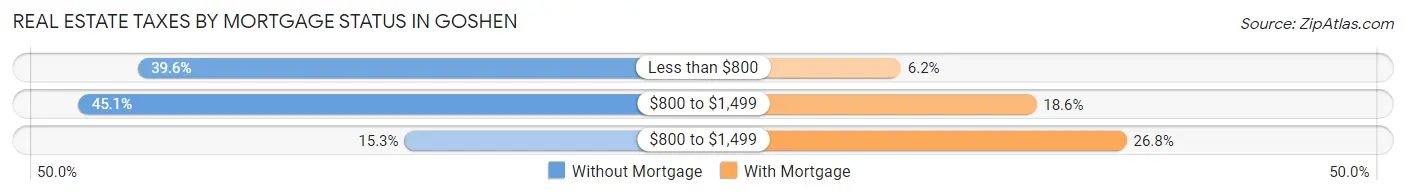
| Property Taxes | Without Mortgage | With Mortgage |
| Less than $800 | 44 (39.6%) | 6 (6.2%) |
| $800 to $1,499 | 50 (45.1%) | 18 (18.6%) |
| $800 to $1,499 | 17 (15.3%) | 26 (26.8%) |
| Total | 111 (100.0%) | 97 (100.0%) |
Health & Disability in Goshen
Health Insurance Coverage by Age in Goshen
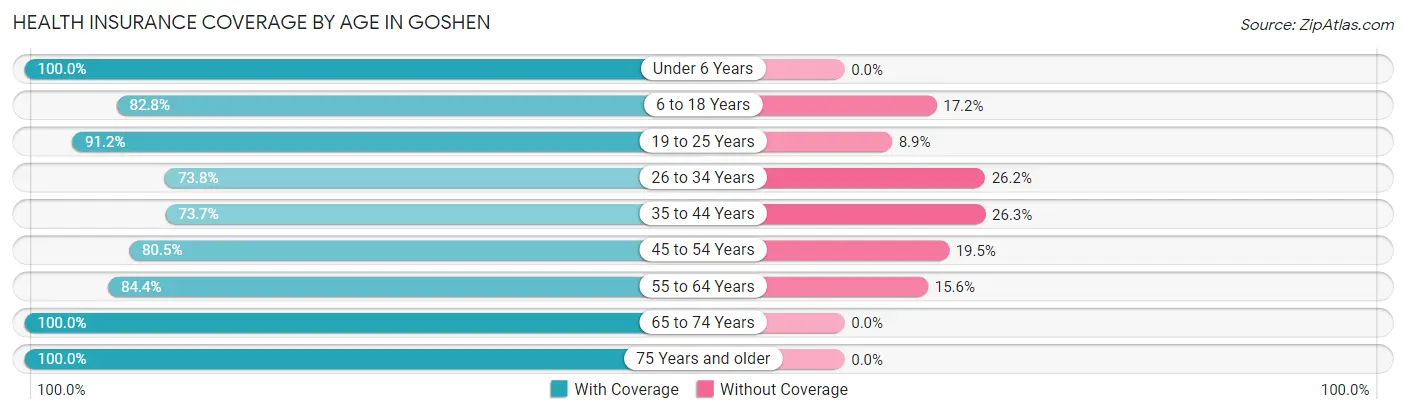
| Age Bracket | With Coverage | Without Coverage |
| Under 6 Years | 85 (100.0%) | 0 (0.0%) |
| 6 to 18 Years | 169 (82.8%) | 35 (17.2%) |
| 19 to 25 Years | 103 (91.1%) | 10 (8.8%) |
| 26 to 34 Years | 62 (73.8%) | 22 (26.2%) |
| 35 to 44 Years | 73 (73.7%) | 26 (26.3%) |
| 45 to 54 Years | 91 (80.5%) | 22 (19.5%) |
| 55 to 64 Years | 103 (84.4%) | 19 (15.6%) |
| 65 to 74 Years | 22 (100.0%) | 0 (0.0%) |
| 75 Years and older | 23 (100.0%) | 0 (0.0%) |
| Total | 731 (84.5%) | 134 (15.5%) |
Health Insurance Coverage by Citizenship Status in Goshen
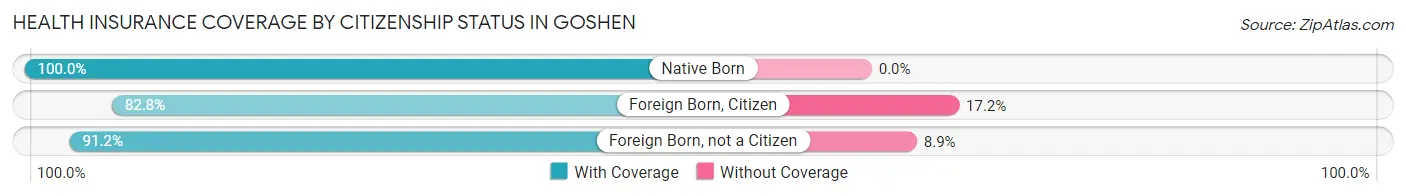
| Citizenship Status | With Coverage | Without Coverage |
| Native Born | 85 (100.0%) | 0 (0.0%) |
| Foreign Born, Citizen | 169 (82.8%) | 35 (17.2%) |
| Foreign Born, not a Citizen | 103 (91.1%) | 10 (8.8%) |
Health Insurance Coverage by Household Income in Goshen
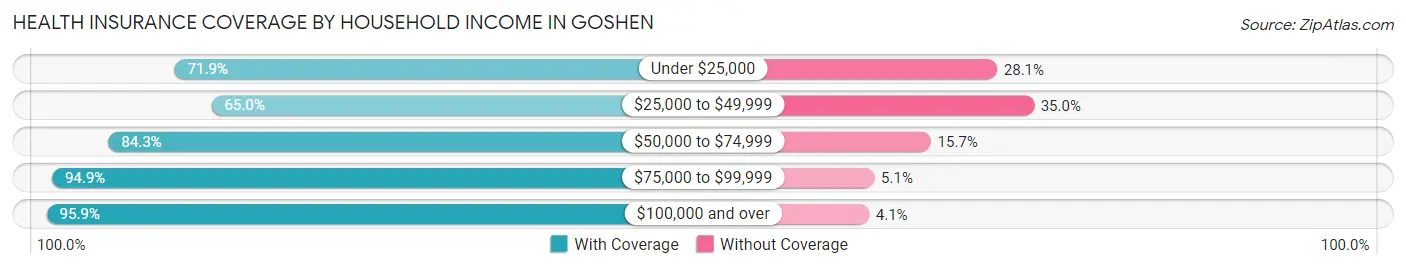
| Household Income | With Coverage | Without Coverage |
| Under $25,000 | 23 (71.9%) | 9 (28.1%) |
| $25,000 to $49,999 | 154 (65.0%) | 83 (35.0%) |
| $50,000 to $74,999 | 118 (84.3%) | 22 (15.7%) |
| $75,000 to $99,999 | 111 (94.9%) | 6 (5.1%) |
| $100,000 and over | 325 (95.9%) | 14 (4.1%) |
Public vs Private Health Insurance Coverage by Age in Goshen
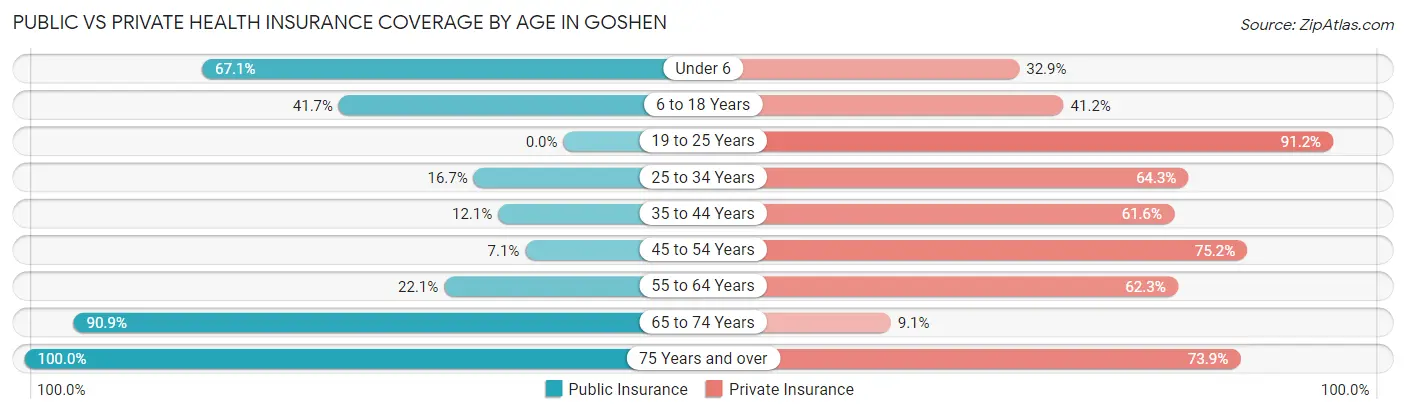
| Age Bracket | Public Insurance | Private Insurance |
| Under 6 | 57 (67.1%) | 28 (32.9%) |
| 6 to 18 Years | 85 (41.7%) | 84 (41.2%) |
| 19 to 25 Years | 0 (0.0%) | 103 (91.1%) |
| 25 to 34 Years | 14 (16.7%) | 54 (64.3%) |
| 35 to 44 Years | 12 (12.1%) | 61 (61.6%) |
| 45 to 54 Years | 8 (7.1%) | 85 (75.2%) |
| 55 to 64 Years | 27 (22.1%) | 76 (62.3%) |
| 65 to 74 Years | 20 (90.9%) | 2 (9.1%) |
| 75 Years and over | 23 (100.0%) | 17 (73.9%) |
| Total | 246 (28.4%) | 510 (59.0%) |
Disability Status by Sex by Age in Goshen
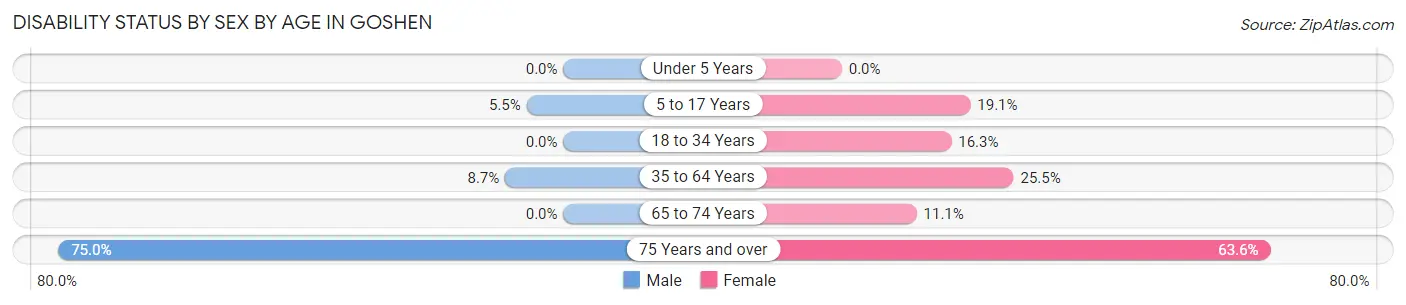
| Age Bracket | Male | Female |
| Under 5 Years | 0 (0.0%) | 0 (0.0%) |
| 5 to 17 Years | 6 (5.4%) | 21 (19.1%) |
| 18 to 34 Years | 0 (0.0%) | 20 (16.3%) |
| 35 to 64 Years | 16 (8.6%) | 38 (25.5%) |
| 65 to 74 Years | 0 (0.0%) | 2 (11.1%) |
| 75 Years and over | 9 (75.0%) | 7 (63.6%) |
Disability Class by Sex by Age in Goshen
Disability Class: Hearing Difficulty
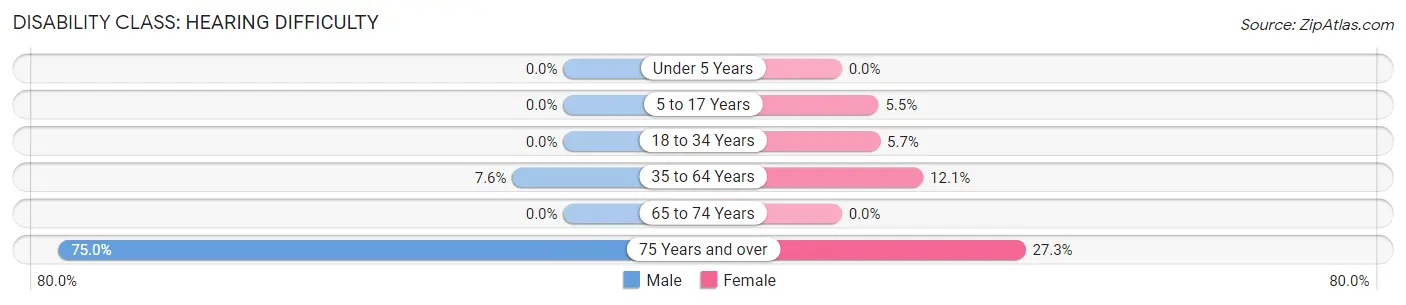
| Age Bracket | Male | Female |
| Under 5 Years | 0 (0.0%) | 0 (0.0%) |
| 5 to 17 Years | 0 (0.0%) | 6 (5.4%) |
| 18 to 34 Years | 0 (0.0%) | 7 (5.7%) |
| 35 to 64 Years | 14 (7.6%) | 18 (12.1%) |
| 65 to 74 Years | 0 (0.0%) | 0 (0.0%) |
| 75 Years and over | 9 (75.0%) | 3 (27.3%) |
Disability Class: Vision Difficulty
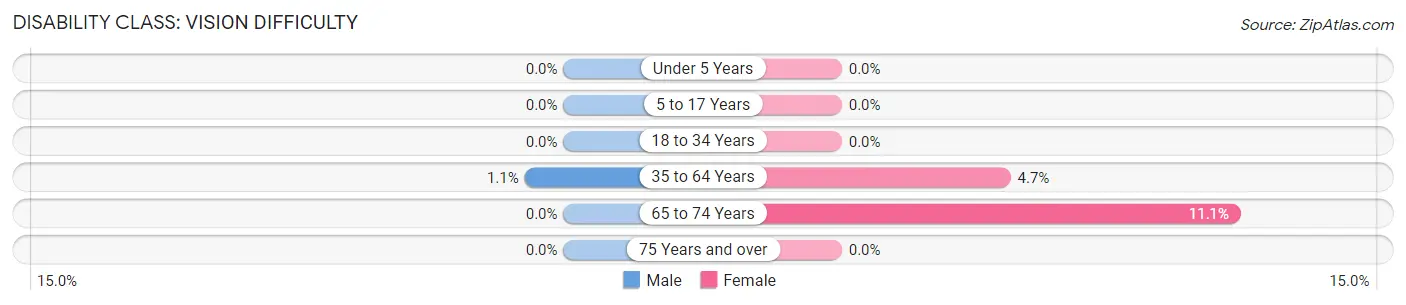
| Age Bracket | Male | Female |
| Under 5 Years | 0 (0.0%) | 0 (0.0%) |
| 5 to 17 Years | 0 (0.0%) | 0 (0.0%) |
| 18 to 34 Years | 0 (0.0%) | 0 (0.0%) |
| 35 to 64 Years | 2 (1.1%) | 7 (4.7%) |
| 65 to 74 Years | 0 (0.0%) | 2 (11.1%) |
| 75 Years and over | 0 (0.0%) | 0 (0.0%) |
Disability Class: Cognitive Difficulty
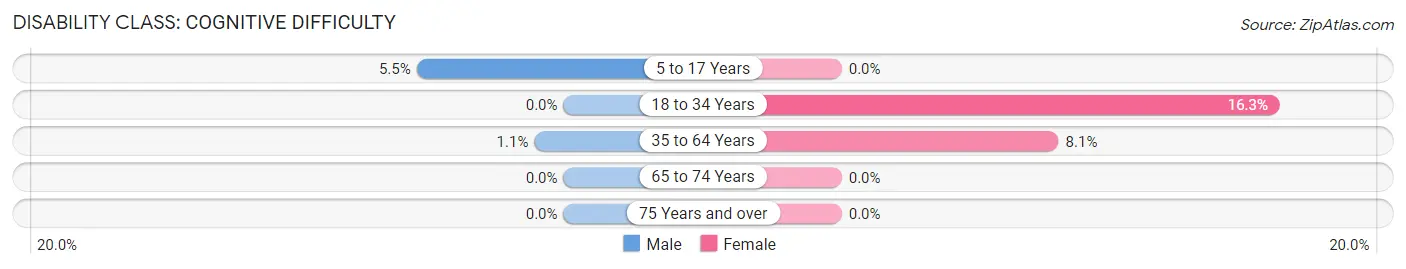
| Age Bracket | Male | Female |
| 5 to 17 Years | 6 (5.4%) | 0 (0.0%) |
| 18 to 34 Years | 0 (0.0%) | 20 (16.3%) |
| 35 to 64 Years | 2 (1.1%) | 12 (8.1%) |
| 65 to 74 Years | 0 (0.0%) | 0 (0.0%) |
| 75 Years and over | 0 (0.0%) | 0 (0.0%) |
Disability Class: Ambulatory Difficulty
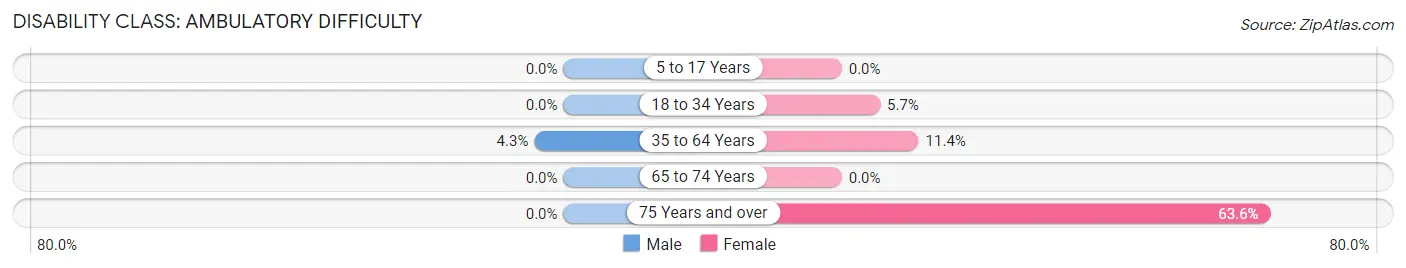
| Age Bracket | Male | Female |
| 5 to 17 Years | 0 (0.0%) | 0 (0.0%) |
| 18 to 34 Years | 0 (0.0%) | 7 (5.7%) |
| 35 to 64 Years | 8 (4.3%) | 17 (11.4%) |
| 65 to 74 Years | 0 (0.0%) | 0 (0.0%) |
| 75 Years and over | 0 (0.0%) | 7 (63.6%) |
Disability Class: Self-Care Difficulty
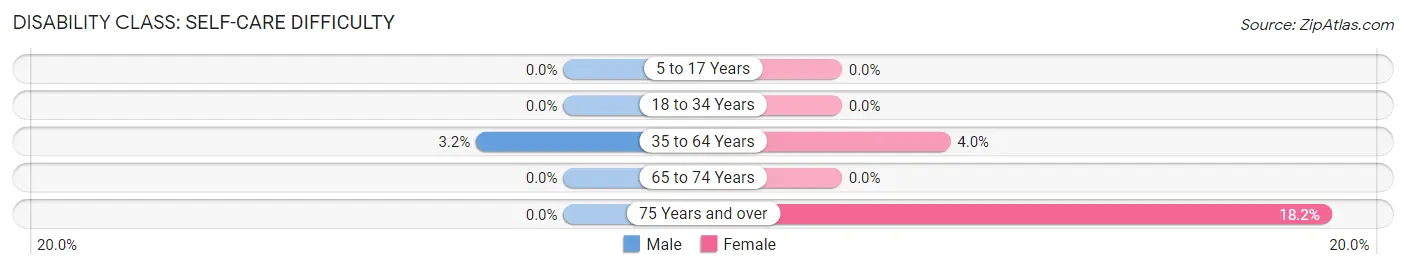
| Age Bracket | Male | Female |
| 5 to 17 Years | 0 (0.0%) | 0 (0.0%) |
| 18 to 34 Years | 0 (0.0%) | 0 (0.0%) |
| 35 to 64 Years | 6 (3.2%) | 6 (4.0%) |
| 65 to 74 Years | 0 (0.0%) | 0 (0.0%) |
| 75 Years and over | 0 (0.0%) | 2 (18.2%) |
Technology Access in Goshen
Computing Device Access in Goshen
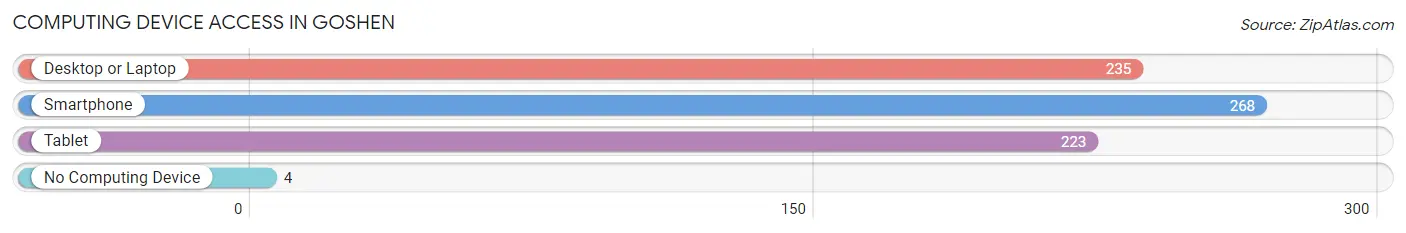
| Device Type | # Households | % Households |
| Desktop or Laptop | 235 | 82.5% |
| Smartphone | 268 | 94.0% |
| Tablet | 223 | 78.2% |
| No Computing Device | 4 | 1.4% |
| Total | 285 | 100.0% |
Internet Access in Goshen
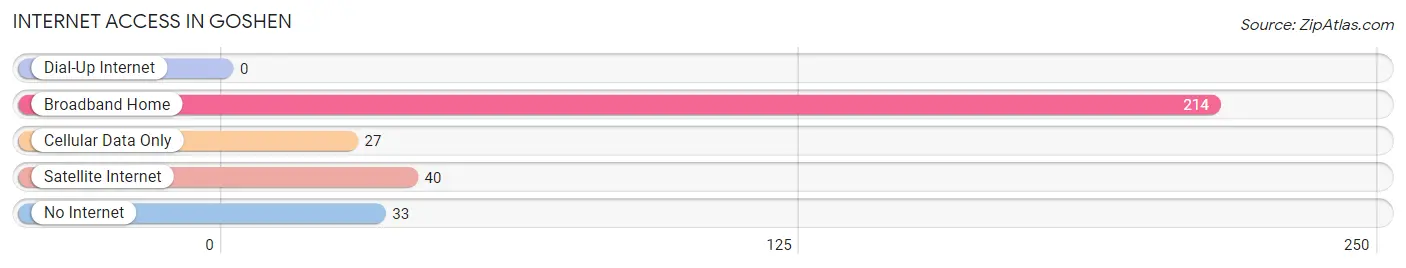
| Internet Type | # Households | % Households |
| Dial-Up Internet | 0 | 0.0% |
| Broadband Home | 214 | 75.1% |
| Cellular Data Only | 27 | 9.5% |
| Satellite Internet | 40 | 14.0% |
| No Internet | 33 | 11.6% |
| Total | 285 | 100.0% |
Goshen Summary
Goshen is a small town located in Utah County, Utah, United States. It is situated in the foothills of the Wasatch Mountains, about 20 miles south of Provo. The population was 1,945 at the 2010 census.
History
Goshen was first settled in 1859 by a group of Mormon pioneers led by John S. Fullmer. The town was named after the biblical land of Goshen, which was the place where the Israelites lived during their time in Egypt. The settlers built a fort to protect themselves from Native American attacks. The fort was later replaced by a stone wall, which still stands today.
The town was incorporated in 1877 and has remained a small, rural community ever since. The town was known for its dairy farms and fruit orchards. In the early 1900s, the town was home to a large number of sheep and cattle ranches.
Geography
Goshen is located at 40°25'17" North, 111°45'17" West (40.4214, -111.7547). It is situated in the foothills of the Wasatch Mountains, about 20 miles south of Provo. The town is located in a valley surrounded by mountains on all sides. The nearest major city is Salt Lake City, which is about 50 miles to the north.
The town has a total area of 1.2 square miles, all of which is land. The elevation is 4,890 feet above sea level.
Economy
Goshen's economy is largely based on agriculture. The town is home to several dairy farms and fruit orchards. The town also has a few small businesses, including a gas station, a grocery store, and a few restaurants.
Demographics
As of the 2010 census, there were 1,945 people, 645 households, and 486 families residing in the town. The population density was 1,621.7 people per square mile. The racial makeup of the town was 94.2% White, 0.2% African American, 0.2% Native American, 0.2% Asian, 0.1% Pacific Islander, 3.2% from other races, and 1.9% from two or more races. Hispanic or Latino of any race were 6.2% of the population.
There were 645 households, out of which 37.2% had children under the age of 18 living with them, 59.7% were married couples living together, 9.2% had a female householder with no husband present, and 25.7% were non-families. 21.7% of all households were made up of individuals, and 8.2% had someone living alone who was 65 years of age or older. The average household size was 3.00 and the average family size was 3.50.
In the town, the population was spread out, with 30.2% under the age of 18, 8.2% from 18 to 24, 25.2% from 25 to 44, 24.2% from 45 to 64, and 12.2% who were 65 years of age or older. The median age was 35 years. For every 100 females, there were 97.2 males. For every 100 females age 18 and over, there were 94.2 males.
The median income for a household in the town was $45,000, and the median income for a family was $50,000. Males had a median income of $35,000 versus $25,000 for females. The per capita income for the town was $17,000. About 6.2% of families and 8.2% of the population were below the poverty line, including 10.2% of those under age 18 and 6.2% of those age 65 or over.
Common Questions
What is Per Capita Income in Goshen?
Per Capita income in Goshen is $29,626.
What is the Median Family Income in Goshen?
Median Family Income in Goshen is $89,750.
What is the Median Household income in Goshen?
Median Household Income in Goshen is $92,232.
What is Income or Wage Gap in Goshen?
Income or Wage Gap in Goshen is 32.9%.
Women in Goshen earn 67.1 cents for every dollar earned by a man.
What is Inequality or Gini Index in Goshen?
Inequality or Gini Index in Goshen is 0.31.
What is the Total Population of Goshen?
Total Population of Goshen is 865.
What is the Total Male Population of Goshen?
Total Male Population of Goshen is 416.
What is the Total Female Population of Goshen?
Total Female Population of Goshen is 449.
What is the Ratio of Males per 100 Females in Goshen?
There are 92.65 Males per 100 Females in Goshen.
What is the Ratio of Females per 100 Males in Goshen?
There are 107.93 Females per 100 Males in Goshen.
What is the Median Population Age in Goshen?
Median Population Age in Goshen is 30.3 Years.
What is the Average Family Size in Goshen
Average Family Size in Goshen is 3.3 People.
What is the Average Household Size in Goshen
Average Household Size in Goshen is 3.0 People.
How Large is the Labor Force in Goshen?
There are 459 People in the Labor Forcein in Goshen.
What is the Percentage of People in the Labor Force in Goshen?
76.4% of People are in the Labor Force in Goshen.
What is the Unemployment Rate in Goshen?
Unemployment Rate in Goshen is 1.3%.