Coalville, UT Map & Demographics
Coalville Map
Coalville Overview
$28,885
PER CAPITA INCOME
$90,000
AVG FAMILY INCOME
$84,917
AVG HOUSEHOLD INCOME
12.9%
WAGE / INCOME GAP [ % ]
87.1¢/ $1
WAGE / INCOME GAP [ $ ]
0.36
INEQUALITY / GINI INDEX
2,014
TOTAL POPULATION
1,015
MALE POPULATION
999
FEMALE POPULATION
101.60
MALES / 100 FEMALES
98.42
FEMALES / 100 MALES
27.7
MEDIAN AGE
4.8
AVG FAMILY SIZE
4.2
AVG HOUSEHOLD SIZE
1,111
LABOR FORCE [ PEOPLE ]
73.2%
PERCENT IN LABOR FORCE
2.4%
UNEMPLOYMENT RATE
Coalville Zip Codes
Coalville Area Codes
Income in Coalville
Income Overview in Coalville
Per Capita Income in Coalville is $28,885, while median incomes of families and households are $90,000 and $84,917 respectively.
| Characteristic | Number | Measure |
| Per Capita Income | 2,014 | $28,885 |
| Median Family Income | 386 | $90,000 |
| Mean Family Income | 386 | $101,374 |
| Median Household Income | 475 | $84,917 |
| Mean Household Income | 475 | $96,806 |
| Income Deficit | 386 | $0 |
| Wage / Income Gap (%) | 2,014 | 12.88% |
| Wage / Income Gap ($) | 2,014 | 87.12¢ per $1 |
| Gini / Inequality Index | 2,014 | 0.36 |
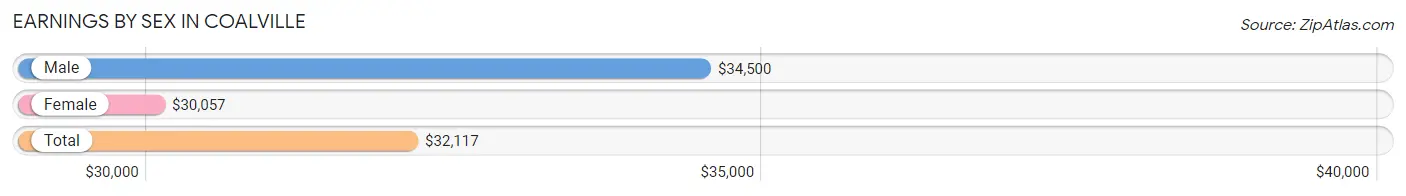
Earnings by Sex in Coalville
Average Earnings in Coalville are $32,117, $34,500 for men and $30,057 for women, a difference of 12.9%.
| Sex | Number | Average Earnings |
| Male | 638 (54.4%) | $34,500 |
| Female | 535 (45.6%) | $30,057 |
| Total | 1,173 (100.0%) | $32,117 |
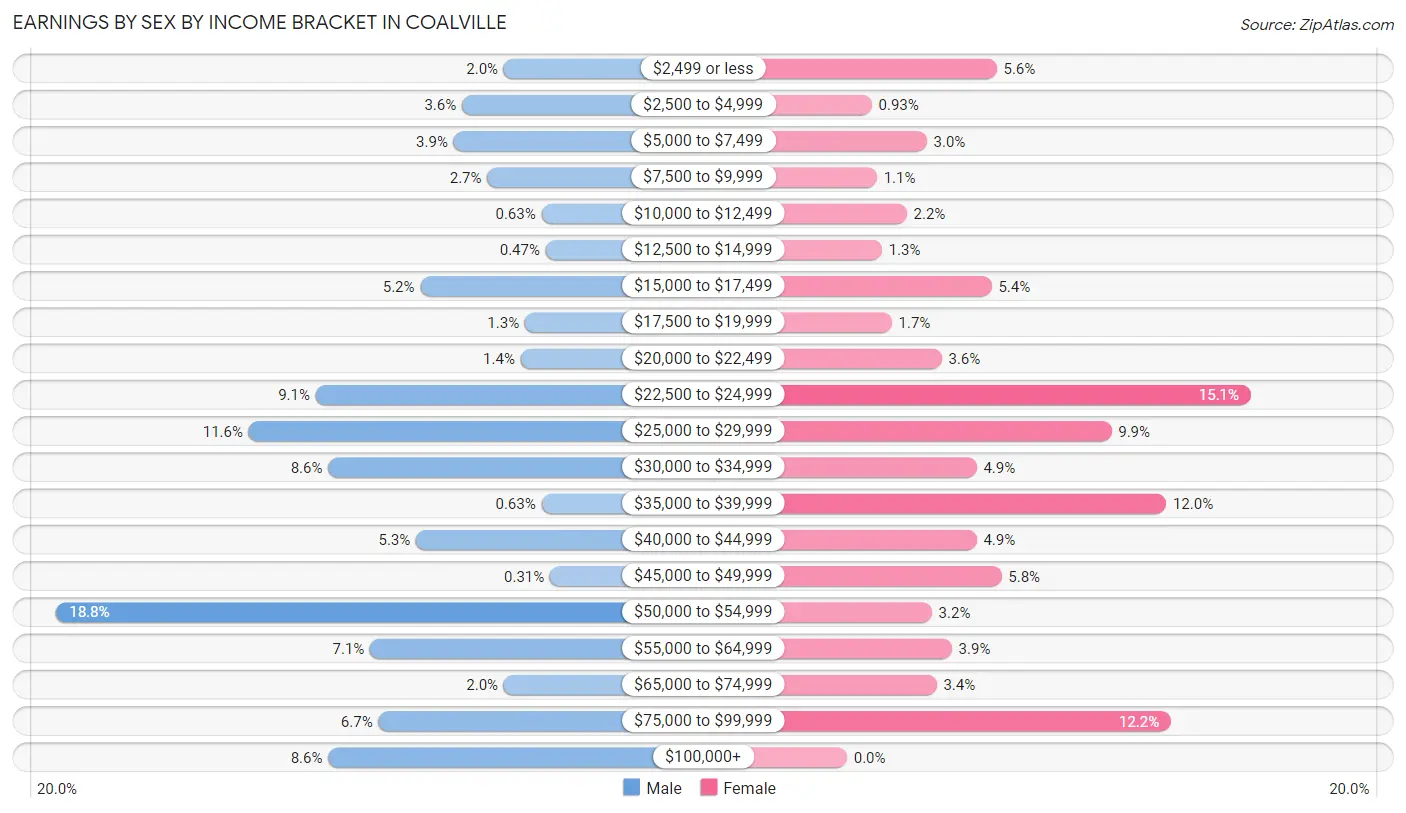
Earnings by Sex by Income Bracket in Coalville
The most common earnings brackets in Coalville are $50,000 to $54,999 for men (120 | 18.8%) and $22,500 to $24,999 for women (81 | 15.1%).
| Income | Male | Female |
| $2,499 or less | 13 (2.0%) | 30 (5.6%) |
| $2,500 to $4,999 | 23 (3.6%) | 5 (0.9%) |
| $5,000 to $7,499 | 25 (3.9%) | 16 (3.0%) |
| $7,500 to $9,999 | 17 (2.7%) | 6 (1.1%) |
| $10,000 to $12,499 | 4 (0.6%) | 12 (2.2%) |
| $12,500 to $14,999 | 3 (0.5%) | 7 (1.3%) |
| $15,000 to $17,499 | 33 (5.2%) | 29 (5.4%) |
| $17,500 to $19,999 | 8 (1.3%) | 9 (1.7%) |
| $20,000 to $22,499 | 9 (1.4%) | 19 (3.5%) |
| $22,500 to $24,999 | 58 (9.1%) | 81 (15.1%) |
| $25,000 to $29,999 | 74 (11.6%) | 53 (9.9%) |
| $30,000 to $34,999 | 55 (8.6%) | 26 (4.9%) |
| $35,000 to $39,999 | 4 (0.6%) | 64 (12.0%) |
| $40,000 to $44,999 | 34 (5.3%) | 26 (4.9%) |
| $45,000 to $49,999 | 2 (0.3%) | 31 (5.8%) |
| $50,000 to $54,999 | 120 (18.8%) | 17 (3.2%) |
| $55,000 to $64,999 | 45 (7.0%) | 21 (3.9%) |
| $65,000 to $74,999 | 13 (2.0%) | 18 (3.4%) |
| $75,000 to $99,999 | 43 (6.7%) | 65 (12.1%) |
| $100,000+ | 55 (8.6%) | 0 (0.0%) |
| Total | 638 (100.0%) | 535 (100.0%) |
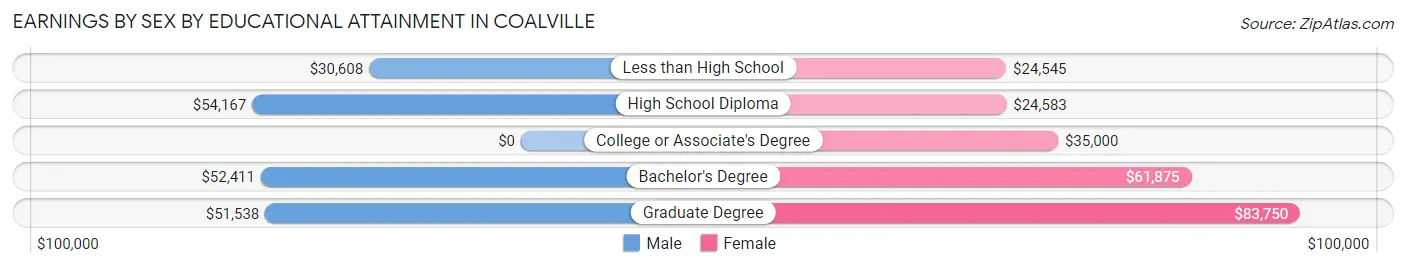
Earnings by Sex by Educational Attainment in Coalville
Average earnings in Coalville are $50,530 for men and $35,509 for women, a difference of 29.7%. Men with an educational attainment of high school diploma enjoy the highest average annual earnings of $54,167, while those with less than high school education earn the least with $30,608. Women with an educational attainment of graduate degree earn the most with the average annual earnings of $83,750, while those with less than high school education have the smallest earnings of $24,545.
| Educational Attainment | Male Income | Female Income |
| Less than High School | $30,608 | $24,545 |
| High School Diploma | $54,167 | $24,583 |
| College or Associate's Degree | - | - |
| Bachelor's Degree | $52,411 | $61,875 |
| Graduate Degree | $51,538 | $83,750 |
| Total | $50,530 | $35,509 |
Family Income in Coalville
Family Income Brackets in Coalville
According to the Coalville family income data, there are 101 families falling into the $75,000 to $99,999 income range, which is the most common income bracket and makes up 26.2% of all families.
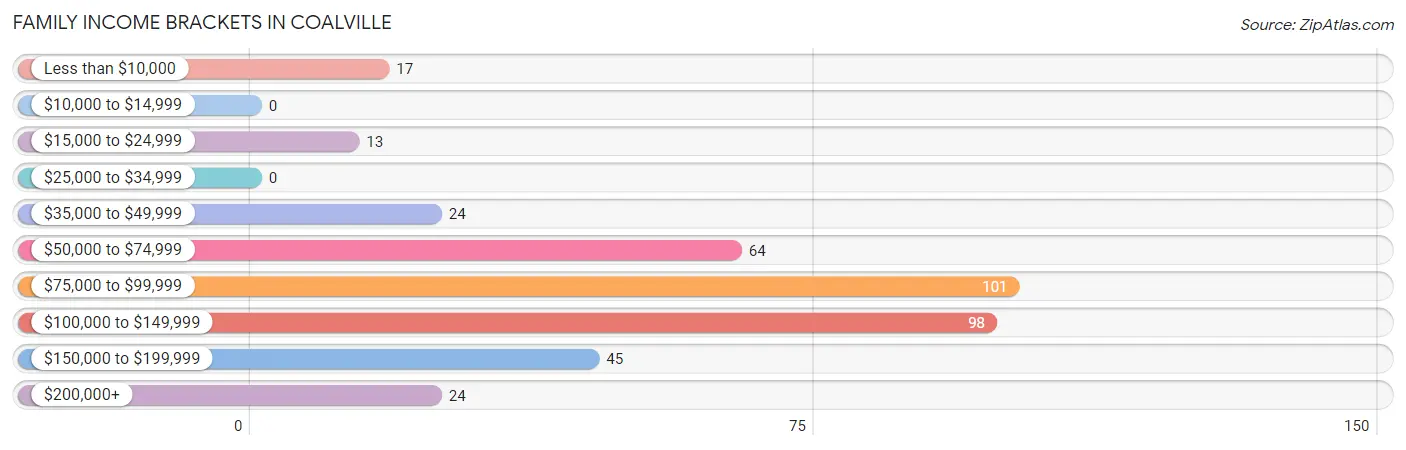
| Income Bracket | # Families | % Families |
| Less than $10,000 | 17 | 4.4% |
| $10,000 to $14,999 | 0 | 0.0% |
| $15,000 to $24,999 | 13 | 3.4% |
| $25,000 to $34,999 | 0 | 0.0% |
| $35,000 to $49,999 | 24 | 6.2% |
| $50,000 to $74,999 | 64 | 16.6% |
| $75,000 to $99,999 | 101 | 26.2% |
| $100,000 to $149,999 | 98 | 25.4% |
| $150,000 to $199,999 | 45 | 11.7% |
| $200,000+ | 24 | 6.2% |
Family Income by Famaliy Size in Coalville
4-person families (70 | 18.1%) account for the highest median family income in Coalville with $106,667 per family, while 2-person families (130 | 33.7%) have the highest median income of $52,084 per family member.
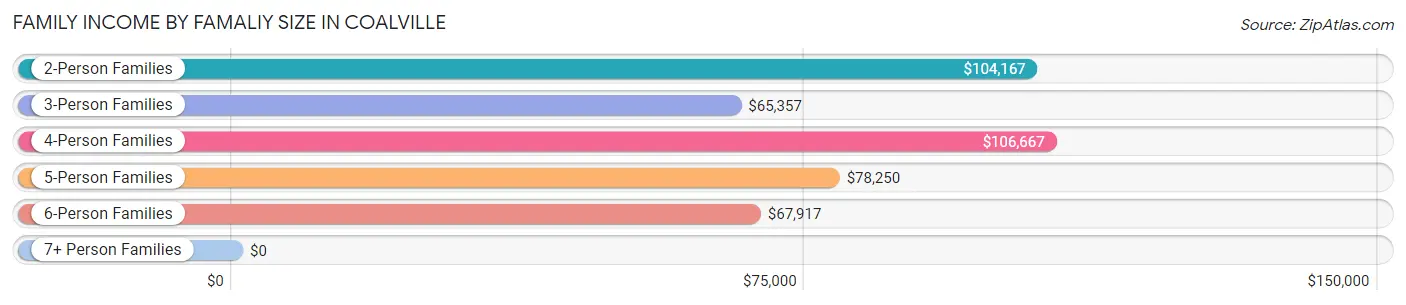
| Income Bracket | # Families | Median Income |
| 2-Person Families | 130 (33.7%) | $104,167 |
| 3-Person Families | 62 (16.1%) | $65,357 |
| 4-Person Families | 70 (18.1%) | $106,667 |
| 5-Person Families | 99 (25.7%) | $78,250 |
| 6-Person Families | 19 (4.9%) | $67,917 |
| 7+ Person Families | 6 (1.5%) | $0 |
| Total | 386 (100.0%) | $90,000 |
Family Income by Number of Earners in Coalville
The median family income in Coalville is $90,000, with families comprising 3+ earners (100) having the highest median family income of $123,750, while families with no earners (17) have the lowest median family income of $2,499, accounting for 25.9% and 4.4% of families, respectively.
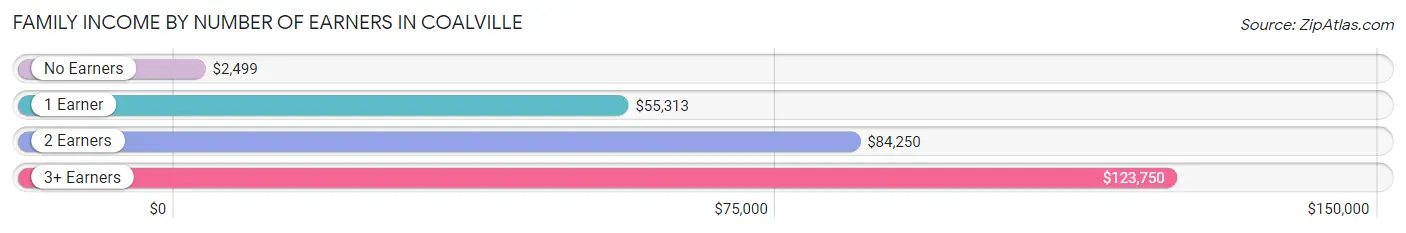
| Number of Earners | # Families | Median Income |
| No Earners | 17 (4.4%) | $2,499 |
| 1 Earner | 72 (18.6%) | $55,313 |
| 2 Earners | 197 (51.0%) | $84,250 |
| 3+ Earners | 100 (25.9%) | $123,750 |
| Total | 386 (100.0%) | $90,000 |
Household Income in Coalville
Household Income Brackets in Coalville
With 123 households falling in the category, the $75,000 to $99,999 income range is the most frequent in Coalville, accounting for 25.9% of all households.
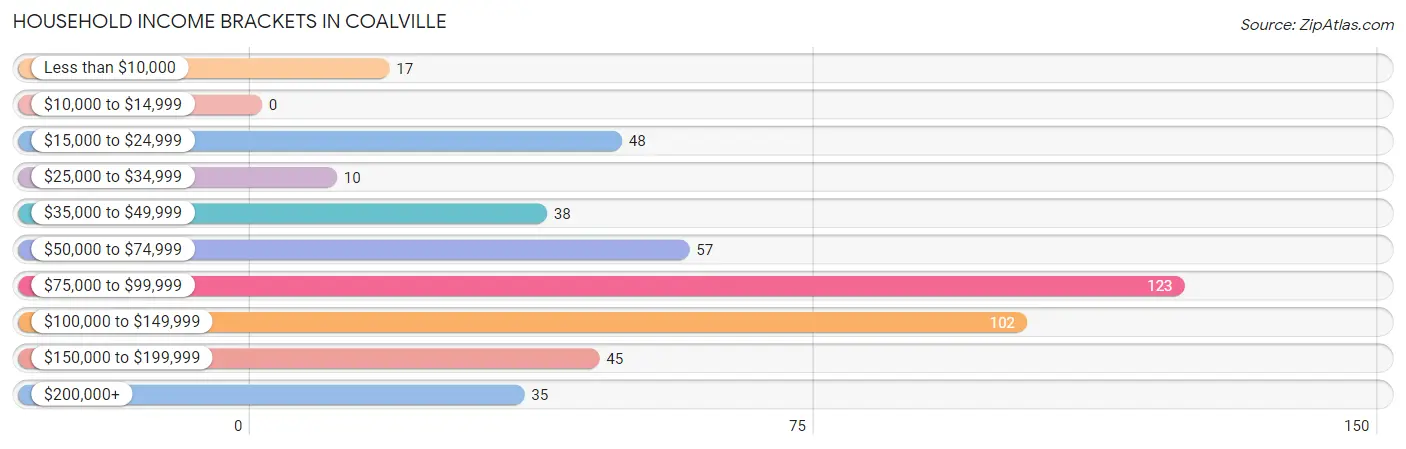
| Income Bracket | # Households | % Households |
| Less than $10,000 | 17 | 3.6% |
| $10,000 to $14,999 | 0 | 0.0% |
| $15,000 to $24,999 | 48 | 10.1% |
| $25,000 to $34,999 | 10 | 2.1% |
| $35,000 to $49,999 | 38 | 8.0% |
| $50,000 to $74,999 | 57 | 12.0% |
| $75,000 to $99,999 | 123 | 25.9% |
| $100,000 to $149,999 | 102 | 21.5% |
| $150,000 to $199,999 | 45 | 9.5% |
| $200,000+ | 35 | 7.4% |
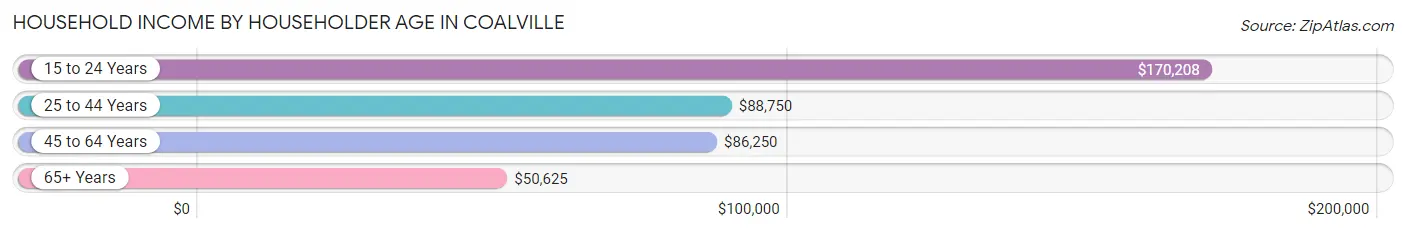
Household Income by Householder Age in Coalville
The median household income in Coalville is $84,917, with the highest median household income of $170,208 found in the 15 to 24 years age bracket for the primary householder. A total of 33 households (7.0%) fall into this category. Meanwhile, the 65+ years age bracket for the primary householder has the lowest median household income of $50,625, with 77 households (16.2%) in this group.
| Income Bracket | # Households | Median Income |
| 15 to 24 Years | 33 (7.0%) | $170,208 |
| 25 to 44 Years | 171 (36.0%) | $88,750 |
| 45 to 64 Years | 194 (40.8%) | $86,250 |
| 65+ Years | 77 (16.2%) | $50,625 |
| Total | 475 (100.0%) | $84,917 |
Poverty in Coalville
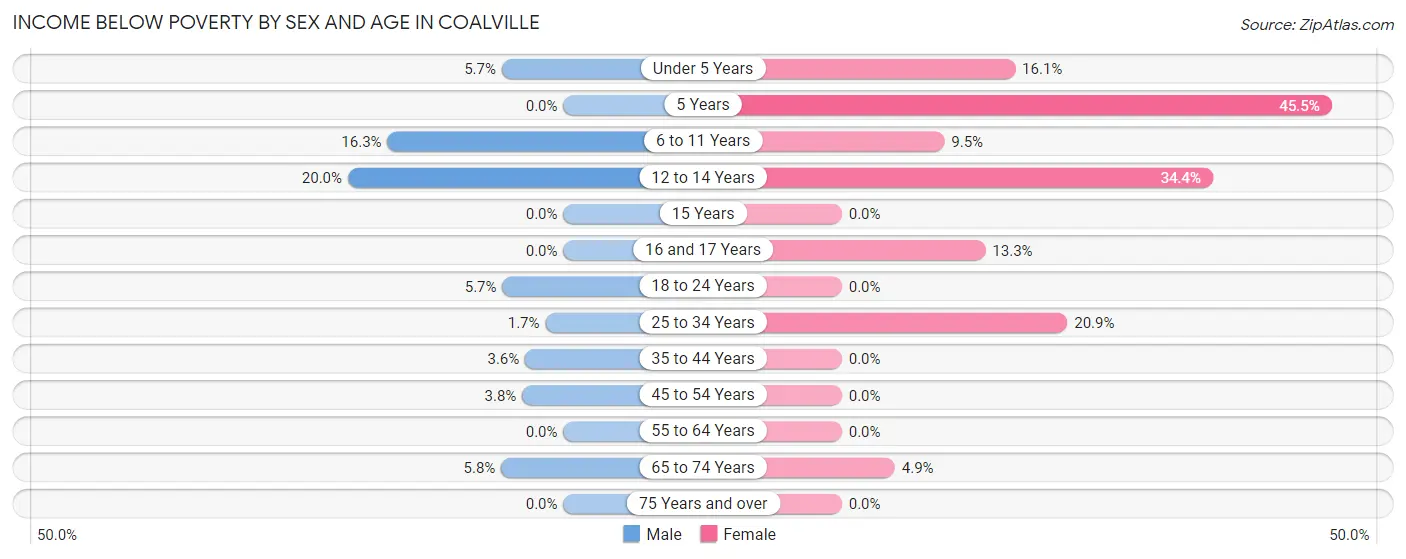
Income Below Poverty by Sex and Age in Coalville
With 4.8% poverty level for males and 8.4% for females among the residents of Coalville, 12 to 14 year old males and 5 year old females are the most vulnerable to poverty, with 12 males (20.0%) and 5 females (45.5%) in their respective age groups living below the poverty level.
| Age Bracket | Male | Female |
| Under 5 Years | 6 (5.7%) | 14 (16.1%) |
| 5 Years | 0 (0.0%) | 5 (45.5%) |
| 6 to 11 Years | 8 (16.3%) | 10 (9.5%) |
| 12 to 14 Years | 12 (20.0%) | 21 (34.4%) |
| 15 Years | 0 (0.0%) | 0 (0.0%) |
| 16 and 17 Years | 0 (0.0%) | 4 (13.3%) |
| 18 to 24 Years | 6 (5.7%) | 0 (0.0%) |
| 25 to 34 Years | 4 (1.7%) | 27 (20.9%) |
| 35 to 44 Years | 5 (3.5%) | 0 (0.0%) |
| 45 to 54 Years | 5 (3.8%) | 0 (0.0%) |
| 55 to 64 Years | 0 (0.0%) | 0 (0.0%) |
| 65 to 74 Years | 3 (5.8%) | 3 (4.9%) |
| 75 Years and over | 0 (0.0%) | 0 (0.0%) |
| Total | 49 (4.8%) | 84 (8.4%) |
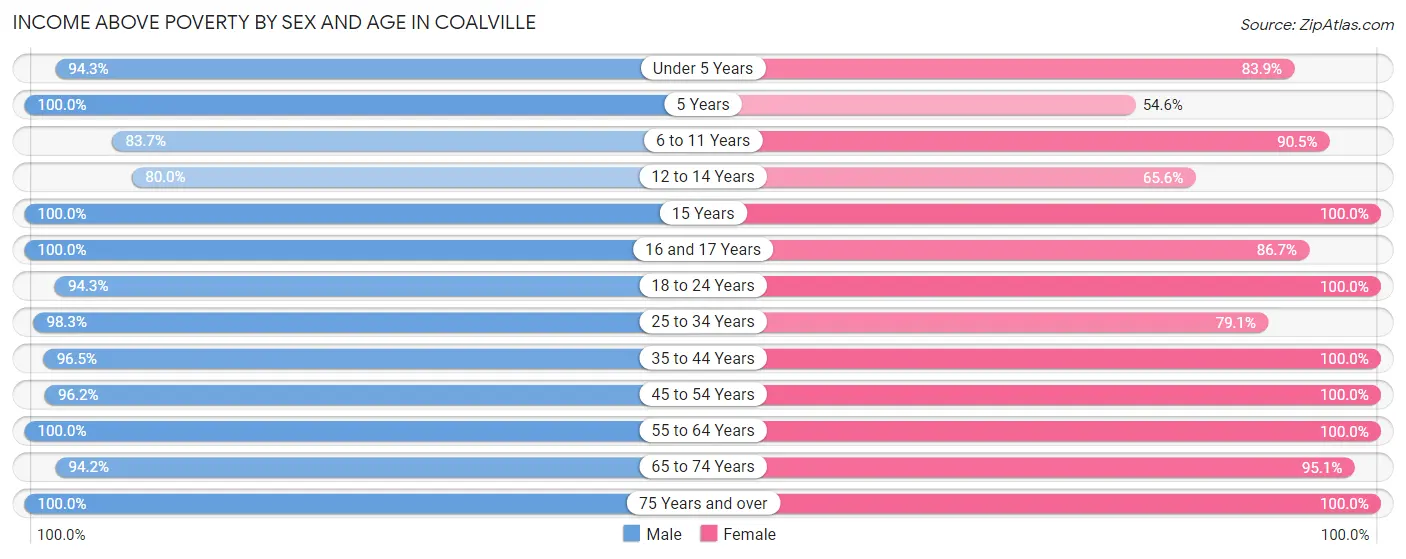
Income Above Poverty by Sex and Age in Coalville
According to the poverty statistics in Coalville, males aged 5 years and females aged 15 years are the age groups that are most secure financially, with 100.0% of males and 100.0% of females in these age groups living above the poverty line.
| Age Bracket | Male | Female |
| Under 5 Years | 99 (94.3%) | 73 (83.9%) |
| 5 Years | 2 (100.0%) | 6 (54.5%) |
| 6 to 11 Years | 41 (83.7%) | 95 (90.5%) |
| 12 to 14 Years | 48 (80.0%) | 40 (65.6%) |
| 15 Years | 10 (100.0%) | 6 (100.0%) |
| 16 and 17 Years | 33 (100.0%) | 26 (86.7%) |
| 18 to 24 Years | 100 (94.3%) | 122 (100.0%) |
| 25 to 34 Years | 236 (98.3%) | 102 (79.1%) |
| 35 to 44 Years | 136 (96.5%) | 125 (100.0%) |
| 45 to 54 Years | 126 (96.2%) | 209 (100.0%) |
| 55 to 64 Years | 69 (100.0%) | 21 (100.0%) |
| 65 to 74 Years | 49 (94.2%) | 58 (95.1%) |
| 75 Years and over | 17 (100.0%) | 32 (100.0%) |
| Total | 966 (95.2%) | 915 (91.6%) |
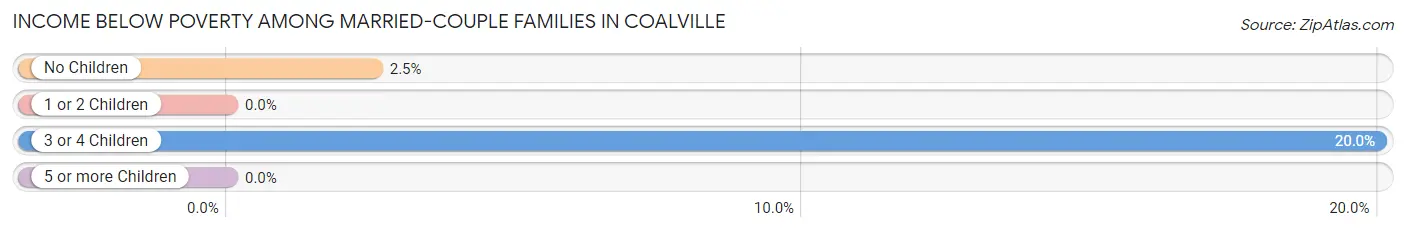
Income Below Poverty Among Married-Couple Families in Coalville
The poverty statistics for married-couple families in Coalville show that 2.3% or 7 of the total 300 families live below the poverty line. Families with 3 or 4 children have the highest poverty rate of 20.0%, comprising of 4 families. On the other hand, families with 1 or 2 children have the lowest poverty rate of 0.0%, which includes 0 families.
| Children | Above Poverty | Below Poverty |
| No Children | 116 (97.5%) | 3 (2.5%) |
| 1 or 2 Children | 155 (100.0%) | 0 (0.0%) |
| 3 or 4 Children | 16 (80.0%) | 4 (20.0%) |
| 5 or more Children | 6 (100.0%) | 0 (0.0%) |
| Total | 293 (97.7%) | 7 (2.3%) |
Income Below Poverty Among Single-Parent Households in Coalville
According to the poverty data in Coalville, 23.3% or 10 single-father households and 20.9% or 9 single-mother households are living below the poverty line. Among single-father households, those with 3 or 4 children have the highest poverty rate, with 5 households (100.0%) experiencing poverty. Likewise, among single-mother households, those with 1 or 2 children have the highest poverty rate, with 9 households (31.0%) falling below the poverty line.
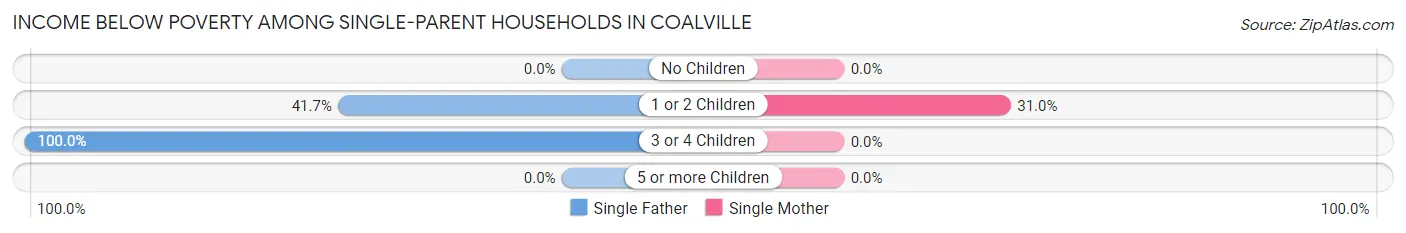
| Children | Single Father | Single Mother |
| No Children | 0 (0.0%) | 0 (0.0%) |
| 1 or 2 Children | 5 (41.7%) | 9 (31.0%) |
| 3 or 4 Children | 5 (100.0%) | 0 (0.0%) |
| 5 or more Children | 0 (0.0%) | 0 (0.0%) |
| Total | 10 (23.3%) | 9 (20.9%) |
Income Below Poverty Among Married-Couple vs Single-Parent Households in Coalville
The poverty data for Coalville shows that 7 of the married-couple family households (2.3%) and 19 of the single-parent households (22.1%) are living below the poverty level. Within the married-couple family households, those with 3 or 4 children have the highest poverty rate, with 4 households (20.0%) falling below the poverty line. Among the single-parent households, those with 3 or 4 children have the highest poverty rate, with 5 household (50.0%) living below poverty.
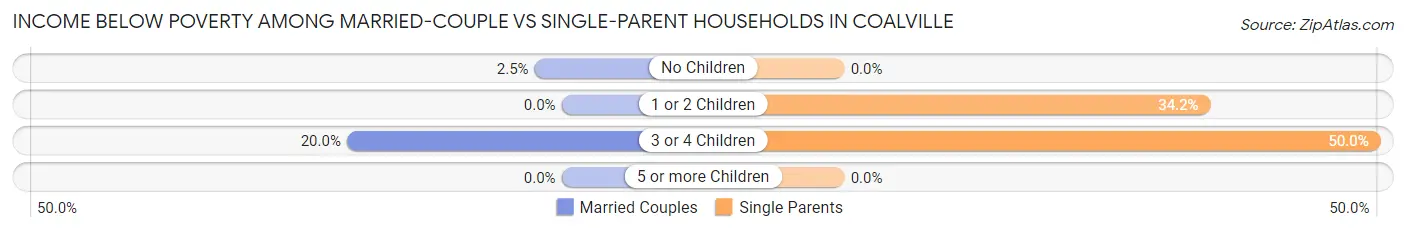
| Children | Married-Couple Families | Single-Parent Households |
| No Children | 3 (2.5%) | 0 (0.0%) |
| 1 or 2 Children | 0 (0.0%) | 14 (34.2%) |
| 3 or 4 Children | 4 (20.0%) | 5 (50.0%) |
| 5 or more Children | 0 (0.0%) | 0 (0.0%) |
| Total | 7 (2.3%) | 19 (22.1%) |
Race in Coalville
The most populous races in Coalville are White / Caucasian (1,248 | 62.0%), Hispanic or Latino (1,052 | 52.2%), and Two or more Races (339 | 16.8%).
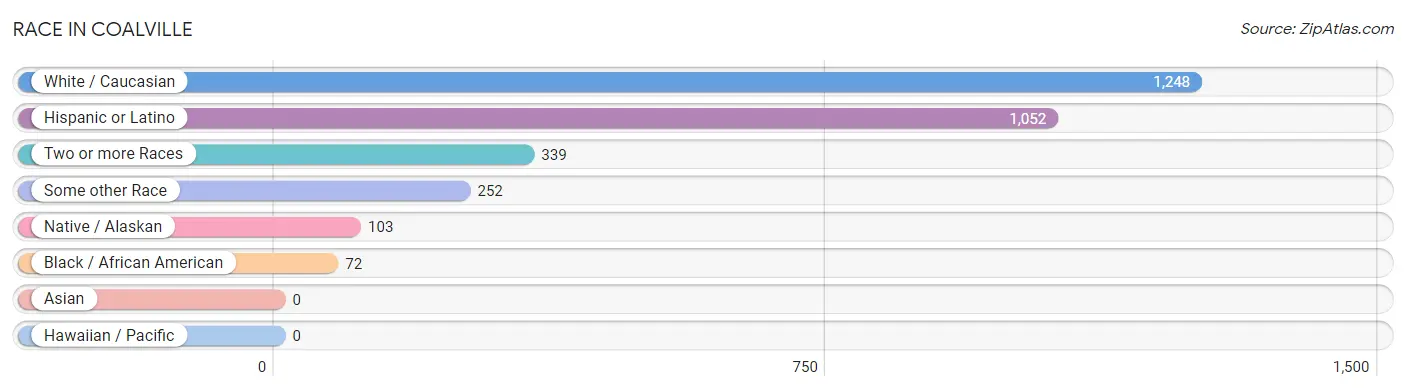
| Race | # Population | % Population |
| Asian | 0 | 0.0% |
| Black / African American | 72 | 3.6% |
| Hawaiian / Pacific | 0 | 0.0% |
| Hispanic or Latino | 1,052 | 52.2% |
| Native / Alaskan | 103 | 5.1% |
| White / Caucasian | 1,248 | 62.0% |
| Two or more Races | 339 | 16.8% |
| Some other Race | 252 | 12.5% |
| Total | 2,014 | 100.0% |
Ancestry in Coalville
The most populous ancestries reported in Coalville are Mexican (1,027 | 51.0%), English (339 | 16.8%), Mexican American Indian (103 | 5.1%), Irish (72 | 3.6%), and German (51 | 2.5%), together accounting for 79.0% of all Coalville residents.
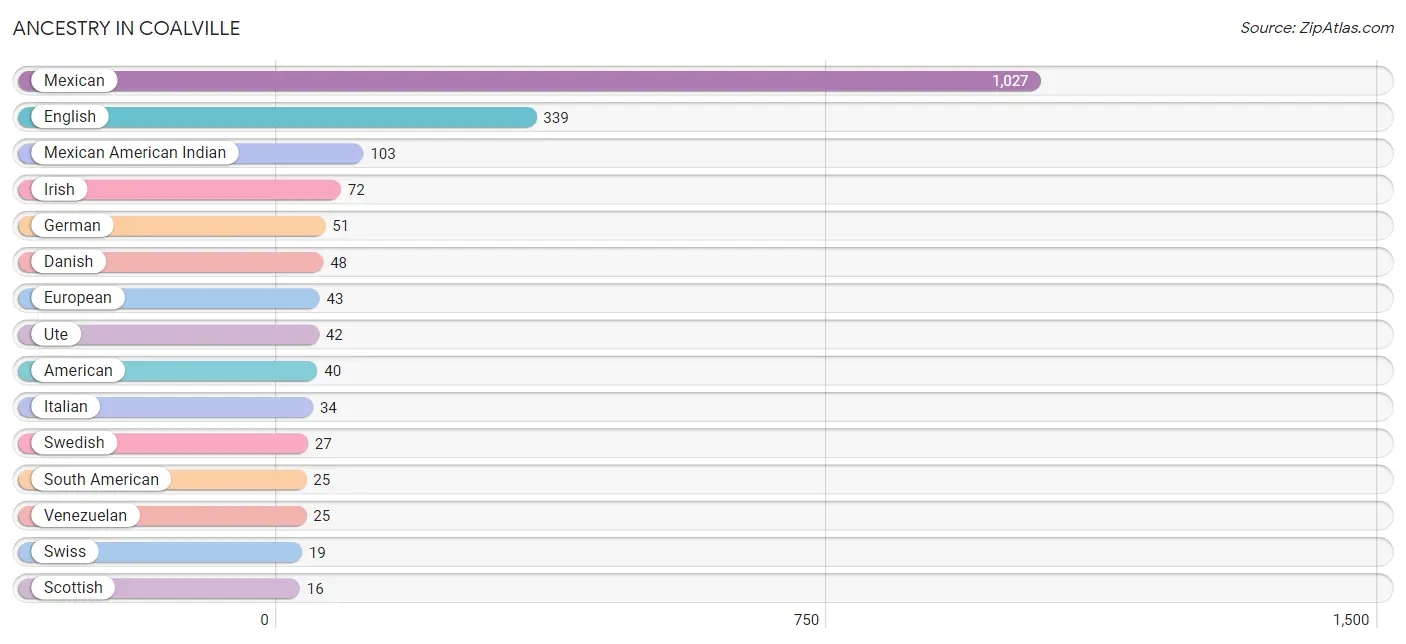
| Ancestry | # Population | % Population |
| American | 40 | 2.0% |
| Armenian | 4 | 0.2% |
| Australian | 5 | 0.3% |
| British | 7 | 0.4% |
| Danish | 48 | 2.4% |
| Dutch | 6 | 0.3% |
| English | 339 | 16.8% |
| European | 43 | 2.1% |
| French | 13 | 0.6% |
| French Canadian | 4 | 0.2% |
| German | 51 | 2.5% |
| Irish | 72 | 3.6% |
| Italian | 34 | 1.7% |
| Mexican | 1,027 | 51.0% |
| Mexican American Indian | 103 | 5.1% |
| Polish | 3 | 0.2% |
| Scottish | 16 | 0.8% |
| South American | 25 | 1.2% |
| Sri Lankan | 2 | 0.1% |
| Swedish | 27 | 1.3% |
| Swiss | 19 | 0.9% |
| Ute | 42 | 2.1% |
| Venezuelan | 25 | 1.2% |
| Welsh | 3 | 0.2% | View All 24 Rows |
Immigrants in Coalville
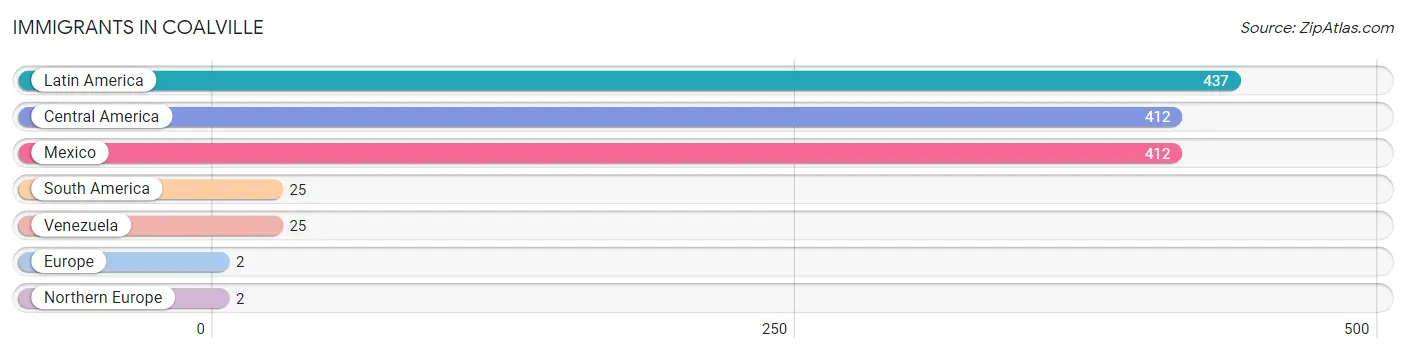
The most numerous immigrant groups reported in Coalville came from Latin America (437 | 21.7%), Central America (412 | 20.5%), Mexico (412 | 20.5%), South America (25 | 1.2%), and Venezuela (25 | 1.2%), together accounting for 65.1% of all Coalville residents.
| Immigration Origin | # Population | % Population |
| Central America | 412 | 20.5% |
| Europe | 2 | 0.1% |
| Latin America | 437 | 21.7% |
| Mexico | 412 | 20.5% |
| Northern Europe | 2 | 0.1% |
| South America | 25 | 1.2% |
| Venezuela | 25 | 1.2% | View All 7 Rows |
Sex and Age in Coalville
Sex and Age in Coalville
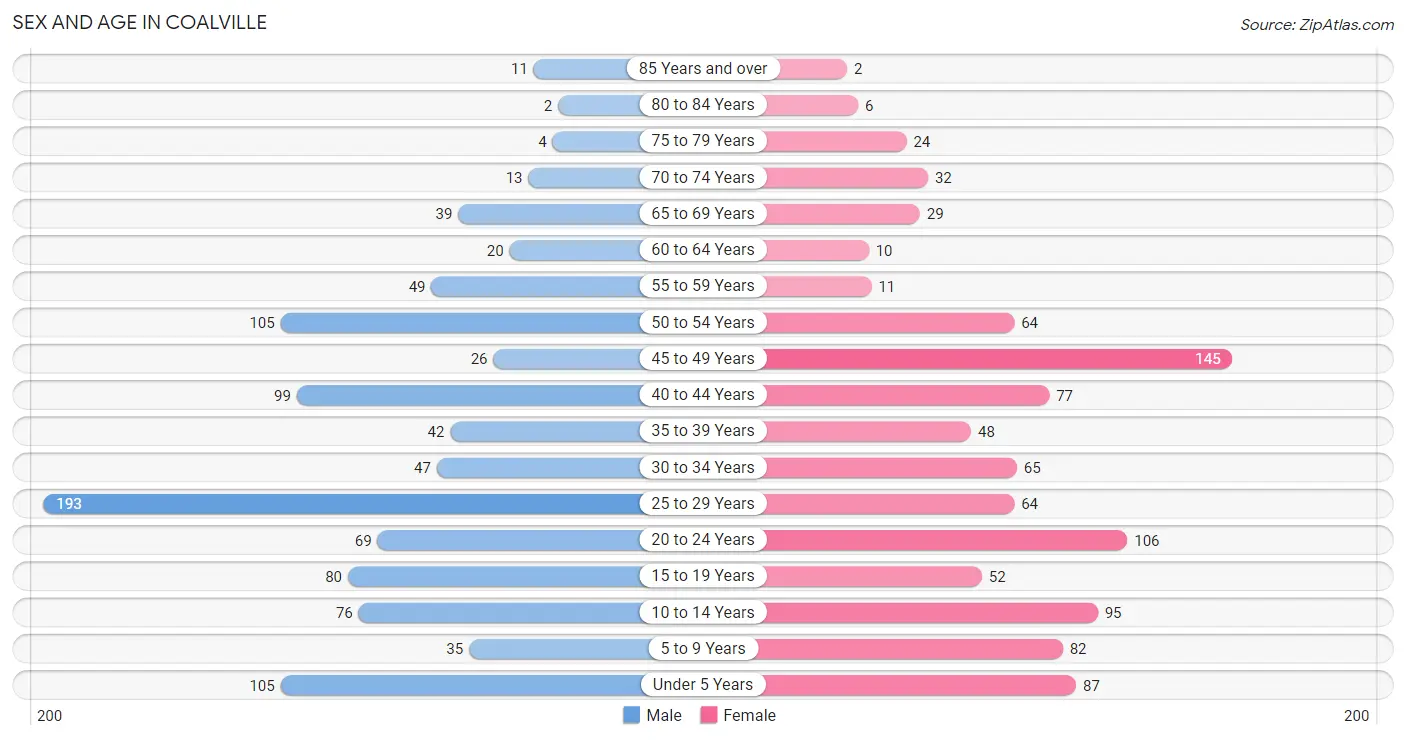
The most populous age groups in Coalville are 25 to 29 Years (193 | 19.0%) for men and 45 to 49 Years (145 | 14.5%) for women.
| Age Bracket | Male | Female |
| Under 5 Years | 105 (10.3%) | 87 (8.7%) |
| 5 to 9 Years | 35 (3.5%) | 82 (8.2%) |
| 10 to 14 Years | 76 (7.5%) | 95 (9.5%) |
| 15 to 19 Years | 80 (7.9%) | 52 (5.2%) |
| 20 to 24 Years | 69 (6.8%) | 106 (10.6%) |
| 25 to 29 Years | 193 (19.0%) | 64 (6.4%) |
| 30 to 34 Years | 47 (4.6%) | 65 (6.5%) |
| 35 to 39 Years | 42 (4.1%) | 48 (4.8%) |
| 40 to 44 Years | 99 (9.8%) | 77 (7.7%) |
| 45 to 49 Years | 26 (2.6%) | 145 (14.5%) |
| 50 to 54 Years | 105 (10.3%) | 64 (6.4%) |
| 55 to 59 Years | 49 (4.8%) | 11 (1.1%) |
| 60 to 64 Years | 20 (2.0%) | 10 (1.0%) |
| 65 to 69 Years | 39 (3.8%) | 29 (2.9%) |
| 70 to 74 Years | 13 (1.3%) | 32 (3.2%) |
| 75 to 79 Years | 4 (0.4%) | 24 (2.4%) |
| 80 to 84 Years | 2 (0.2%) | 6 (0.6%) |
| 85 Years and over | 11 (1.1%) | 2 (0.2%) |
| Total | 1,015 (100.0%) | 999 (100.0%) |
Families and Households in Coalville
Median Family Size in Coalville
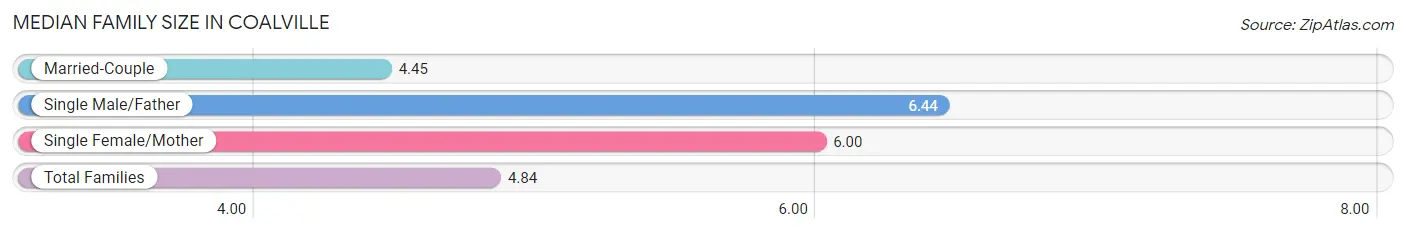
The median family size in Coalville is 4.84 persons per family, with single male/father families (43 | 11.1%) accounting for the largest median family size of 6.44 persons per family. On the other hand, married-couple families (300 | 77.7%) represent the smallest median family size with 4.45 persons per family.
| Family Type | # Families | Family Size |
| Married-Couple | 300 (77.7%) | 4.45 |
| Single Male/Father | 43 (11.1%) | 6.44 |
| Single Female/Mother | 43 (11.1%) | 6.00 |
| Total Families | 386 (100.0%) | 4.84 |
Median Household Size in Coalville
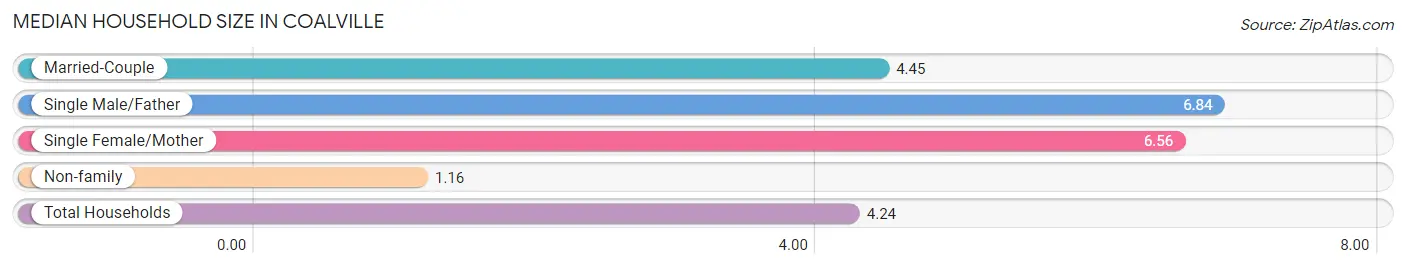
The median household size in Coalville is 4.24 persons per household, with single male/father households (43 | 9.0%) accounting for the largest median household size of 6.84 persons per household. non-family households (89 | 18.7%) represent the smallest median household size with 1.16 persons per household.
| Household Type | # Households | Household Size |
| Married-Couple | 300 (63.2%) | 4.45 |
| Single Male/Father | 43 (9.0%) | 6.84 |
| Single Female/Mother | 43 (9.0%) | 6.56 |
| Non-family | 89 (18.7%) | 1.16 |
| Total Households | 475 (100.0%) | 4.24 |
Household Size by Marriage Status in Coalville
Out of a total of 475 households in Coalville, 386 (81.3%) are family households, while 89 (18.7%) are nonfamily households. The most numerous type of family households are 2-person households, comprising 130, and the most common type of nonfamily households are 1-person households, comprising 77.
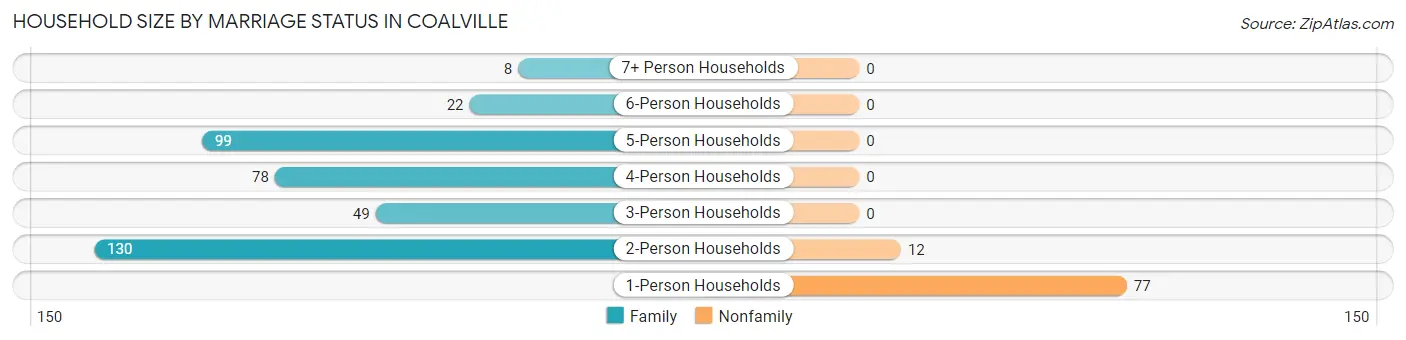
| Household Size | Family Households | Nonfamily Households |
| 1-Person Households | - | 77 (16.2%) |
| 2-Person Households | 130 (27.4%) | 12 (2.5%) |
| 3-Person Households | 49 (10.3%) | 0 (0.0%) |
| 4-Person Households | 78 (16.4%) | 0 (0.0%) |
| 5-Person Households | 99 (20.8%) | 0 (0.0%) |
| 6-Person Households | 22 (4.6%) | 0 (0.0%) |
| 7+ Person Households | 8 (1.7%) | 0 (0.0%) |
| Total | 386 (81.3%) | 89 (18.7%) |
Female Fertility in Coalville
Fertility by Age in Coalville
Average fertility rate in Coalville is 39.0 births per 1,000 women. Women in the age bracket of 20 to 34 years have the highest fertility rate with 77.0 births per 1,000 women. Women in the age bracket of 20 to 34 years acount for 81.8% of all women with births.
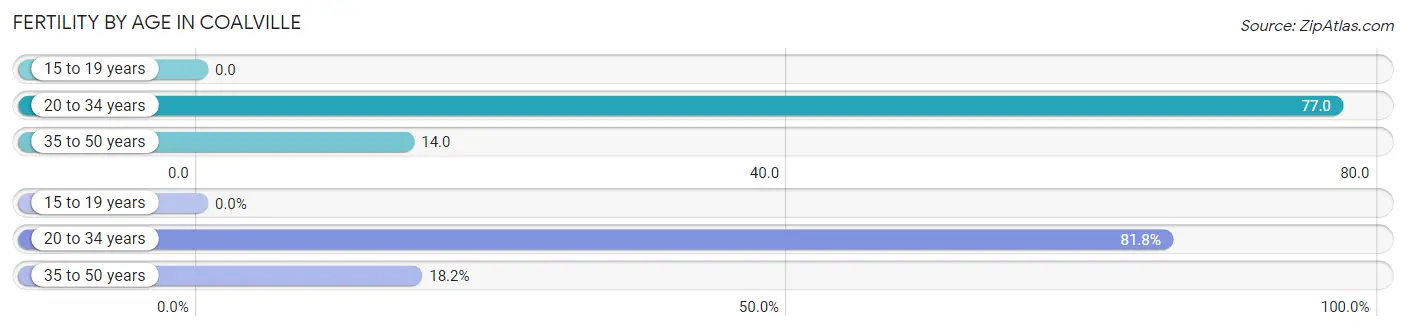
| Age Bracket | Women with Births | Births / 1,000 Women |
| 15 to 19 years | 0 (0.0%) | 0.0 |
| 20 to 34 years | 18 (81.8%) | 77.0 |
| 35 to 50 years | 4 (18.2%) | 14.0 |
| Total | 22 (100.0%) | 39.0 |
Fertility by Age by Marriage Status in Coalville
54.5% of women with births (22) in Coalville are married. The highest percentage of unmarried women with births falls into 20 to 34 years age bracket with 55.6% of them unmarried at the time of birth, while the lowest percentage of unmarried women with births belong to 35 to 50 years age bracket with 0.0% of them unmarried.
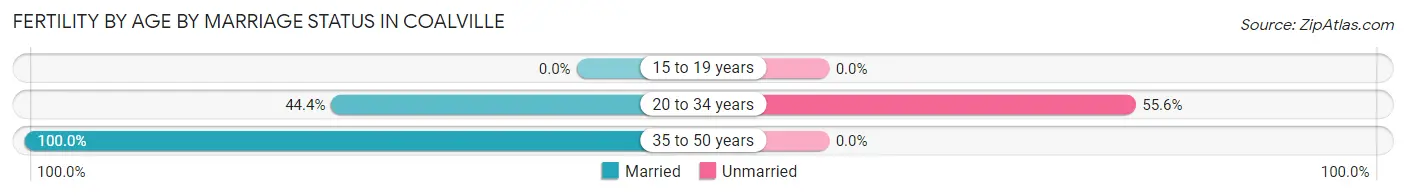
| Age Bracket | Married | Unmarried |
| 15 to 19 years | 0 (0.0%) | 0 (0.0%) |
| 20 to 34 years | 8 (44.4%) | 10 (55.6%) |
| 35 to 50 years | 4 (100.0%) | 0 (0.0%) |
| Total | 12 (54.5%) | 10 (45.5%) |
Fertility by Education in Coalville
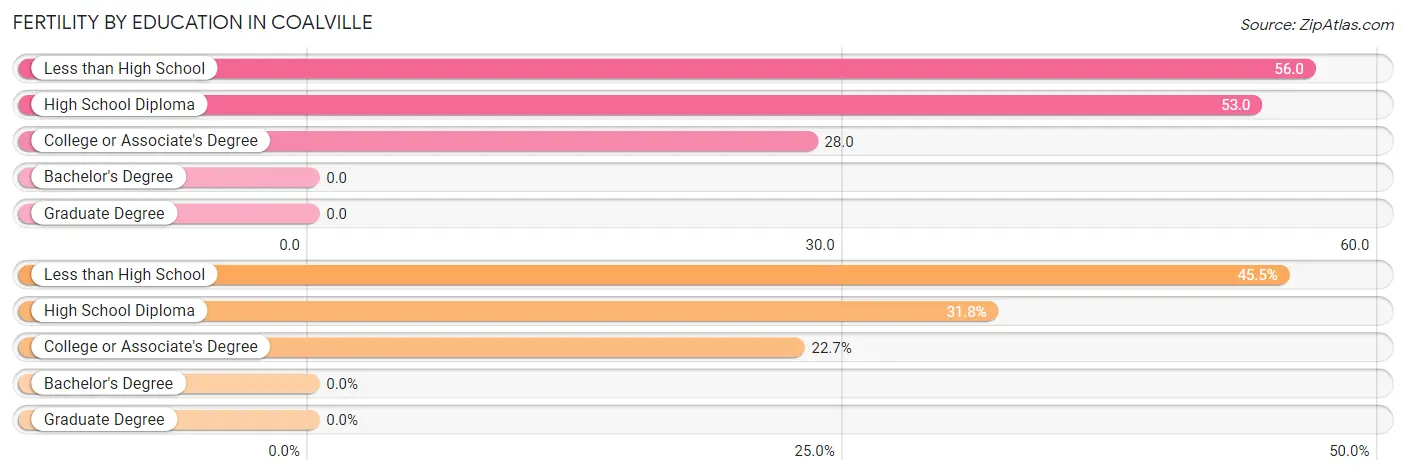
| Educational Attainment | Women with Births | Births / 1,000 Women |
| Less than High School | 10 (45.5%) | 56.0 |
| High School Diploma | 7 (31.8%) | 53.0 |
| College or Associate's Degree | 5 (22.7%) | 28.0 |
| Bachelor's Degree | 0 (0.0%) | 0.0 |
| Graduate Degree | 0 (0.0%) | 0.0 |
| Total | 22 (100.0%) | 39.0 |
Fertility by Education by Marriage Status in Coalville
45.5% of women with births in Coalville are unmarried. Women with the educational attainment of high school diploma are most likely to be married with 100.0% of them married at childbirth, while women with the educational attainment of less than high school are least likely to be married with 100.0% of them unmarried at childbirth.
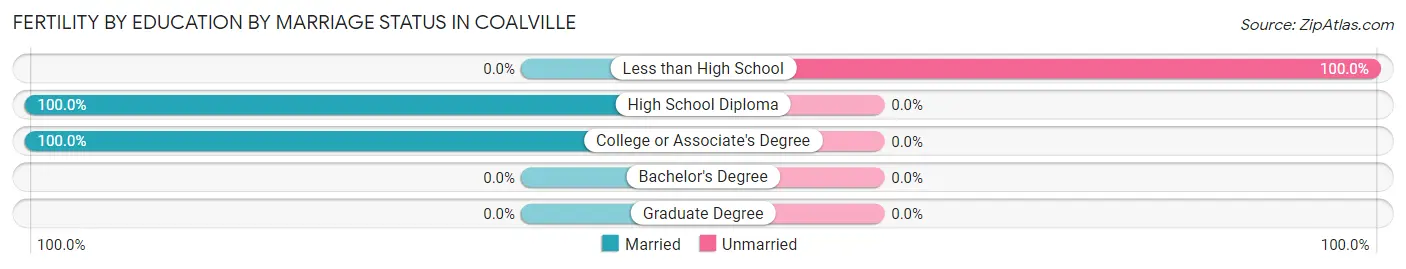
| Educational Attainment | Married | Unmarried |
| Less than High School | 0 (0.0%) | 10 (100.0%) |
| High School Diploma | 7 (100.0%) | 0 (0.0%) |
| College or Associate's Degree | 5 (100.0%) | 0 (0.0%) |
| Bachelor's Degree | 0 (0.0%) | 0 (0.0%) |
| Graduate Degree | 0 (0.0%) | 0 (0.0%) |
| Total | 12 (54.5%) | 10 (45.5%) |
Employment Characteristics in Coalville
Employment by Class of Employer in Coalville
Among the 1,078 employed individuals in Coalville, private company employees (803 | 74.5%), self-employed (not incorporated) (80 | 7.4%), and local government employees (51 | 4.7%) make up the most common classes of employment.
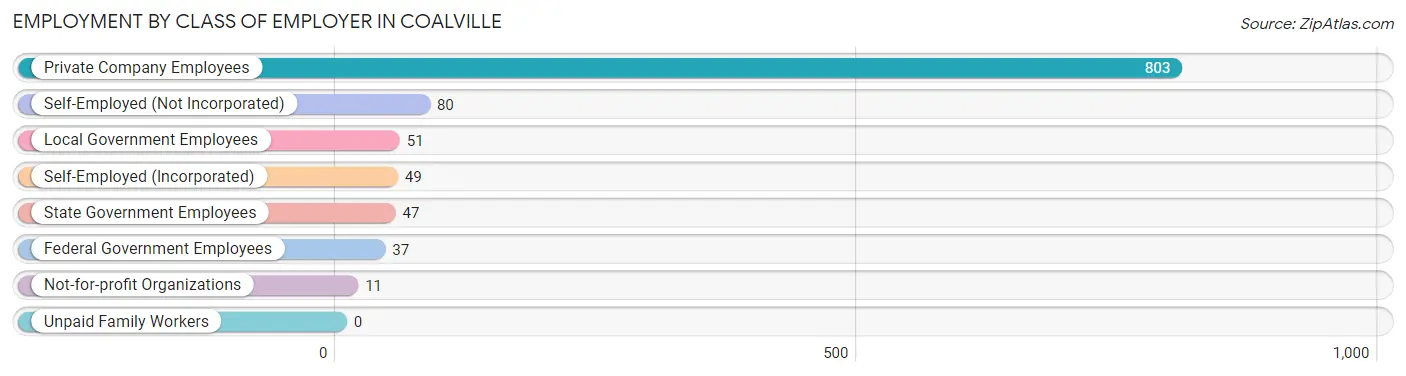
| Employer Class | # Employees | % Employees |
| Private Company Employees | 803 | 74.5% |
| Self-Employed (Incorporated) | 49 | 4.5% |
| Self-Employed (Not Incorporated) | 80 | 7.4% |
| Not-for-profit Organizations | 11 | 1.0% |
| Local Government Employees | 51 | 4.7% |
| State Government Employees | 47 | 4.4% |
| Federal Government Employees | 37 | 3.4% |
| Unpaid Family Workers | 0 | 0.0% |
| Total | 1,078 | 100.0% |
Employment Status by Age in Coalville
According to the labor force statistics for Coalville, out of the total population over 16 years of age (1,518), 73.2% or 1,111 individuals are in the labor force, with 2.4% or 27 of them unemployed. The age group with the highest labor force participation rate is 55 to 59 years, with 100.0% or 60 individuals in the labor force. Within the labor force, the 16 to 19 years age range has the highest percentage of unemployed individuals, with 16.4% or 12 of them being unemployed.
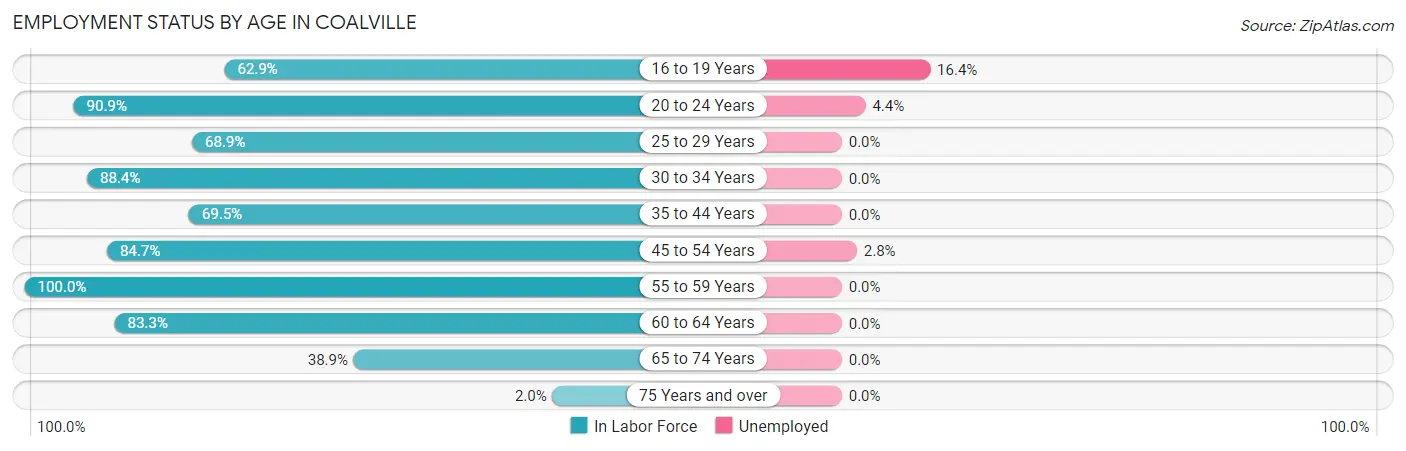
| Age Bracket | In Labor Force | Unemployed |
| 16 to 19 Years | 73 (62.9%) | 12 (16.4%) |
| 20 to 24 Years | 159 (90.9%) | 7 (4.4%) |
| 25 to 29 Years | 177 (68.9%) | 0 (0.0%) |
| 30 to 34 Years | 99 (88.4%) | 0 (0.0%) |
| 35 to 44 Years | 185 (69.5%) | 0 (0.0%) |
| 45 to 54 Years | 288 (84.7%) | 8 (2.8%) |
| 55 to 59 Years | 60 (100.0%) | 0 (0.0%) |
| 60 to 64 Years | 25 (83.3%) | 0 (0.0%) |
| 65 to 74 Years | 44 (38.9%) | 0 (0.0%) |
| 75 Years and over | 1 (2.0%) | 0 (0.0%) |
| Total | 1,111 (73.2%) | 27 (2.4%) |
Employment Status by Educational Attainment in Coalville
According to labor force statistics for Coalville, 78.3% of individuals (834) out of the total population between 25 and 64 years of age (1,065) are in the labor force, with 1.0% or 8 of them being unemployed. The group with the highest labor force participation rate are those with the educational attainment of bachelor's degree or higher, with 97.2% or 138 individuals in the labor force. Within the labor force, individuals with high school diploma education have the highest percentage of unemployment, with 3.9% or 8 of them being unemployed.
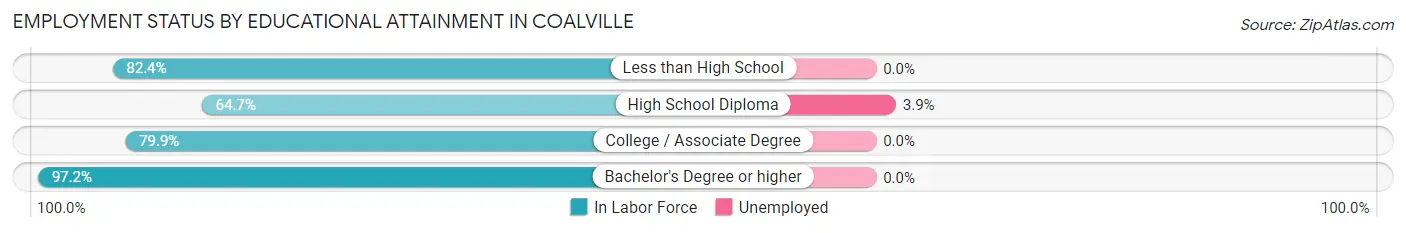
| Educational Attainment | In Labor Force | Unemployed |
| Less than High School | 238 (82.4%) | 0 (0.0%) |
| High School Diploma | 207 (64.7%) | 12 (3.9%) |
| College / Associate Degree | 251 (79.9%) | 0 (0.0%) |
| Bachelor's Degree or higher | 138 (97.2%) | 0 (0.0%) |
| Total | 834 (78.3%) | 11 (1.0%) |
Employment Occupations by Sex in Coalville
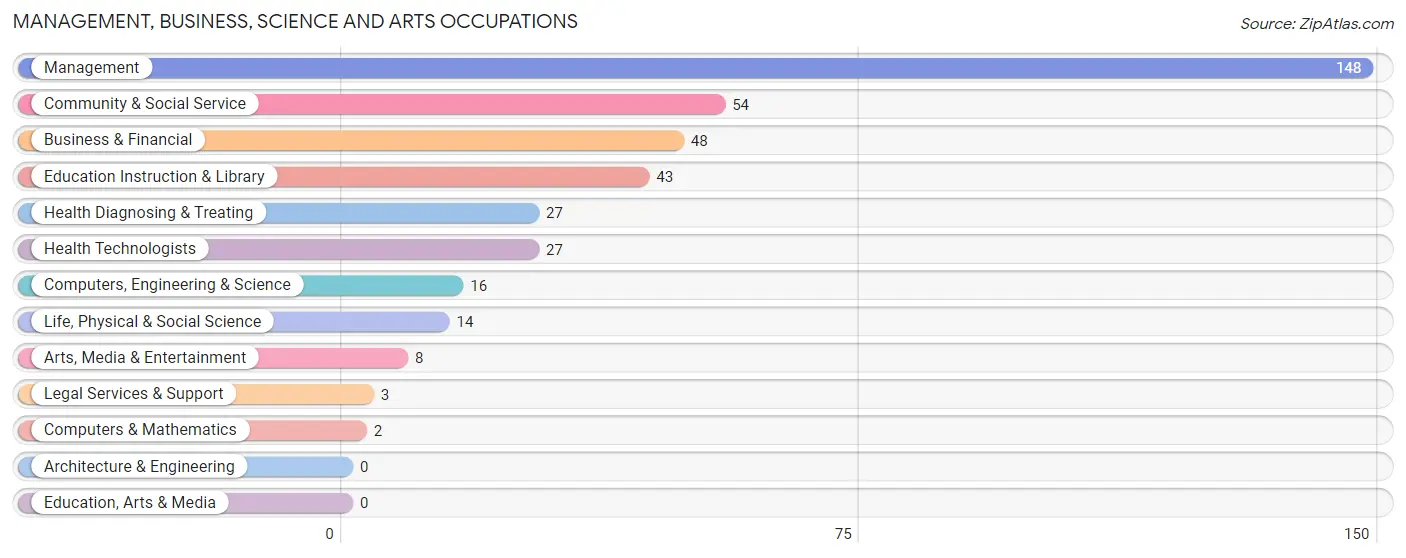
Management, Business, Science and Arts Occupations
The most common Management, Business, Science and Arts occupations in Coalville are Management (148 | 13.7%), Community & Social Service (54 | 5.0%), Business & Financial (48 | 4.4%), Education Instruction & Library (43 | 4.0%), and Health Diagnosing & Treating (27 | 2.5%).
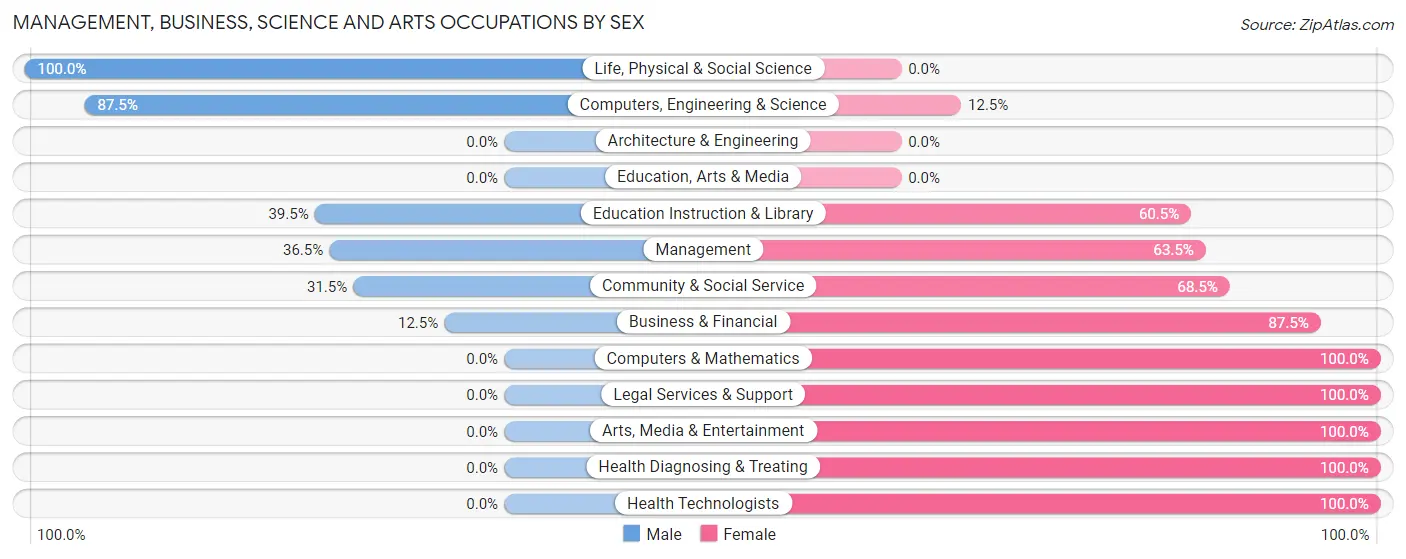
Management, Business, Science and Arts Occupations by Sex
Within the Management, Business, Science and Arts occupations in Coalville, the most male-oriented occupations are Life, Physical & Social Science (100.0%), Computers, Engineering & Science (87.5%), and Education Instruction & Library (39.5%), while the most female-oriented occupations are Computers & Mathematics (100.0%), Legal Services & Support (100.0%), and Arts, Media & Entertainment (100.0%).
| Occupation | Male | Female |
| Management | 54 (36.5%) | 94 (63.5%) |
| Business & Financial | 6 (12.5%) | 42 (87.5%) |
| Computers, Engineering & Science | 14 (87.5%) | 2 (12.5%) |
| Computers & Mathematics | 0 (0.0%) | 2 (100.0%) |
| Architecture & Engineering | 0 (0.0%) | 0 (0.0%) |
| Life, Physical & Social Science | 14 (100.0%) | 0 (0.0%) |
| Community & Social Service | 17 (31.5%) | 37 (68.5%) |
| Education, Arts & Media | 0 (0.0%) | 0 (0.0%) |
| Legal Services & Support | 0 (0.0%) | 3 (100.0%) |
| Education Instruction & Library | 17 (39.5%) | 26 (60.5%) |
| Arts, Media & Entertainment | 0 (0.0%) | 8 (100.0%) |
| Health Diagnosing & Treating | 0 (0.0%) | 27 (100.0%) |
| Health Technologists | 0 (0.0%) | 27 (100.0%) |
| Total (Category) | 91 (31.1%) | 202 (68.9%) |
| Total (Overall) | 588 (54.2%) | 496 (45.8%) |
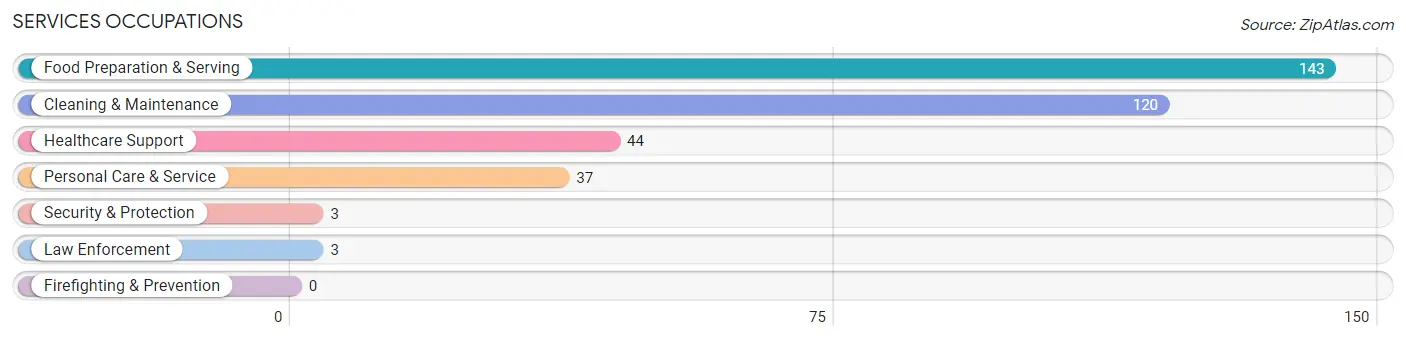
Services Occupations
The most common Services occupations in Coalville are Food Preparation & Serving (143 | 13.2%), Cleaning & Maintenance (120 | 11.1%), Healthcare Support (44 | 4.1%), Personal Care & Service (37 | 3.4%), and Security & Protection (3 | 0.3%).
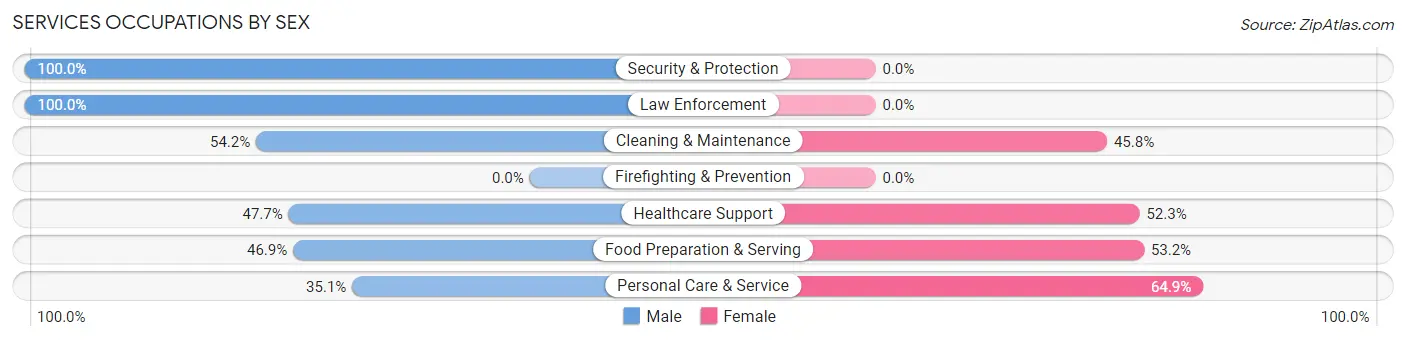
Services Occupations by Sex
Within the Services occupations in Coalville, the most male-oriented occupations are Security & Protection (100.0%), Law Enforcement (100.0%), and Cleaning & Maintenance (54.2%), while the most female-oriented occupations are Personal Care & Service (64.9%), Food Preparation & Serving (53.1%), and Healthcare Support (52.3%).
| Occupation | Male | Female |
| Healthcare Support | 21 (47.7%) | 23 (52.3%) |
| Security & Protection | 3 (100.0%) | 0 (0.0%) |
| Firefighting & Prevention | 0 (0.0%) | 0 (0.0%) |
| Law Enforcement | 3 (100.0%) | 0 (0.0%) |
| Food Preparation & Serving | 67 (46.9%) | 76 (53.1%) |
| Cleaning & Maintenance | 65 (54.2%) | 55 (45.8%) |
| Personal Care & Service | 13 (35.1%) | 24 (64.9%) |
| Total (Category) | 169 (48.7%) | 178 (51.3%) |
| Total (Overall) | 588 (54.2%) | 496 (45.8%) |
Sales and Office Occupations
The most common Sales and Office occupations in Coalville are Sales & Related (92 | 8.5%), and Office & Administration (78 | 7.2%).

Sales and Office Occupations by Sex

| Occupation | Male | Female |
| Sales & Related | 73 (79.3%) | 19 (20.6%) |
| Office & Administration | 28 (35.9%) | 50 (64.1%) |
| Total (Category) | 101 (59.4%) | 69 (40.6%) |
| Total (Overall) | 588 (54.2%) | 496 (45.8%) |
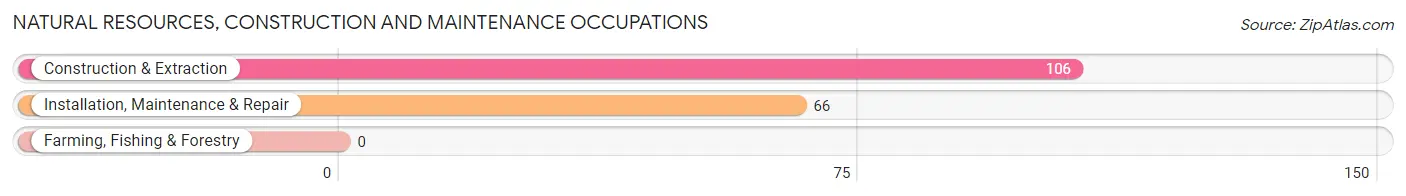
Natural Resources, Construction and Maintenance Occupations
The most common Natural Resources, Construction and Maintenance occupations in Coalville are Construction & Extraction (106 | 9.8%), and Installation, Maintenance & Repair (66 | 6.1%).
Natural Resources, Construction and Maintenance Occupations by Sex
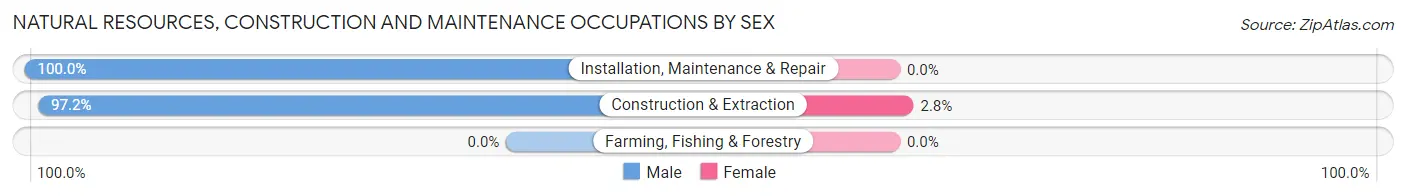
| Occupation | Male | Female |
| Farming, Fishing & Forestry | 0 (0.0%) | 0 (0.0%) |
| Construction & Extraction | 103 (97.2%) | 3 (2.8%) |
| Installation, Maintenance & Repair | 66 (100.0%) | 0 (0.0%) |
| Total (Category) | 169 (98.3%) | 3 (1.7%) |
| Total (Overall) | 588 (54.2%) | 496 (45.8%) |
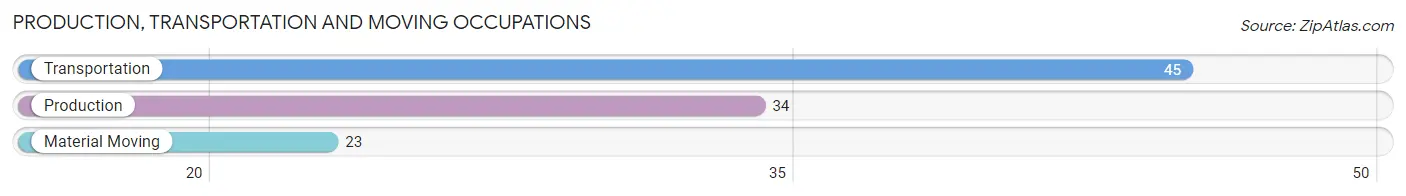
Production, Transportation and Moving Occupations
The most common Production, Transportation and Moving occupations in Coalville are Transportation (45 | 4.2%), Production (34 | 3.1%), and Material Moving (23 | 2.1%).
Production, Transportation and Moving Occupations by Sex
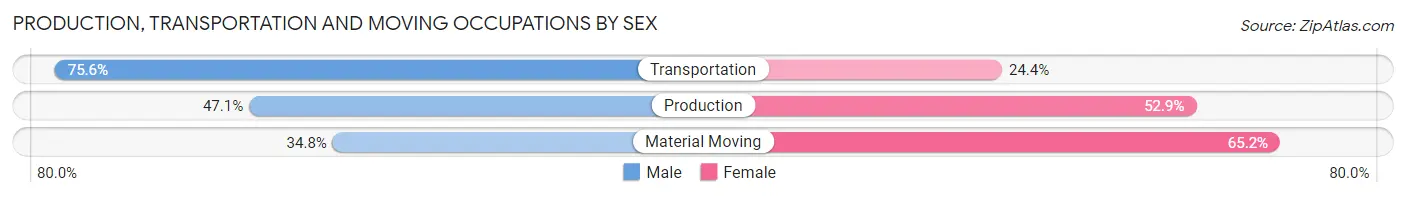
| Occupation | Male | Female |
| Production | 16 (47.1%) | 18 (52.9%) |
| Transportation | 34 (75.6%) | 11 (24.4%) |
| Material Moving | 8 (34.8%) | 15 (65.2%) |
| Total (Category) | 58 (56.9%) | 44 (43.1%) |
| Total (Overall) | 588 (54.2%) | 496 (45.8%) |
Employment Industries by Sex in Coalville
Employment Industries in Coalville
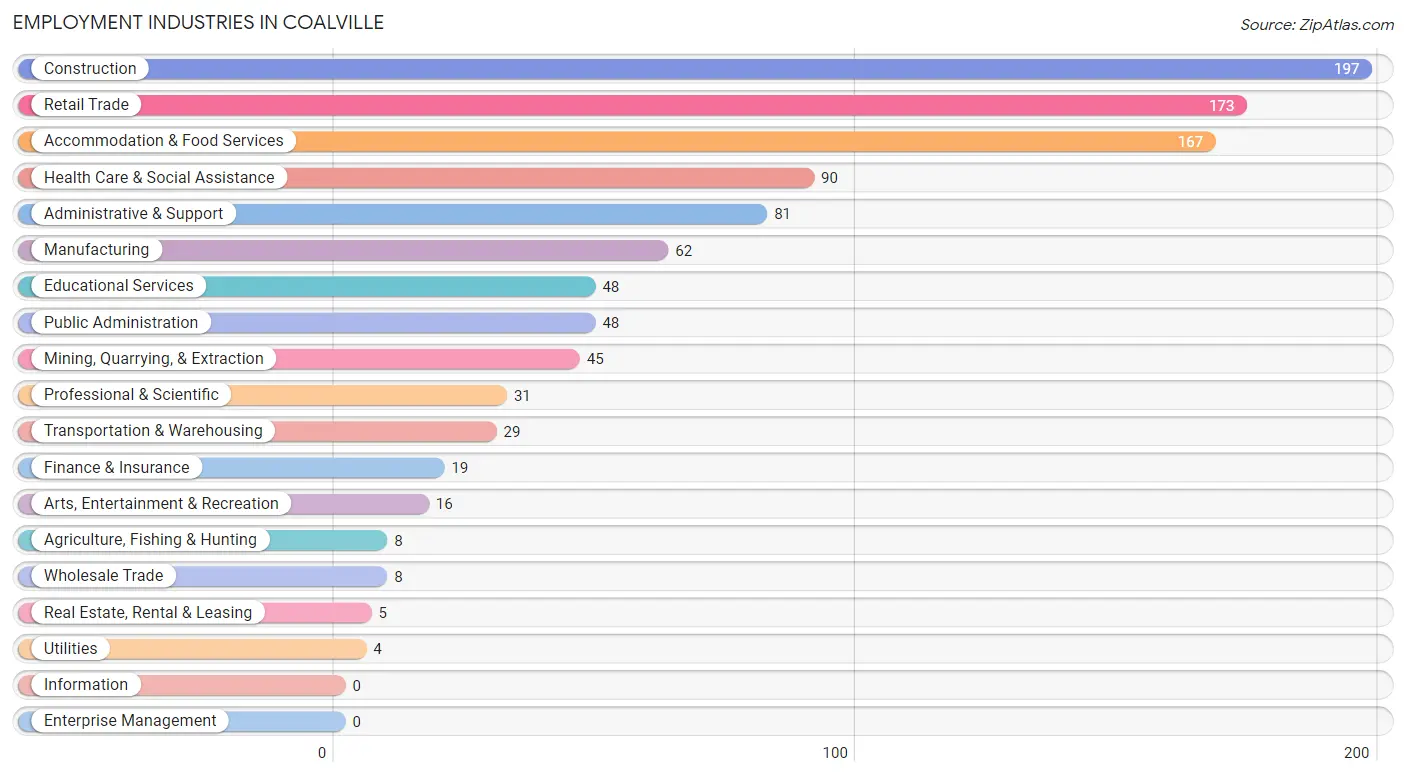
The major employment industries in Coalville include Construction (197 | 18.2%), Retail Trade (173 | 16.0%), Accommodation & Food Services (167 | 15.4%), Health Care & Social Assistance (90 | 8.3%), and Administrative & Support (81 | 7.5%).
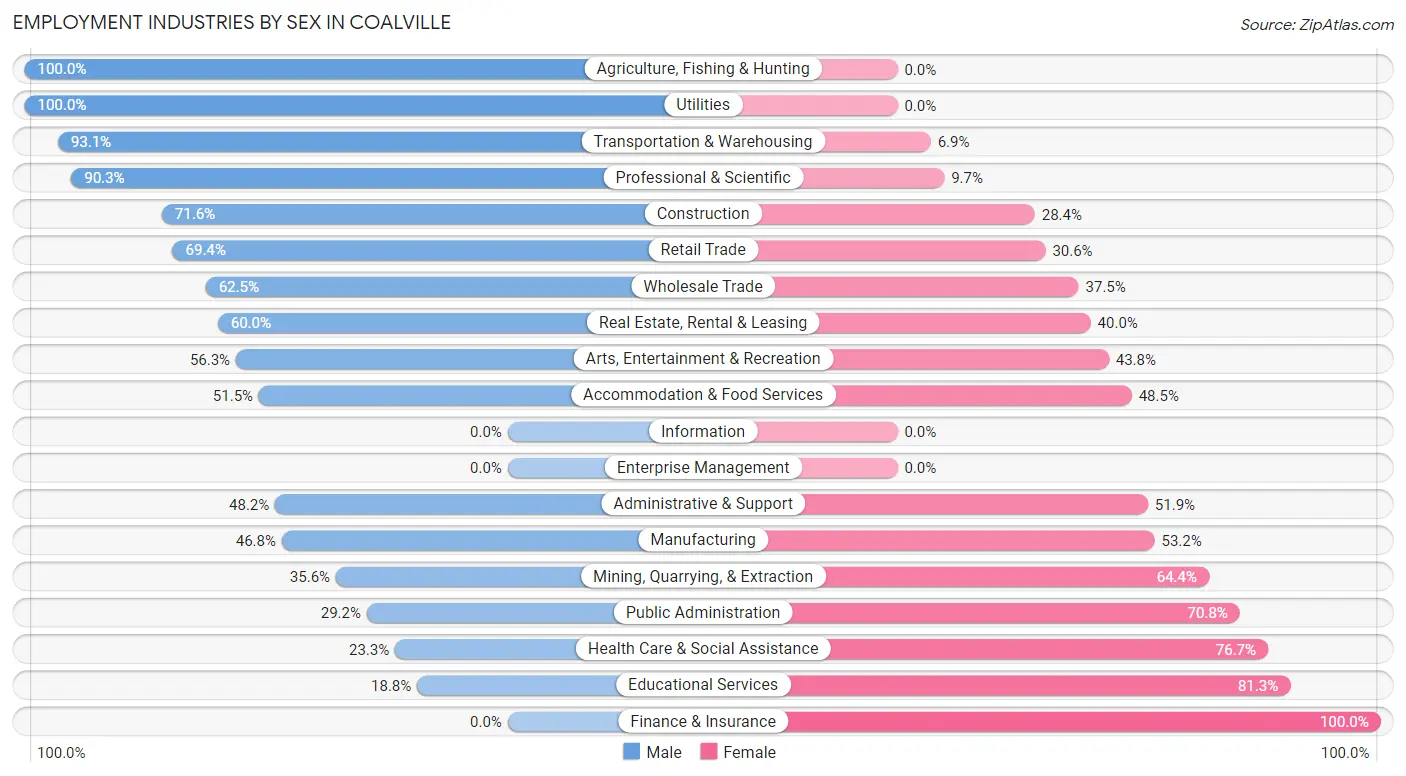
Employment Industries by Sex in Coalville
The Coalville industries that see more men than women are Agriculture, Fishing & Hunting (100.0%), Utilities (100.0%), and Transportation & Warehousing (93.1%), whereas the industries that tend to have a higher number of women are Finance & Insurance (100.0%), Educational Services (81.2%), and Health Care & Social Assistance (76.7%).
| Industry | Male | Female |
| Agriculture, Fishing & Hunting | 8 (100.0%) | 0 (0.0%) |
| Mining, Quarrying, & Extraction | 16 (35.6%) | 29 (64.4%) |
| Construction | 141 (71.6%) | 56 (28.4%) |
| Manufacturing | 29 (46.8%) | 33 (53.2%) |
| Wholesale Trade | 5 (62.5%) | 3 (37.5%) |
| Retail Trade | 120 (69.4%) | 53 (30.6%) |
| Transportation & Warehousing | 27 (93.1%) | 2 (6.9%) |
| Utilities | 4 (100.0%) | 0 (0.0%) |
| Information | 0 (0.0%) | 0 (0.0%) |
| Finance & Insurance | 0 (0.0%) | 19 (100.0%) |
| Real Estate, Rental & Leasing | 3 (60.0%) | 2 (40.0%) |
| Professional & Scientific | 28 (90.3%) | 3 (9.7%) |
| Enterprise Management | 0 (0.0%) | 0 (0.0%) |
| Administrative & Support | 39 (48.1%) | 42 (51.8%) |
| Educational Services | 9 (18.8%) | 39 (81.2%) |
| Health Care & Social Assistance | 21 (23.3%) | 69 (76.7%) |
| Arts, Entertainment & Recreation | 9 (56.2%) | 7 (43.8%) |
| Accommodation & Food Services | 86 (51.5%) | 81 (48.5%) |
| Public Administration | 14 (29.2%) | 34 (70.8%) |
| Total | 588 (54.2%) | 496 (45.8%) |
Education in Coalville
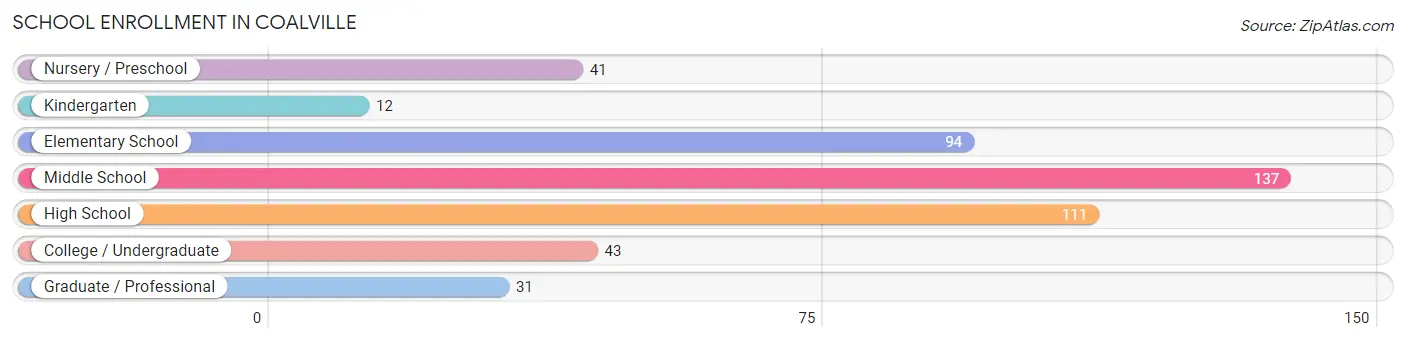
School Enrollment in Coalville
The most common levels of schooling among the 469 students in Coalville are middle school (137 | 29.2%), high school (111 | 23.7%), and elementary school (94 | 20.0%).
| School Level | # Students | % Students |
| Nursery / Preschool | 41 | 8.7% |
| Kindergarten | 12 | 2.6% |
| Elementary School | 94 | 20.0% |
| Middle School | 137 | 29.2% |
| High School | 111 | 23.7% |
| College / Undergraduate | 43 | 9.2% |
| Graduate / Professional | 31 | 6.6% |
| Total | 469 | 100.0% |
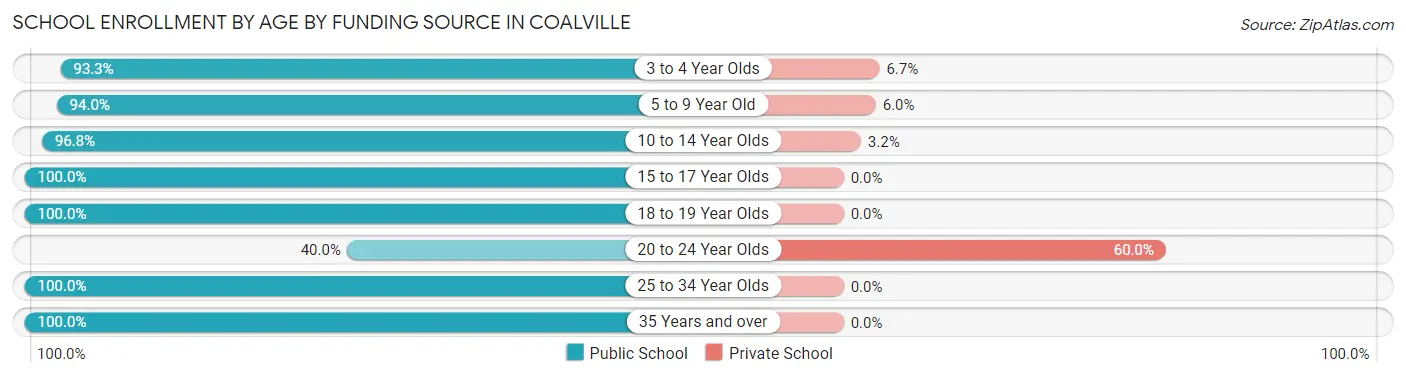
School Enrollment by Age by Funding Source in Coalville
Out of a total of 469 students who are enrolled in schools in Coalville, 29 (6.2%) attend a private institution, while the remaining 440 (93.8%) are enrolled in public schools. The age group of 20 to 24 year olds has the highest likelihood of being enrolled in private schools, with 15 (60.0% in the age bracket) enrolled. Conversely, the age group of 15 to 17 year olds has the lowest likelihood of being enrolled in a private school, with 79 (100.0% in the age bracket) attending a public institution.
| Age Bracket | Public School | Private School |
| 3 to 4 Year Olds | 28 (93.3%) | 2 (6.7%) |
| 5 to 9 Year Old | 110 (94.0%) | 7 (6.0%) |
| 10 to 14 Year Olds | 151 (96.8%) | 5 (3.2%) |
| 15 to 17 Year Olds | 79 (100.0%) | 0 (0.0%) |
| 18 to 19 Year Olds | 11 (100.0%) | 0 (0.0%) |
| 20 to 24 Year Olds | 10 (40.0%) | 15 (60.0%) |
| 25 to 34 Year Olds | 25 (100.0%) | 0 (0.0%) |
| 35 Years and over | 26 (100.0%) | 0 (0.0%) |
| Total | 440 (93.8%) | 29 (6.2%) |
Educational Attainment by Field of Study in Coalville
Business (39 | 18.7%), education (32 | 15.3%), engineering (20 | 9.6%), computers & mathematics (19 | 9.1%), and arts & humanities (19 | 9.1%) are the most common fields of study among 209 individuals in Coalville who have obtained a bachelor's degree or higher.
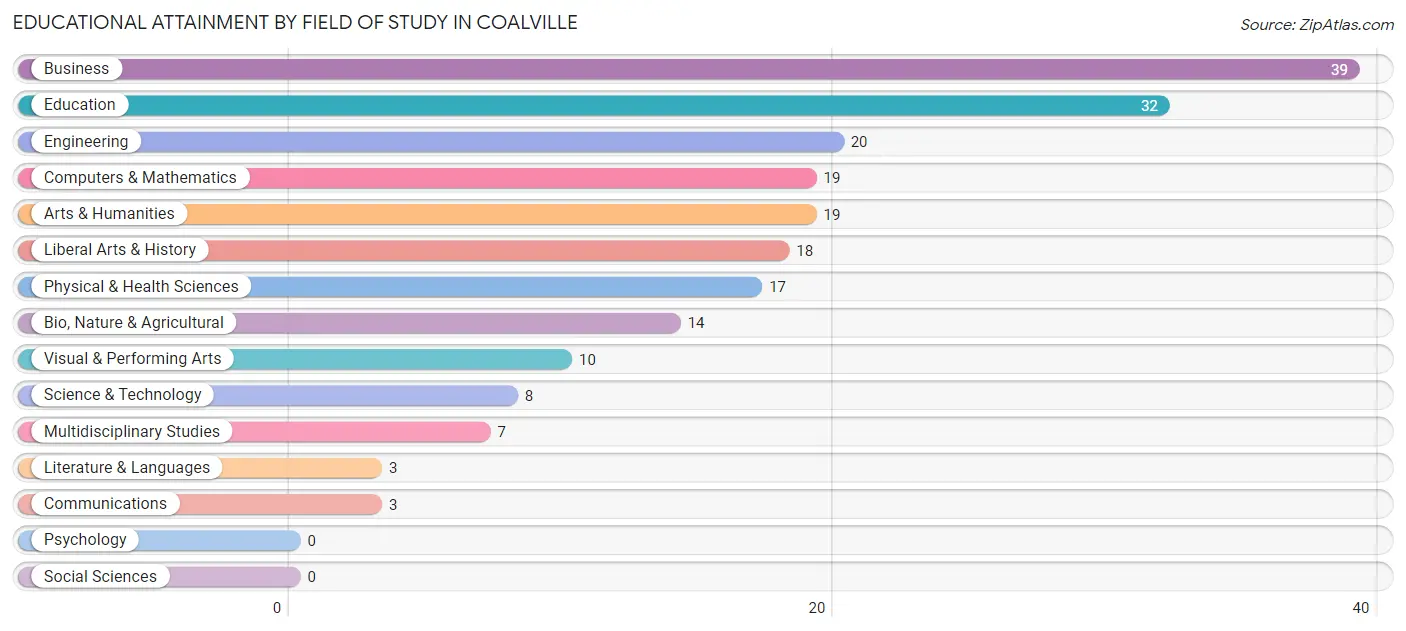
| Field of Study | # Graduates | % Graduates |
| Computers & Mathematics | 19 | 9.1% |
| Bio, Nature & Agricultural | 14 | 6.7% |
| Physical & Health Sciences | 17 | 8.1% |
| Psychology | 0 | 0.0% |
| Social Sciences | 0 | 0.0% |
| Engineering | 20 | 9.6% |
| Multidisciplinary Studies | 7 | 3.4% |
| Science & Technology | 8 | 3.8% |
| Business | 39 | 18.7% |
| Education | 32 | 15.3% |
| Literature & Languages | 3 | 1.4% |
| Liberal Arts & History | 18 | 8.6% |
| Visual & Performing Arts | 10 | 4.8% |
| Communications | 3 | 1.4% |
| Arts & Humanities | 19 | 9.1% |
| Total | 209 | 100.0% |
Transportation & Commute in Coalville
Vehicle Availability by Sex in Coalville
The most prevalent vehicle ownership categories in Coalville are males with 2 vehicles (192, accounting for 32.7%) and females with 2 vehicles (142, making up 39.2%).
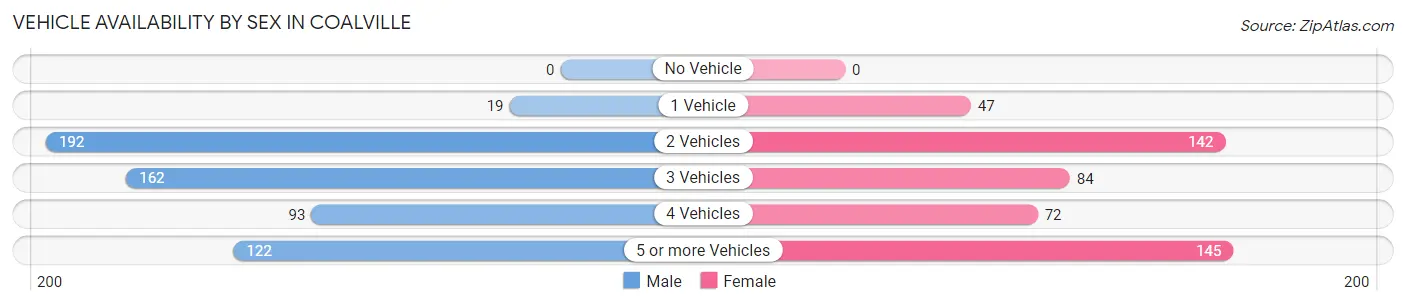
| Vehicles Available | Male | Female |
| No Vehicle | 0 (0.0%) | 0 (0.0%) |
| 1 Vehicle | 19 (3.2%) | 47 (9.6%) |
| 2 Vehicles | 192 (32.7%) | 142 (29.0%) |
| 3 Vehicles | 162 (27.6%) | 84 (17.1%) |
| 4 Vehicles | 93 (15.8%) | 72 (14.7%) |
| 5 or more Vehicles | 122 (20.7%) | 145 (29.6%) |
| Total | 588 (100.0%) | 490 (100.0%) |
Commute Time in Coalville
The most frequently occuring commute durations in Coalville are 30 to 34 minutes (258 commuters, 25.3%), 25 to 29 minutes (230 commuters, 22.6%), and 20 to 24 minutes (182 commuters, 17.8%).
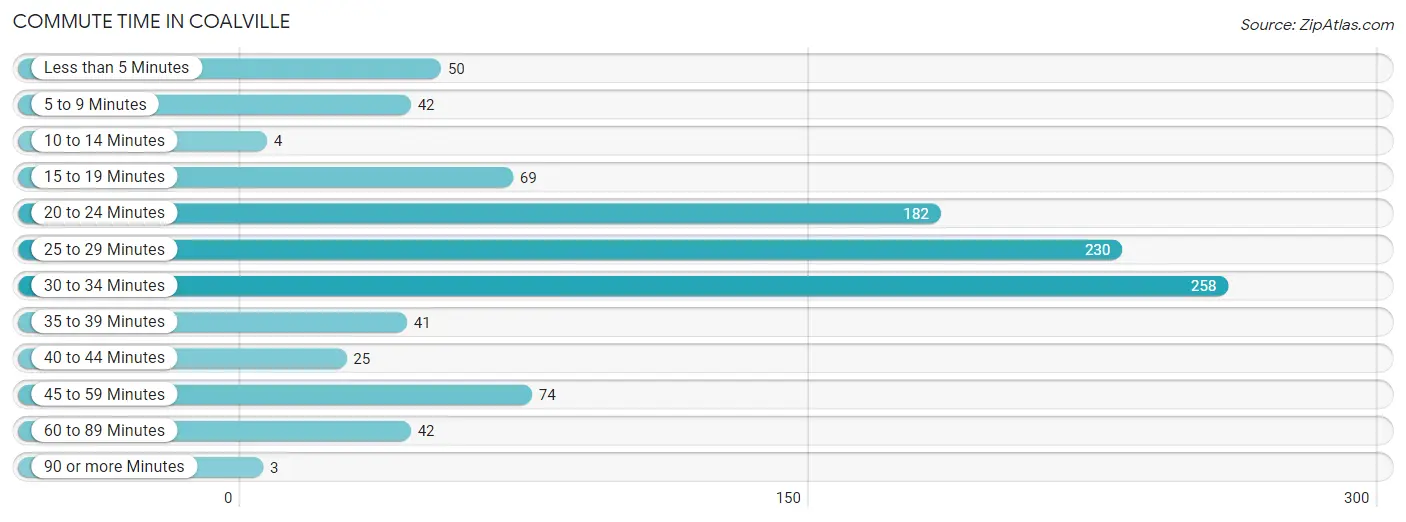
| Commute Time | # Commuters | % Commuters |
| Less than 5 Minutes | 50 | 4.9% |
| 5 to 9 Minutes | 42 | 4.1% |
| 10 to 14 Minutes | 4 | 0.4% |
| 15 to 19 Minutes | 69 | 6.8% |
| 20 to 24 Minutes | 182 | 17.8% |
| 25 to 29 Minutes | 230 | 22.6% |
| 30 to 34 Minutes | 258 | 25.3% |
| 35 to 39 Minutes | 41 | 4.0% |
| 40 to 44 Minutes | 25 | 2.5% |
| 45 to 59 Minutes | 74 | 7.2% |
| 60 to 89 Minutes | 42 | 4.1% |
| 90 or more Minutes | 3 | 0.3% |
Commute Time by Sex in Coalville
The most common commute times in Coalville are 30 to 34 minutes (157 commuters, 28.3%) for males and 25 to 29 minutes (119 commuters, 25.6%) for females.
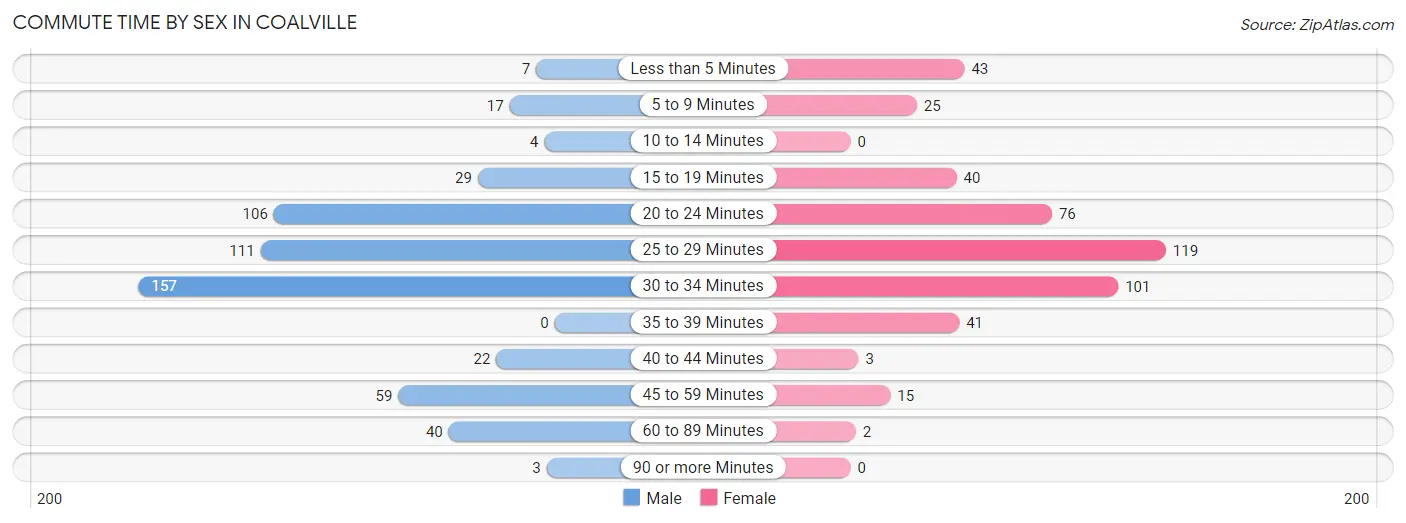
| Commute Time | Male | Female |
| Less than 5 Minutes | 7 (1.3%) | 43 (9.2%) |
| 5 to 9 Minutes | 17 (3.1%) | 25 (5.4%) |
| 10 to 14 Minutes | 4 (0.7%) | 0 (0.0%) |
| 15 to 19 Minutes | 29 (5.2%) | 40 (8.6%) |
| 20 to 24 Minutes | 106 (19.1%) | 76 (16.3%) |
| 25 to 29 Minutes | 111 (20.0%) | 119 (25.6%) |
| 30 to 34 Minutes | 157 (28.3%) | 101 (21.7%) |
| 35 to 39 Minutes | 0 (0.0%) | 41 (8.8%) |
| 40 to 44 Minutes | 22 (4.0%) | 3 (0.6%) |
| 45 to 59 Minutes | 59 (10.6%) | 15 (3.2%) |
| 60 to 89 Minutes | 40 (7.2%) | 2 (0.4%) |
| 90 or more Minutes | 3 (0.5%) | 0 (0.0%) |
Time of Departure to Work by Sex in Coalville
The most frequent times of departure to work in Coalville are 7:00 AM to 7:29 AM (101, 18.2%) for males and 7:00 AM to 7:29 AM (98, 21.1%) for females.
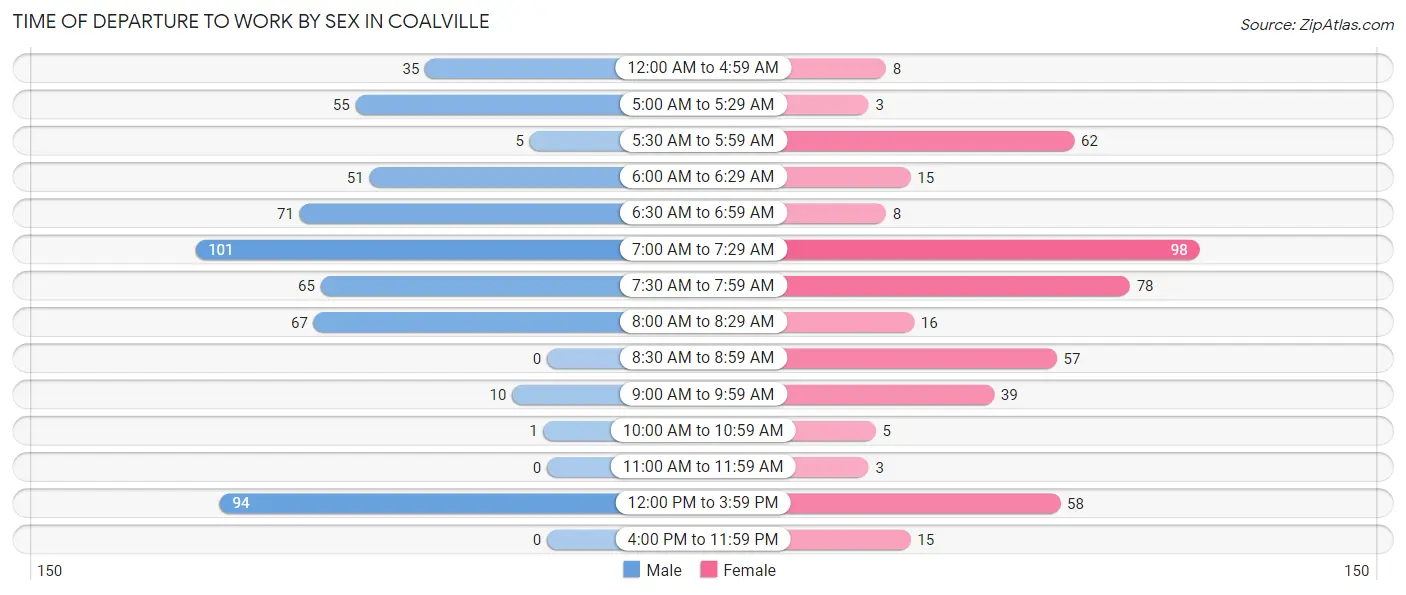
| Time of Departure | Male | Female |
| 12:00 AM to 4:59 AM | 35 (6.3%) | 8 (1.7%) |
| 5:00 AM to 5:29 AM | 55 (9.9%) | 3 (0.6%) |
| 5:30 AM to 5:59 AM | 5 (0.9%) | 62 (13.3%) |
| 6:00 AM to 6:29 AM | 51 (9.2%) | 15 (3.2%) |
| 6:30 AM to 6:59 AM | 71 (12.8%) | 8 (1.7%) |
| 7:00 AM to 7:29 AM | 101 (18.2%) | 98 (21.1%) |
| 7:30 AM to 7:59 AM | 65 (11.7%) | 78 (16.8%) |
| 8:00 AM to 8:29 AM | 67 (12.1%) | 16 (3.4%) |
| 8:30 AM to 8:59 AM | 0 (0.0%) | 57 (12.3%) |
| 9:00 AM to 9:59 AM | 10 (1.8%) | 39 (8.4%) |
| 10:00 AM to 10:59 AM | 1 (0.2%) | 5 (1.1%) |
| 11:00 AM to 11:59 AM | 0 (0.0%) | 3 (0.6%) |
| 12:00 PM to 3:59 PM | 94 (16.9%) | 58 (12.5%) |
| 4:00 PM to 11:59 PM | 0 (0.0%) | 15 (3.2%) |
| Total | 555 (100.0%) | 465 (100.0%) |
Housing Occupancy in Coalville
Occupancy by Ownership in Coalville
Of the total 475 dwellings in Coalville, owner-occupied units account for 317 (66.7%), while renter-occupied units make up 158 (33.3%).
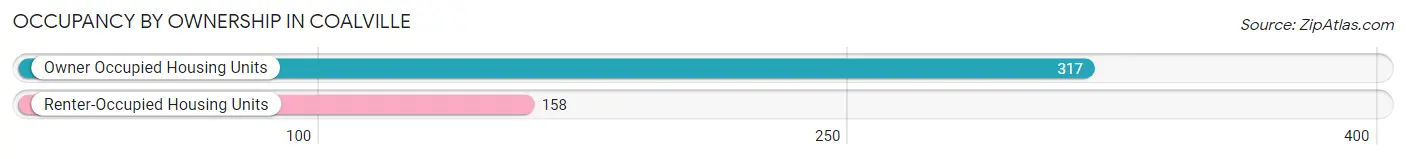
| Occupancy | # Housing Units | % Housing Units |
| Owner Occupied Housing Units | 317 | 66.7% |
| Renter-Occupied Housing Units | 158 | 33.3% |
| Total Occupied Housing Units | 475 | 100.0% |
Occupancy by Household Size in Coalville
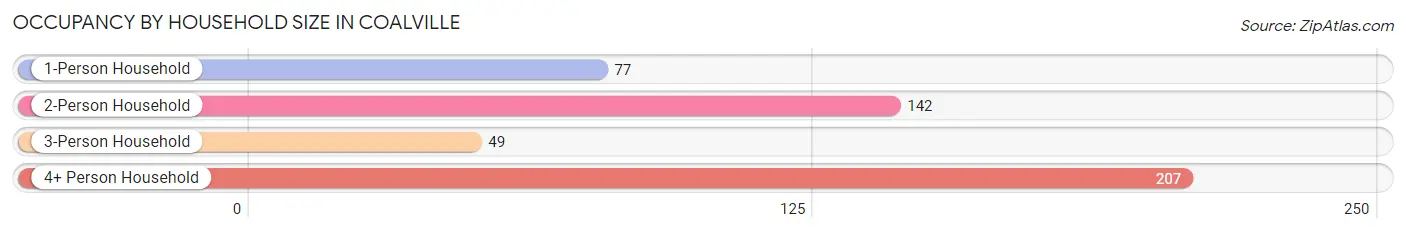
| Household Size | # Housing Units | % Housing Units |
| 1-Person Household | 77 | 16.2% |
| 2-Person Household | 142 | 29.9% |
| 3-Person Household | 49 | 10.3% |
| 4+ Person Household | 207 | 43.6% |
| Total Housing Units | 475 | 100.0% |
Occupancy by Ownership by Household Size in Coalville
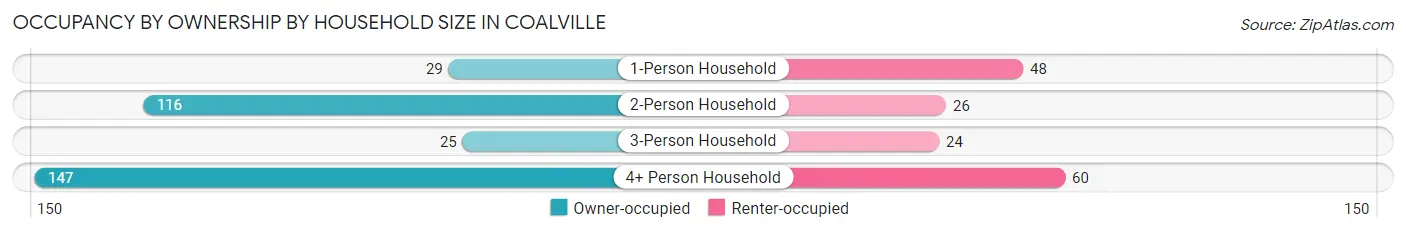
| Household Size | Owner-occupied | Renter-occupied |
| 1-Person Household | 29 (37.7%) | 48 (62.3%) |
| 2-Person Household | 116 (81.7%) | 26 (18.3%) |
| 3-Person Household | 25 (51.0%) | 24 (49.0%) |
| 4+ Person Household | 147 (71.0%) | 60 (29.0%) |
| Total Housing Units | 317 (66.7%) | 158 (33.3%) |
Occupancy by Educational Attainment in Coalville
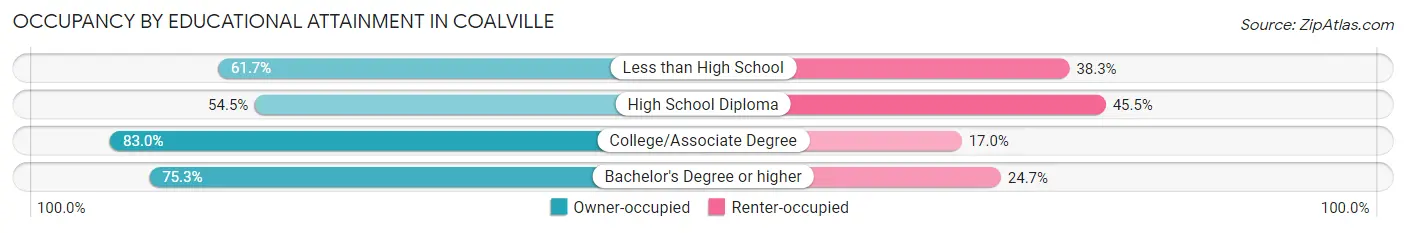
| Household Size | Owner-occupied | Renter-occupied |
| Less than High School | 66 (61.7%) | 41 (38.3%) |
| High School Diploma | 91 (54.5%) | 76 (45.5%) |
| College/Associate Degree | 93 (83.0%) | 19 (17.0%) |
| Bachelor's Degree or higher | 67 (75.3%) | 22 (24.7%) |
Occupancy by Age of Householder in Coalville
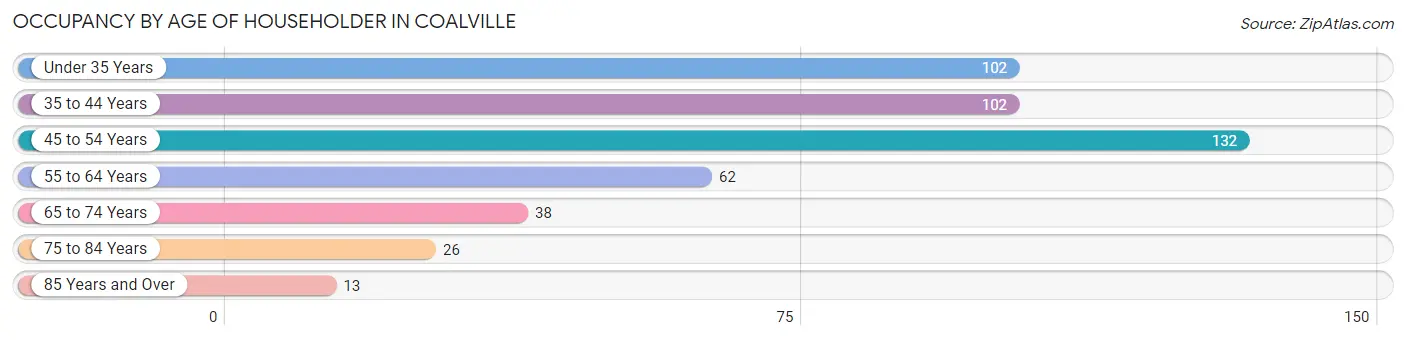
| Age Bracket | # Households | % Households |
| Under 35 Years | 102 | 21.5% |
| 35 to 44 Years | 102 | 21.5% |
| 45 to 54 Years | 132 | 27.8% |
| 55 to 64 Years | 62 | 13.1% |
| 65 to 74 Years | 38 | 8.0% |
| 75 to 84 Years | 26 | 5.5% |
| 85 Years and Over | 13 | 2.7% |
| Total | 475 | 100.0% |
Housing Finances in Coalville
Median Income by Occupancy in Coalville
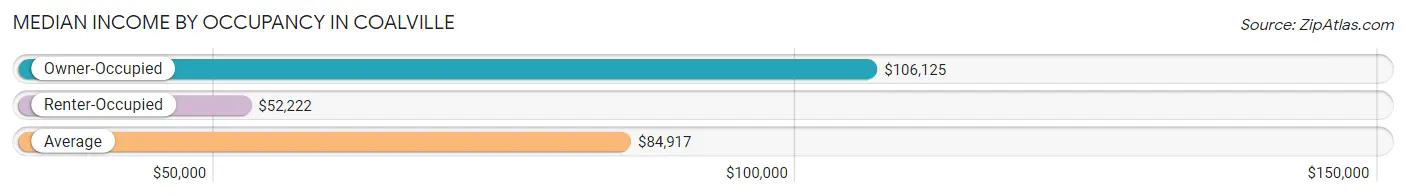
| Occupancy Type | # Households | Median Income |
| Owner-Occupied | 317 (66.7%) | $106,125 |
| Renter-Occupied | 158 (33.3%) | $52,222 |
| Average | 475 (100.0%) | $84,917 |
Occupancy by Householder Income Bracket in Coalville
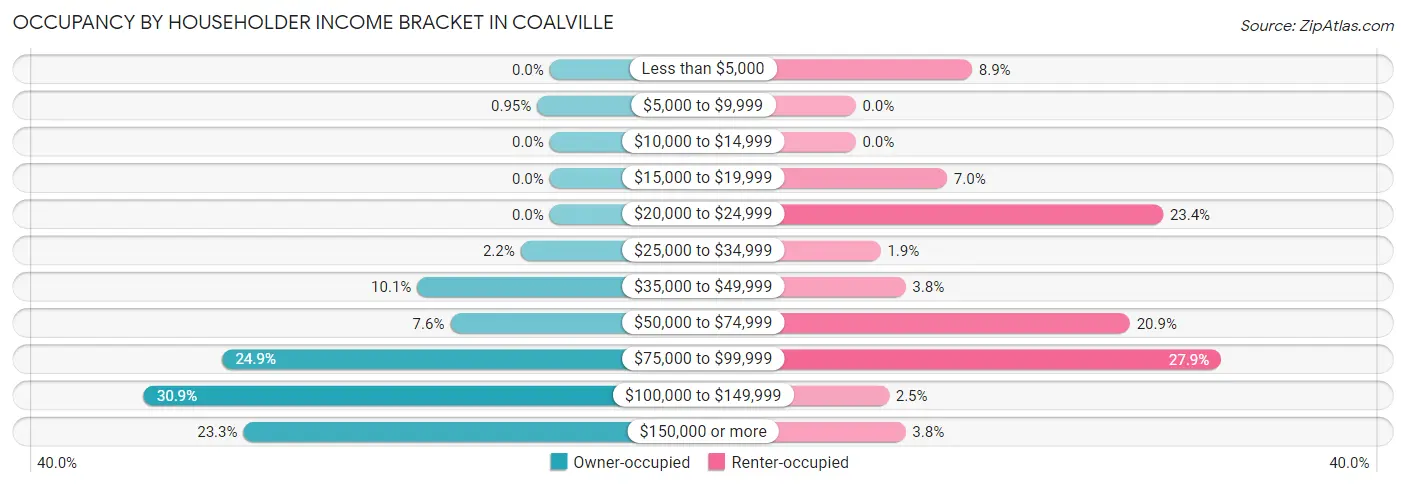
| Income Bracket | Owner-occupied | Renter-occupied |
| Less than $5,000 | 0 (0.0%) | 14 (8.9%) |
| $5,000 to $9,999 | 3 (0.9%) | 0 (0.0%) |
| $10,000 to $14,999 | 0 (0.0%) | 0 (0.0%) |
| $15,000 to $19,999 | 0 (0.0%) | 11 (7.0%) |
| $20,000 to $24,999 | 0 (0.0%) | 37 (23.4%) |
| $25,000 to $34,999 | 7 (2.2%) | 3 (1.9%) |
| $35,000 to $49,999 | 32 (10.1%) | 6 (3.8%) |
| $50,000 to $74,999 | 24 (7.6%) | 33 (20.9%) |
| $75,000 to $99,999 | 79 (24.9%) | 44 (27.9%) |
| $100,000 to $149,999 | 98 (30.9%) | 4 (2.5%) |
| $150,000 or more | 74 (23.3%) | 6 (3.8%) |
| Total | 317 (100.0%) | 158 (100.0%) |
Monthly Housing Cost Tiers in Coalville
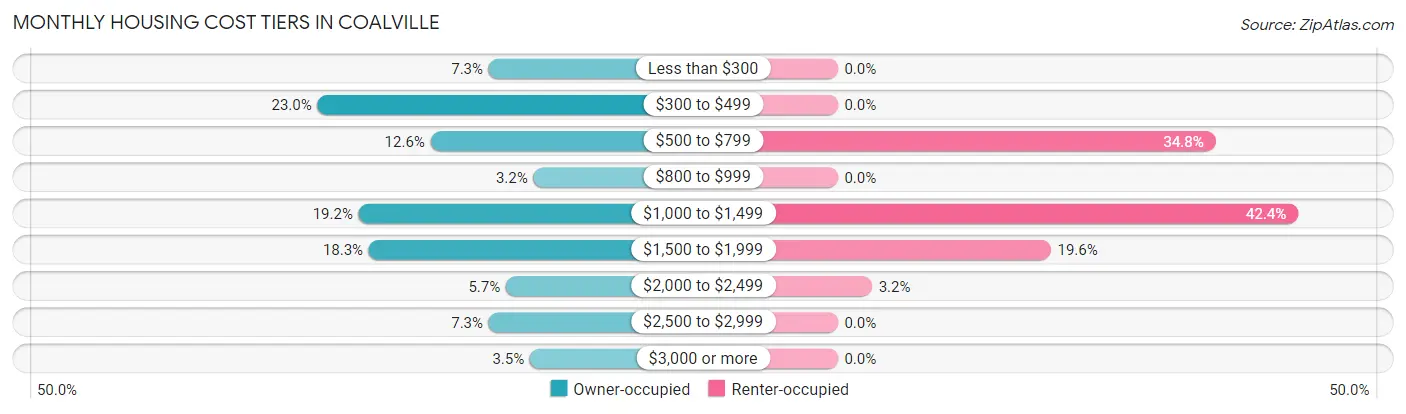
| Monthly Cost | Owner-occupied | Renter-occupied |
| Less than $300 | 23 (7.3%) | 0 (0.0%) |
| $300 to $499 | 73 (23.0%) | 0 (0.0%) |
| $500 to $799 | 40 (12.6%) | 55 (34.8%) |
| $800 to $999 | 10 (3.2%) | 0 (0.0%) |
| $1,000 to $1,499 | 61 (19.2%) | 67 (42.4%) |
| $1,500 to $1,999 | 58 (18.3%) | 31 (19.6%) |
| $2,000 to $2,499 | 18 (5.7%) | 5 (3.2%) |
| $2,500 to $2,999 | 23 (7.3%) | 0 (0.0%) |
| $3,000 or more | 11 (3.5%) | 0 (0.0%) |
| Total | 317 (100.0%) | 158 (100.0%) |
Physical Housing Characteristics in Coalville
Housing Structures in Coalville
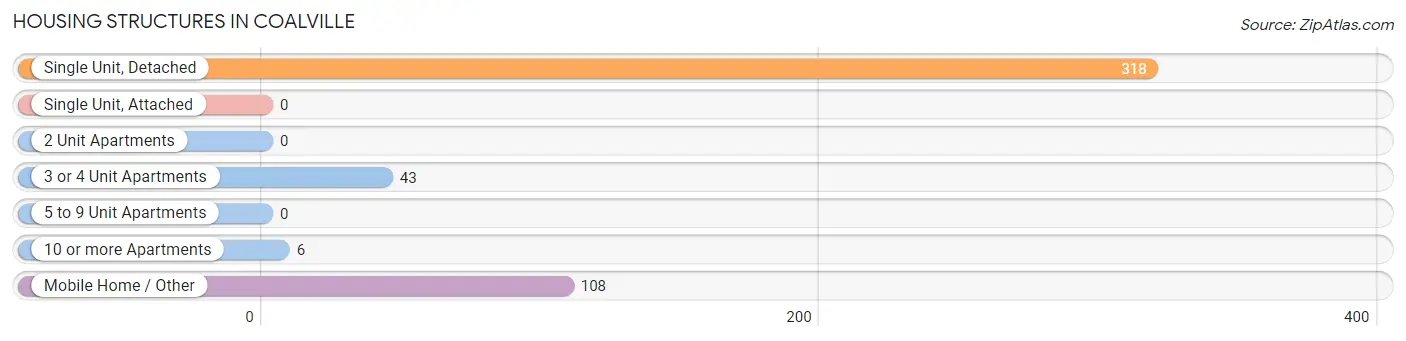
| Structure Type | # Housing Units | % Housing Units |
| Single Unit, Detached | 318 | 66.9% |
| Single Unit, Attached | 0 | 0.0% |
| 2 Unit Apartments | 0 | 0.0% |
| 3 or 4 Unit Apartments | 43 | 9.0% |
| 5 to 9 Unit Apartments | 0 | 0.0% |
| 10 or more Apartments | 6 | 1.3% |
| Mobile Home / Other | 108 | 22.7% |
| Total | 475 | 100.0% |
Housing Structures by Occupancy in Coalville
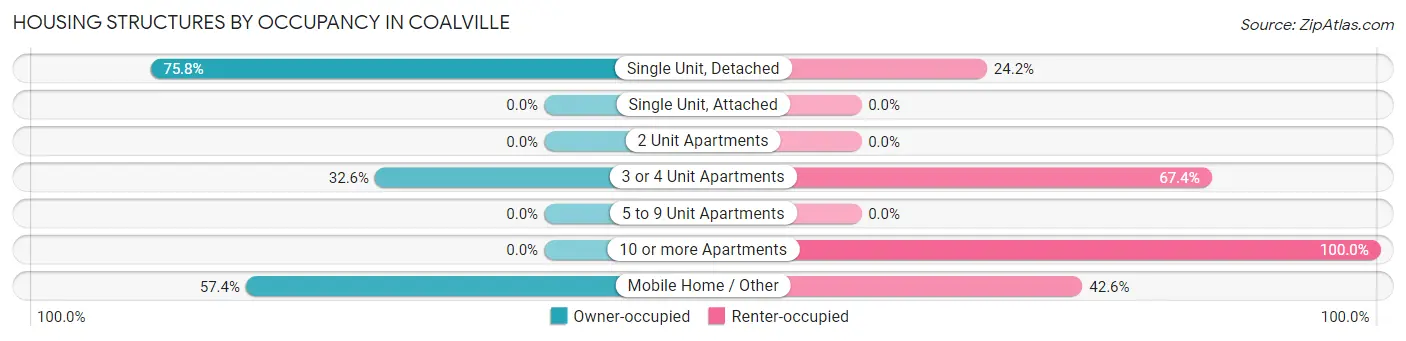
| Structure Type | Owner-occupied | Renter-occupied |
| Single Unit, Detached | 241 (75.8%) | 77 (24.2%) |
| Single Unit, Attached | 0 (0.0%) | 0 (0.0%) |
| 2 Unit Apartments | 0 (0.0%) | 0 (0.0%) |
| 3 or 4 Unit Apartments | 14 (32.6%) | 29 (67.4%) |
| 5 to 9 Unit Apartments | 0 (0.0%) | 0 (0.0%) |
| 10 or more Apartments | 0 (0.0%) | 6 (100.0%) |
| Mobile Home / Other | 62 (57.4%) | 46 (42.6%) |
| Total | 317 (66.7%) | 158 (33.3%) |
Housing Structures by Number of Rooms in Coalville
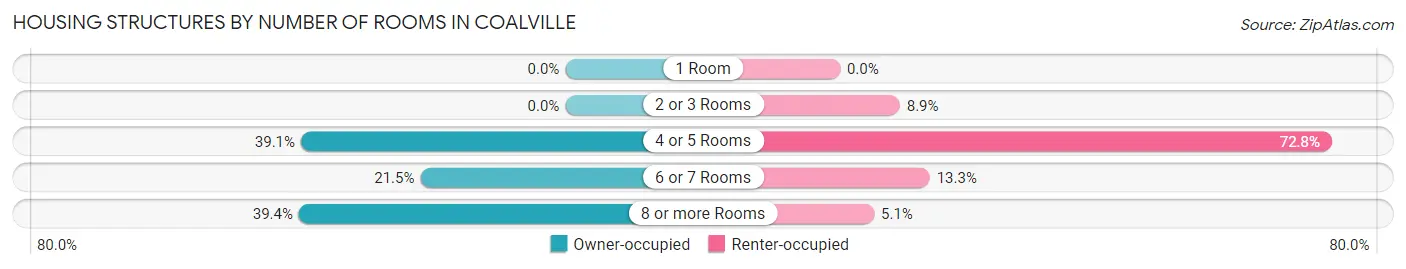
| Number of Rooms | Owner-occupied | Renter-occupied |
| 1 Room | 0 (0.0%) | 0 (0.0%) |
| 2 or 3 Rooms | 0 (0.0%) | 14 (8.9%) |
| 4 or 5 Rooms | 124 (39.1%) | 115 (72.8%) |
| 6 or 7 Rooms | 68 (21.4%) | 21 (13.3%) |
| 8 or more Rooms | 125 (39.4%) | 8 (5.1%) |
| Total | 317 (100.0%) | 158 (100.0%) |
Housing Structure by Heating Type in Coalville
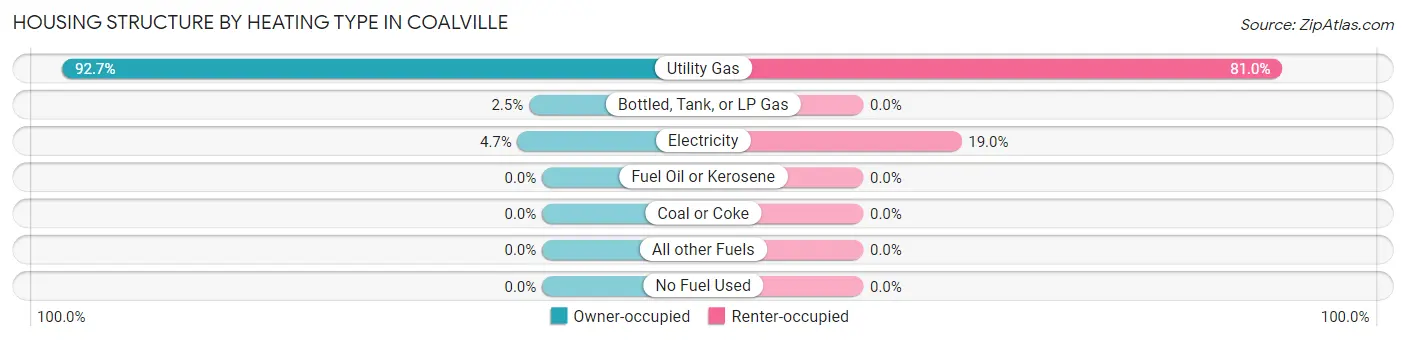
| Heating Type | Owner-occupied | Renter-occupied |
| Utility Gas | 294 (92.7%) | 128 (81.0%) |
| Bottled, Tank, or LP Gas | 8 (2.5%) | 0 (0.0%) |
| Electricity | 15 (4.7%) | 30 (19.0%) |
| Fuel Oil or Kerosene | 0 (0.0%) | 0 (0.0%) |
| Coal or Coke | 0 (0.0%) | 0 (0.0%) |
| All other Fuels | 0 (0.0%) | 0 (0.0%) |
| No Fuel Used | 0 (0.0%) | 0 (0.0%) |
| Total | 317 (100.0%) | 158 (100.0%) |
Household Vehicle Usage in Coalville
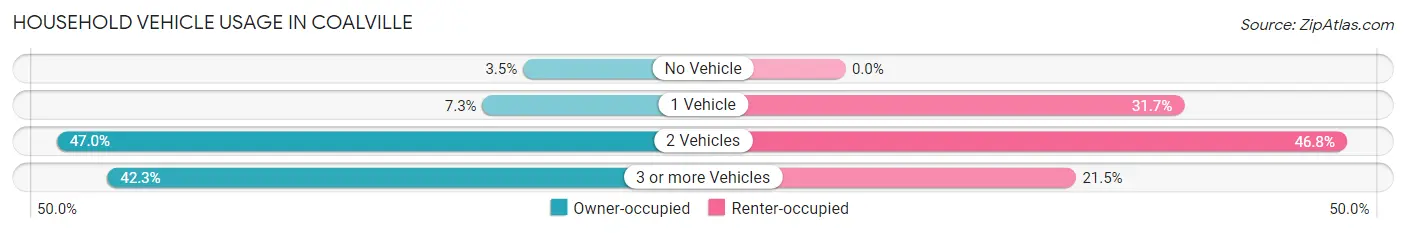
| Vehicles per Household | Owner-occupied | Renter-occupied |
| No Vehicle | 11 (3.5%) | 0 (0.0%) |
| 1 Vehicle | 23 (7.3%) | 50 (31.7%) |
| 2 Vehicles | 149 (47.0%) | 74 (46.8%) |
| 3 or more Vehicles | 134 (42.3%) | 34 (21.5%) |
| Total | 317 (100.0%) | 158 (100.0%) |
Real Estate & Mortgages in Coalville
Real Estate and Mortgage Overview in Coalville
| Characteristic | Without Mortgage | With Mortgage |
| Housing Units | 154 | 163 |
| Median Property Value | $235,700 | $401,300 |
| Median Household Income | $84,722 | $46 |
| Monthly Housing Costs | $381 | $11 |
| Real Estate Taxes | $943 | $2 |
Property Value by Mortgage Status in Coalville
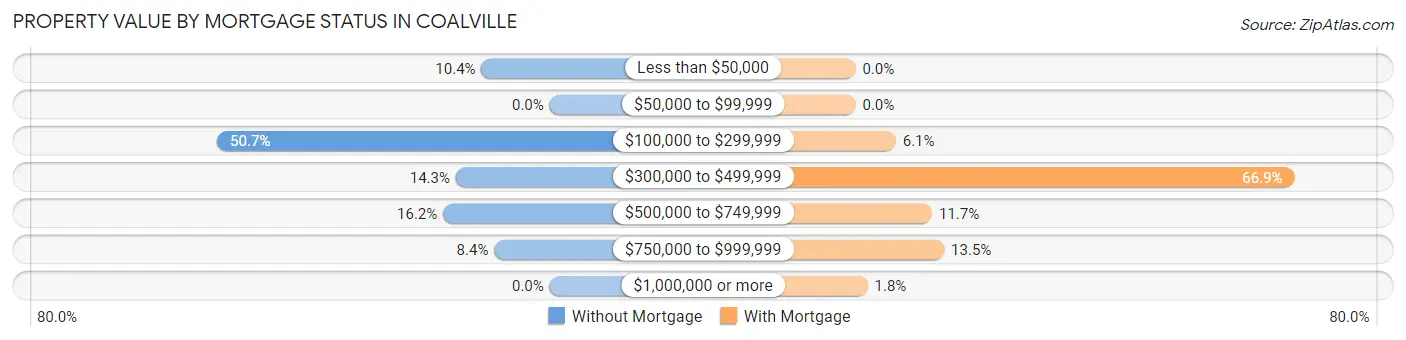
| Property Value | Without Mortgage | With Mortgage |
| Less than $50,000 | 16 (10.4%) | 0 (0.0%) |
| $50,000 to $99,999 | 0 (0.0%) | 0 (0.0%) |
| $100,000 to $299,999 | 78 (50.6%) | 10 (6.1%) |
| $300,000 to $499,999 | 22 (14.3%) | 109 (66.9%) |
| $500,000 to $749,999 | 25 (16.2%) | 19 (11.7%) |
| $750,000 to $999,999 | 13 (8.4%) | 22 (13.5%) |
| $1,000,000 or more | 0 (0.0%) | 3 (1.8%) |
| Total | 154 (100.0%) | 163 (100.0%) |
Household Income by Mortgage Status in Coalville
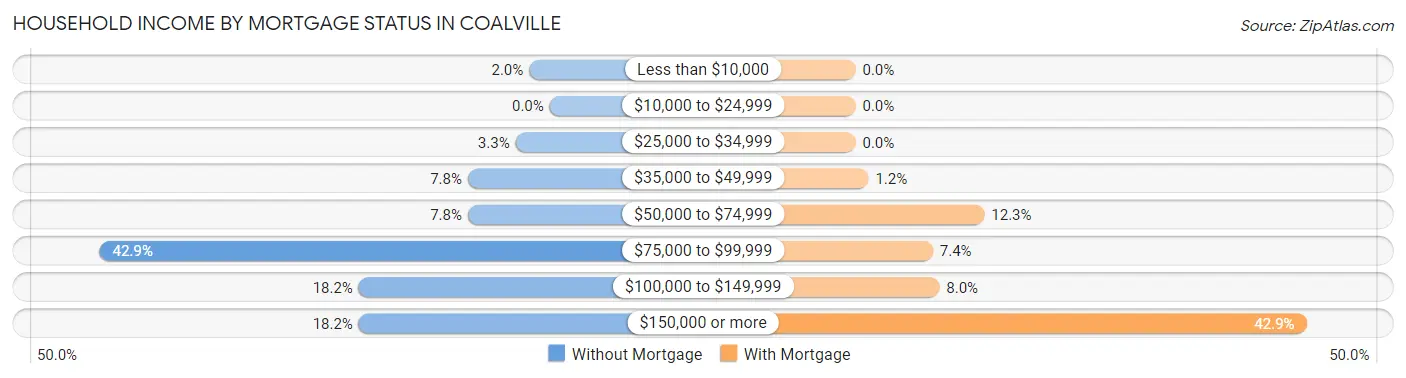
| Household Income | Without Mortgage | With Mortgage |
| Less than $10,000 | 3 (1.9%) | 0 (0.0%) |
| $10,000 to $24,999 | 0 (0.0%) | 0 (0.0%) |
| $25,000 to $34,999 | 5 (3.3%) | 0 (0.0%) |
| $35,000 to $49,999 | 12 (7.8%) | 2 (1.2%) |
| $50,000 to $74,999 | 12 (7.8%) | 20 (12.3%) |
| $75,000 to $99,999 | 66 (42.9%) | 12 (7.4%) |
| $100,000 to $149,999 | 28 (18.2%) | 13 (8.0%) |
| $150,000 or more | 28 (18.2%) | 70 (42.9%) |
| Total | 154 (100.0%) | 163 (100.0%) |
Property Value to Household Income Ratio in Coalville
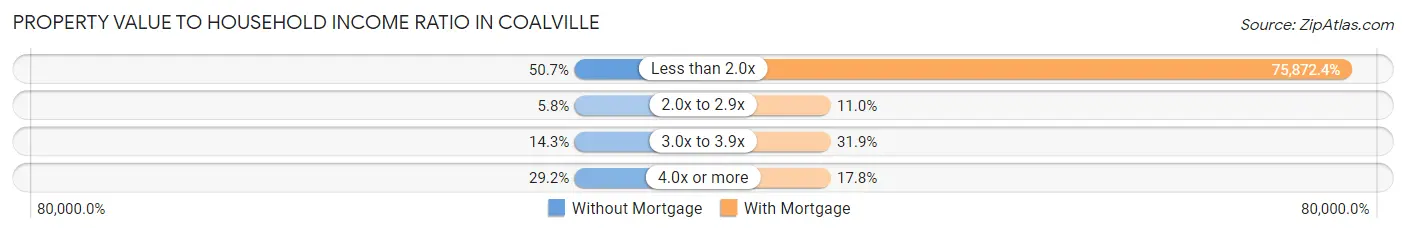
| Value-to-Income Ratio | Without Mortgage | With Mortgage |
| Less than 2.0x | 78 (50.6%) | 123,672 (75,872.4%) |
| 2.0x to 2.9x | 9 (5.8%) | 18 (11.0%) |
| 3.0x to 3.9x | 22 (14.3%) | 52 (31.9%) |
| 4.0x or more | 45 (29.2%) | 29 (17.8%) |
| Total | 154 (100.0%) | 163 (100.0%) |
Real Estate Taxes by Mortgage Status in Coalville
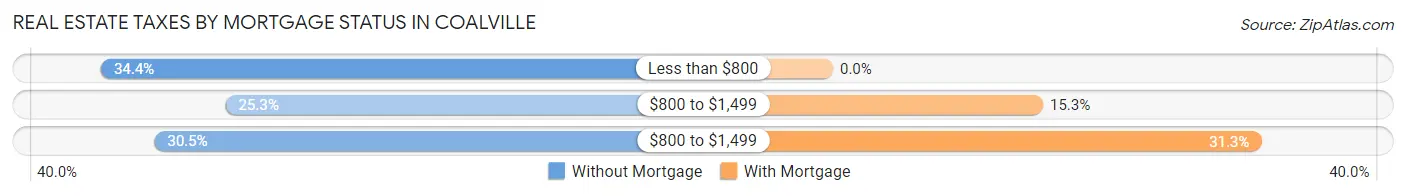
| Property Taxes | Without Mortgage | With Mortgage |
| Less than $800 | 53 (34.4%) | 0 (0.0%) |
| $800 to $1,499 | 39 (25.3%) | 25 (15.3%) |
| $800 to $1,499 | 47 (30.5%) | 51 (31.3%) |
| Total | 154 (100.0%) | 163 (100.0%) |
Health & Disability in Coalville
Health Insurance Coverage by Age in Coalville
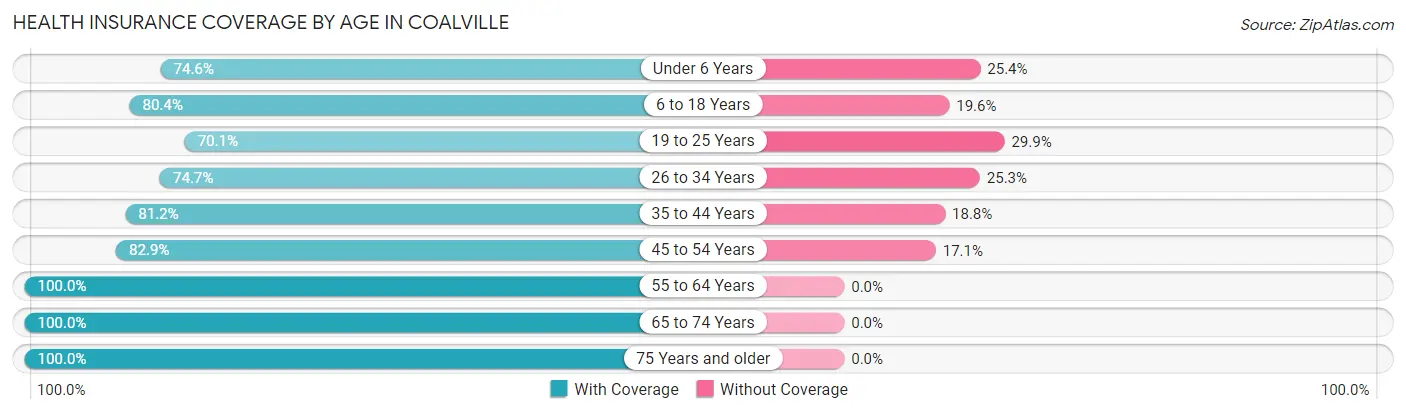
| Age Bracket | With Coverage | Without Coverage |
| Under 6 Years | 153 (74.6%) | 52 (25.4%) |
| 6 to 18 Years | 304 (80.4%) | 74 (19.6%) |
| 19 to 25 Years | 216 (70.1%) | 92 (29.9%) |
| 26 to 34 Years | 198 (74.7%) | 67 (25.3%) |
| 35 to 44 Years | 216 (81.2%) | 50 (18.8%) |
| 45 to 54 Years | 282 (82.9%) | 58 (17.1%) |
| 55 to 64 Years | 90 (100.0%) | 0 (0.0%) |
| 65 to 74 Years | 113 (100.0%) | 0 (0.0%) |
| 75 Years and older | 49 (100.0%) | 0 (0.0%) |
| Total | 1,621 (80.5%) | 393 (19.5%) |
Health Insurance Coverage by Citizenship Status in Coalville
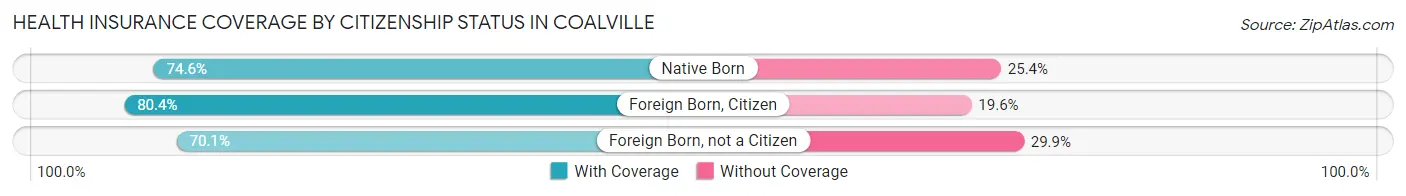
| Citizenship Status | With Coverage | Without Coverage |
| Native Born | 153 (74.6%) | 52 (25.4%) |
| Foreign Born, Citizen | 304 (80.4%) | 74 (19.6%) |
| Foreign Born, not a Citizen | 216 (70.1%) | 92 (29.9%) |
Health Insurance Coverage by Household Income in Coalville
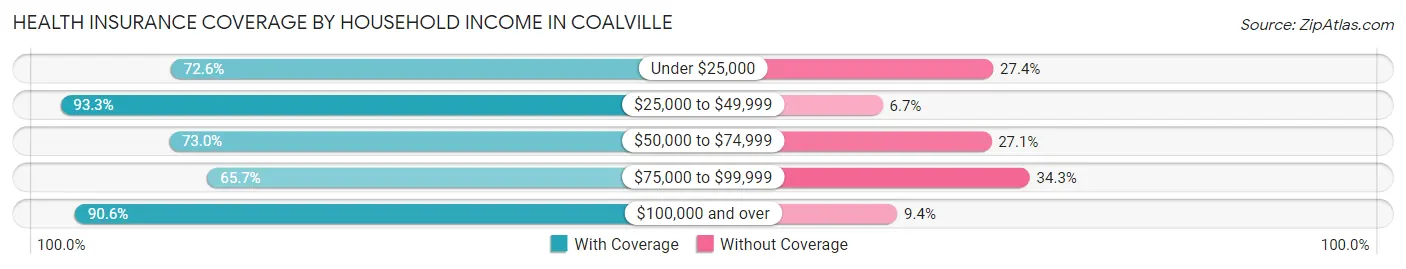
| Household Income | With Coverage | Without Coverage |
| Under $25,000 | 90 (72.6%) | 34 (27.4%) |
| $25,000 to $49,999 | 139 (93.3%) | 10 (6.7%) |
| $50,000 to $74,999 | 213 (73.0%) | 79 (27.1%) |
| $75,000 to $99,999 | 353 (65.7%) | 184 (34.3%) |
| $100,000 and over | 826 (90.6%) | 86 (9.4%) |
Public vs Private Health Insurance Coverage by Age in Coalville
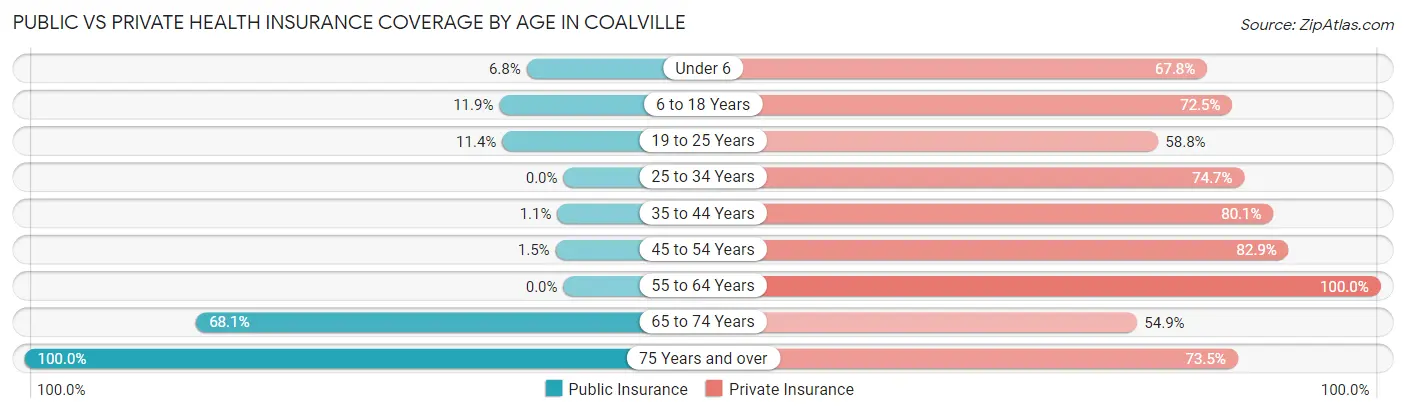
| Age Bracket | Public Insurance | Private Insurance |
| Under 6 | 14 (6.8%) | 139 (67.8%) |
| 6 to 18 Years | 45 (11.9%) | 274 (72.5%) |
| 19 to 25 Years | 35 (11.4%) | 181 (58.8%) |
| 25 to 34 Years | 0 (0.0%) | 198 (74.7%) |
| 35 to 44 Years | 3 (1.1%) | 213 (80.1%) |
| 45 to 54 Years | 5 (1.5%) | 282 (82.9%) |
| 55 to 64 Years | 0 (0.0%) | 90 (100.0%) |
| 65 to 74 Years | 77 (68.1%) | 62 (54.9%) |
| 75 Years and over | 49 (100.0%) | 36 (73.5%) |
| Total | 228 (11.3%) | 1,475 (73.2%) |
Disability Status by Sex by Age in Coalville
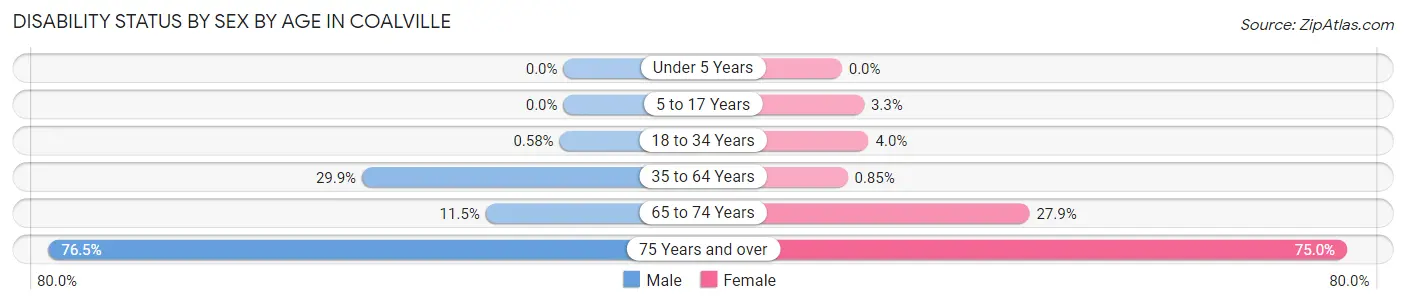
| Age Bracket | Male | Female |
| Under 5 Years | 0 (0.0%) | 0 (0.0%) |
| 5 to 17 Years | 0 (0.0%) | 7 (3.3%) |
| 18 to 34 Years | 2 (0.6%) | 10 (4.0%) |
| 35 to 64 Years | 102 (29.9%) | 3 (0.9%) |
| 65 to 74 Years | 6 (11.5%) | 17 (27.9%) |
| 75 Years and over | 13 (76.5%) | 24 (75.0%) |
Disability Class by Sex by Age in Coalville
Disability Class: Hearing Difficulty
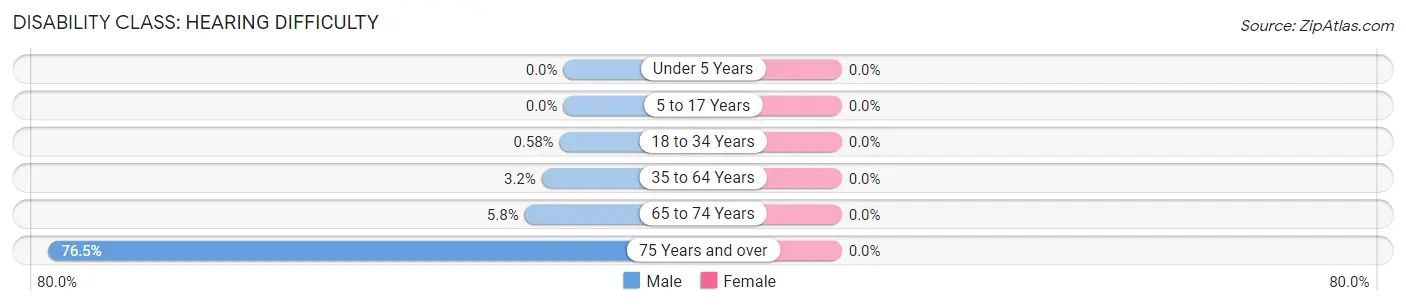
| Age Bracket | Male | Female |
| Under 5 Years | 0 (0.0%) | 0 (0.0%) |
| 5 to 17 Years | 0 (0.0%) | 0 (0.0%) |
| 18 to 34 Years | 2 (0.6%) | 0 (0.0%) |
| 35 to 64 Years | 11 (3.2%) | 0 (0.0%) |
| 65 to 74 Years | 3 (5.8%) | 0 (0.0%) |
| 75 Years and over | 13 (76.5%) | 0 (0.0%) |
Disability Class: Vision Difficulty
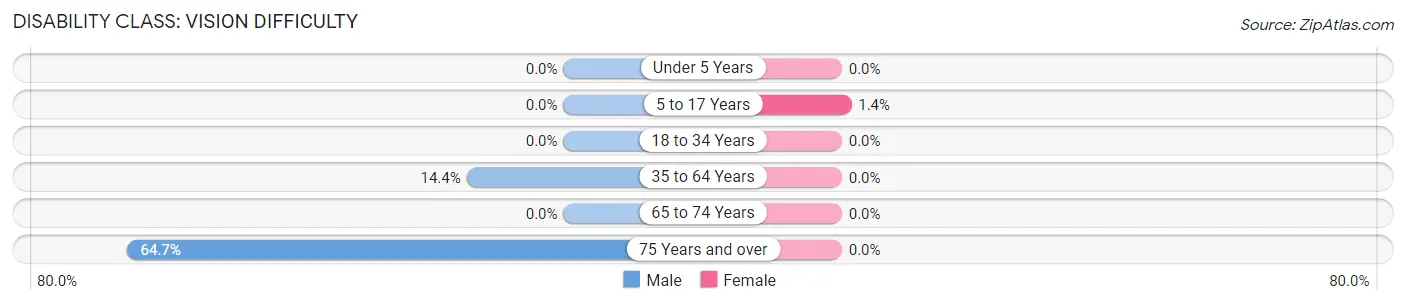
| Age Bracket | Male | Female |
| Under 5 Years | 0 (0.0%) | 0 (0.0%) |
| 5 to 17 Years | 0 (0.0%) | 3 (1.4%) |
| 18 to 34 Years | 0 (0.0%) | 0 (0.0%) |
| 35 to 64 Years | 49 (14.4%) | 0 (0.0%) |
| 65 to 74 Years | 0 (0.0%) | 0 (0.0%) |
| 75 Years and over | 11 (64.7%) | 0 (0.0%) |
Disability Class: Cognitive Difficulty
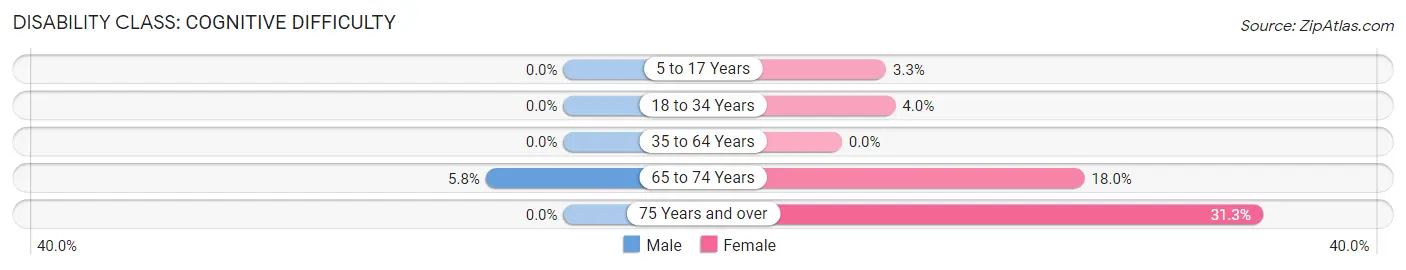
| Age Bracket | Male | Female |
| 5 to 17 Years | 0 (0.0%) | 7 (3.3%) |
| 18 to 34 Years | 0 (0.0%) | 10 (4.0%) |
| 35 to 64 Years | 0 (0.0%) | 0 (0.0%) |
| 65 to 74 Years | 3 (5.8%) | 11 (18.0%) |
| 75 Years and over | 0 (0.0%) | 10 (31.2%) |
Disability Class: Ambulatory Difficulty
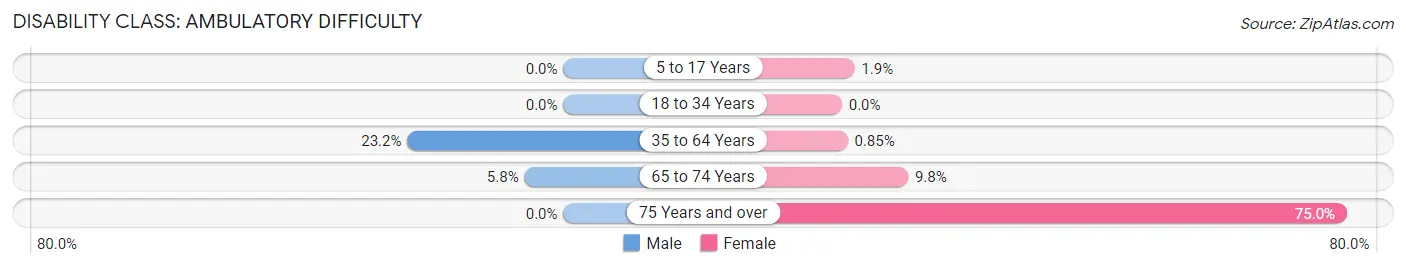
| Age Bracket | Male | Female |
| 5 to 17 Years | 0 (0.0%) | 4 (1.9%) |
| 18 to 34 Years | 0 (0.0%) | 0 (0.0%) |
| 35 to 64 Years | 79 (23.2%) | 3 (0.9%) |
| 65 to 74 Years | 3 (5.8%) | 6 (9.8%) |
| 75 Years and over | 0 (0.0%) | 24 (75.0%) |
Disability Class: Self-Care Difficulty
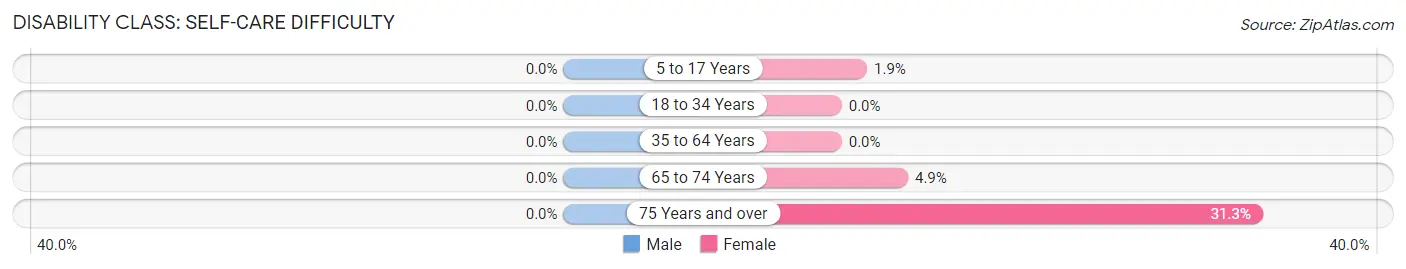
| Age Bracket | Male | Female |
| 5 to 17 Years | 0 (0.0%) | 4 (1.9%) |
| 18 to 34 Years | 0 (0.0%) | 0 (0.0%) |
| 35 to 64 Years | 0 (0.0%) | 0 (0.0%) |
| 65 to 74 Years | 0 (0.0%) | 3 (4.9%) |
| 75 Years and over | 0 (0.0%) | 10 (31.2%) |
Technology Access in Coalville
Computing Device Access in Coalville
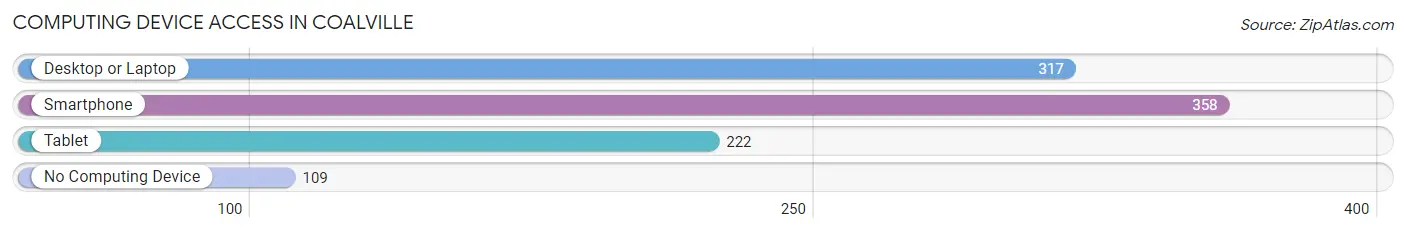
| Device Type | # Households | % Households |
| Desktop or Laptop | 317 | 66.7% |
| Smartphone | 358 | 75.4% |
| Tablet | 222 | 46.7% |
| No Computing Device | 109 | 23.0% |
| Total | 475 | 100.0% |
Internet Access in Coalville
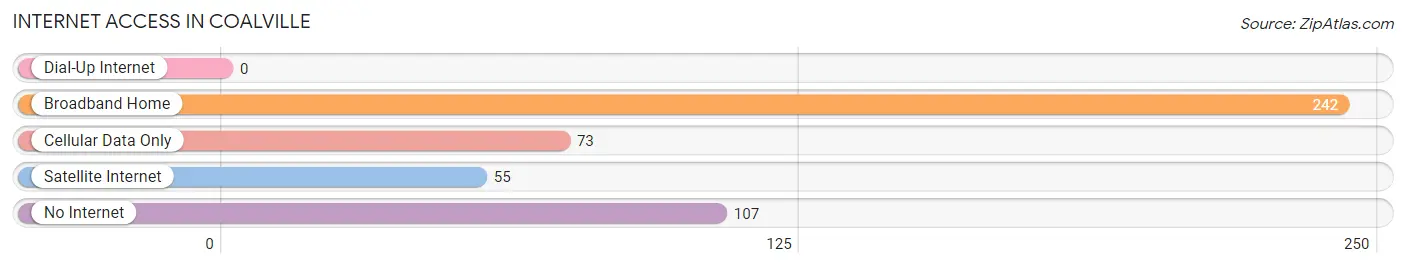
| Internet Type | # Households | % Households |
| Dial-Up Internet | 0 | 0.0% |
| Broadband Home | 242 | 50.9% |
| Cellular Data Only | 73 | 15.4% |
| Satellite Internet | 55 | 11.6% |
| No Internet | 107 | 22.5% |
| Total | 475 | 100.0% |
Coalville Summary
Coalville is a small city located in Summit County, Utah, United States. It is situated in the Wasatch Mountains, approximately 30 miles east of Salt Lake City. The city is the county seat of Summit County and is home to a population of approximately 1,800 people.
History
Coalville was first settled in 1859 by a group of Mormon pioneers led by William H. Hooper. The pioneers were attracted to the area by the abundance of coal in the area, which was used to fuel the local economy. The town was originally named Coalville in honor of the coal mining industry.
In 1868, the Utah Central Railroad was built through Coalville, connecting the town to Salt Lake City and other cities in the region. This allowed for the transportation of coal and other goods to and from the town.
In 1872, the town was incorporated and the first mayor, William H. Hooper, was elected. The town continued to grow and prosper throughout the late 19th and early 20th centuries, with the coal mining industry providing the main source of income for the town.
Geography
Coalville is located in Summit County, Utah, approximately 30 miles east of Salt Lake City. The city is situated in the Wasatch Mountains, at an elevation of 6,000 feet. The city is surrounded by mountains, including the Uinta Mountains to the east and the Wasatch Mountains to the west.
The city is located in a valley, with the Weber River running through it. The city is also located near several ski resorts, including Park City, Deer Valley, and Snowbird.
Economy
Coalville’s economy is largely based on tourism and recreation. The city is home to several ski resorts, which attract visitors from all over the world. The city is also home to several restaurants, shops, and other businesses that cater to tourists.
In addition to tourism, Coalville is also home to several manufacturing and industrial businesses. The city is home to several companies that produce mining equipment, as well as several companies that produce outdoor recreation equipment.
Demographics
As of the 2010 census, the population of Coalville was 1,817. The racial makeup of the city was 94.3% White, 0.3% African American, 0.3% Native American, 0.3% Asian, 0.1% Pacific Islander, 2.2% from other races, and 2.5% from two or more races. Hispanic or Latino of any race were 4.7% of the population.
The median income for a household in the city was $45,000, and the median income for a family was $50,000. The per capita income for the city was $20,000. About 8.3% of families and 10.2% of the population were below the poverty line, including 11.3% of those under age 18 and 8.2% of those age 65 or over.
Common Questions
What is Per Capita Income in Coalville?
Per Capita income in Coalville is $28,885.
What is the Median Family Income in Coalville?
Median Family Income in Coalville is $90,000.
What is the Median Household income in Coalville?
Median Household Income in Coalville is $84,917.
What is Income or Wage Gap in Coalville?
Income or Wage Gap in Coalville is 12.9%.
Women in Coalville earn 87.1 cents for every dollar earned by a man.
What is Inequality or Gini Index in Coalville?
Inequality or Gini Index in Coalville is 0.36.
What is the Total Population of Coalville?
Total Population of Coalville is 2,014.
What is the Total Male Population of Coalville?
Total Male Population of Coalville is 1,015.
What is the Total Female Population of Coalville?
Total Female Population of Coalville is 999.
What is the Ratio of Males per 100 Females in Coalville?
There are 101.60 Males per 100 Females in Coalville.
What is the Ratio of Females per 100 Males in Coalville?
There are 98.42 Females per 100 Males in Coalville.
What is the Median Population Age in Coalville?
Median Population Age in Coalville is 27.7 Years.
What is the Average Family Size in Coalville
Average Family Size in Coalville is 4.8 People.
What is the Average Household Size in Coalville
Average Household Size in Coalville is 4.2 People.
How Large is the Labor Force in Coalville?
There are 1,111 People in the Labor Forcein in Coalville.
What is the Percentage of People in the Labor Force in Coalville?
73.2% of People are in the Labor Force in Coalville.
What is the Unemployment Rate in Coalville?
Unemployment Rate in Coalville is 2.4%.