Cleveland, UT Map & Demographics
Cleveland Map
Cleveland Overview
$31,350
PER CAPITA INCOME
$91,413
AVG FAMILY INCOME
$90,326
AVG HOUSEHOLD INCOME
81.2%
WAGE / INCOME GAP [ % ]
18.8¢/ $1
WAGE / INCOME GAP [ $ ]
0.32
INEQUALITY / GINI INDEX
501
TOTAL POPULATION
244
MALE POPULATION
257
FEMALE POPULATION
94.94
MALES / 100 FEMALES
105.33
FEMALES / 100 MALES
36.4
MEDIAN AGE
3.2
AVG FAMILY SIZE
3.0
AVG HOUSEHOLD SIZE
221
LABOR FORCE [ PEOPLE ]
60.5%
PERCENT IN LABOR FORCE
0.9%
UNEMPLOYMENT RATE
Cleveland Zip Codes
Cleveland Area Codes
Income in Cleveland
Income Overview in Cleveland
Per Capita Income in Cleveland is $31,350, while median incomes of families and households are $91,413 and $90,326 respectively.
| Characteristic | Number | Measure |
| Per Capita Income | 501 | $31,350 |
| Median Family Income | 146 | $91,413 |
| Mean Family Income | 146 | $107,326 |
| Median Household Income | 166 | $90,326 |
| Mean Household Income | 166 | $96,989 |
| Income Deficit | 146 | $0 |
| Wage / Income Gap (%) | 501 | 81.17% |
| Wage / Income Gap ($) | 501 | 18.83¢ per $1 |
| Gini / Inequality Index | 501 | 0.32 |
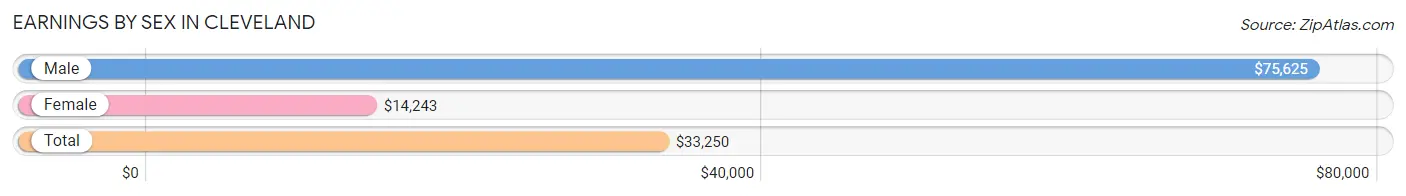
Earnings by Sex in Cleveland
Average Earnings in Cleveland are $33,250, $75,625 for men and $14,243 for women, a difference of 81.2%.
| Sex | Number | Average Earnings |
| Male | 111 (47.0%) | $75,625 |
| Female | 125 (53.0%) | $14,243 |
| Total | 236 (100.0%) | $33,250 |
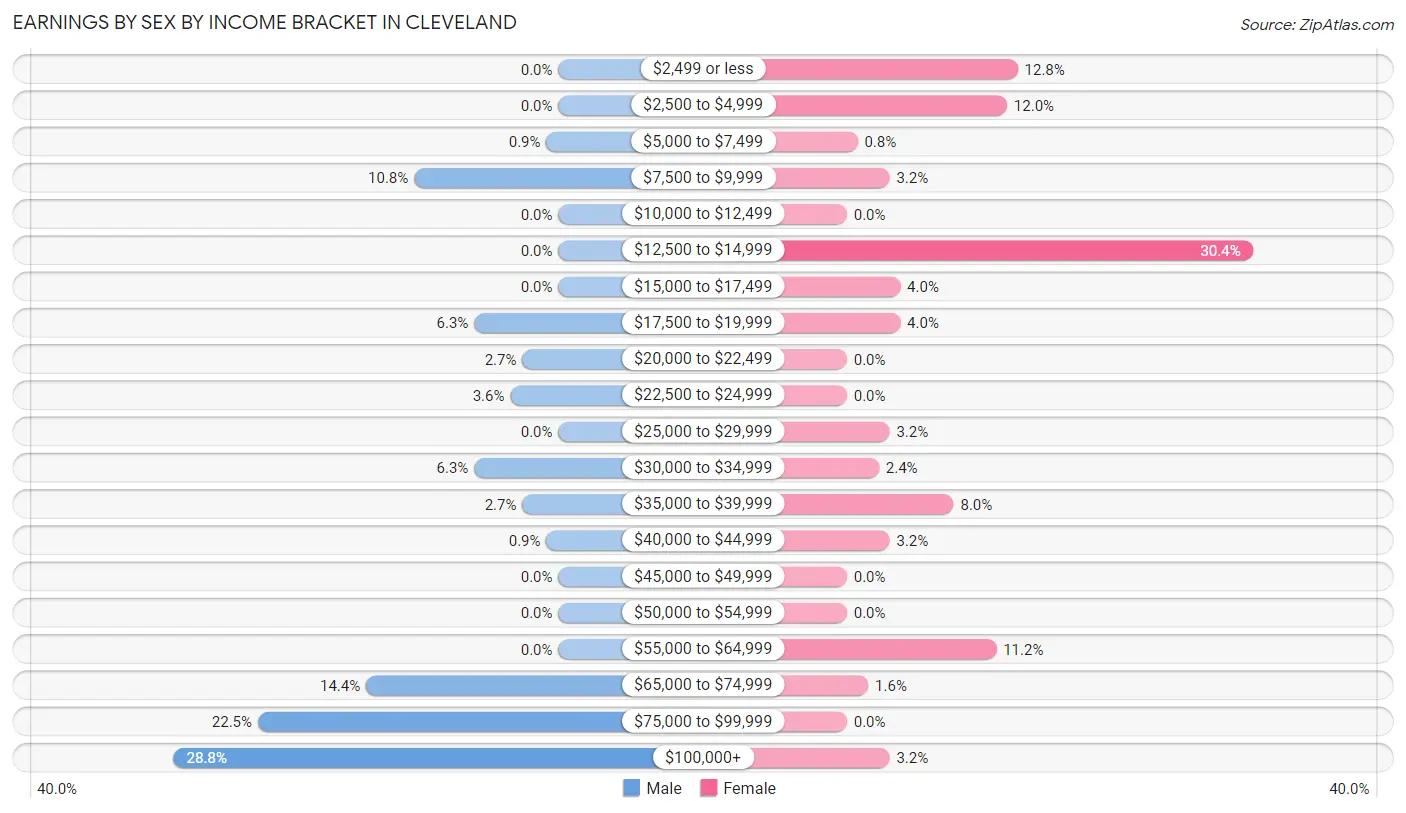
Earnings by Sex by Income Bracket in Cleveland
The most common earnings brackets in Cleveland are $100,000+ for men (32 | 28.8%) and $12,500 to $14,999 for women (38 | 30.4%).
| Income | Male | Female |
| $2,499 or less | 0 (0.0%) | 16 (12.8%) |
| $2,500 to $4,999 | 0 (0.0%) | 15 (12.0%) |
| $5,000 to $7,499 | 1 (0.9%) | 1 (0.8%) |
| $7,500 to $9,999 | 12 (10.8%) | 4 (3.2%) |
| $10,000 to $12,499 | 0 (0.0%) | 0 (0.0%) |
| $12,500 to $14,999 | 0 (0.0%) | 38 (30.4%) |
| $15,000 to $17,499 | 0 (0.0%) | 5 (4.0%) |
| $17,500 to $19,999 | 7 (6.3%) | 5 (4.0%) |
| $20,000 to $22,499 | 3 (2.7%) | 0 (0.0%) |
| $22,500 to $24,999 | 4 (3.6%) | 0 (0.0%) |
| $25,000 to $29,999 | 0 (0.0%) | 4 (3.2%) |
| $30,000 to $34,999 | 7 (6.3%) | 3 (2.4%) |
| $35,000 to $39,999 | 3 (2.7%) | 10 (8.0%) |
| $40,000 to $44,999 | 1 (0.9%) | 4 (3.2%) |
| $45,000 to $49,999 | 0 (0.0%) | 0 (0.0%) |
| $50,000 to $54,999 | 0 (0.0%) | 0 (0.0%) |
| $55,000 to $64,999 | 0 (0.0%) | 14 (11.2%) |
| $65,000 to $74,999 | 16 (14.4%) | 2 (1.6%) |
| $75,000 to $99,999 | 25 (22.5%) | 0 (0.0%) |
| $100,000+ | 32 (28.8%) | 4 (3.2%) |
| Total | 111 (100.0%) | 125 (100.0%) |
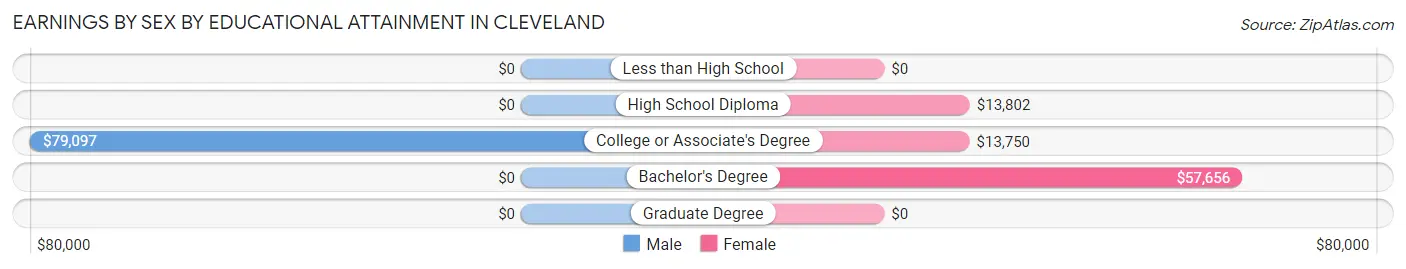
Earnings by Sex by Educational Attainment in Cleveland
Average earnings in Cleveland are $77,917 for men and $14,609 for women, a difference of 81.2%. Men with an educational attainment of college or associate's degree enjoy the highest average annual earnings of $79,097, while those with college or associate's degree education earn the least with $79,097. Women with an educational attainment of bachelor's degree earn the most with the average annual earnings of $57,656, while those with college or associate's degree education have the smallest earnings of $13,750.
| Educational Attainment | Male Income | Female Income |
| Less than High School | - | - |
| High School Diploma | - | - |
| College or Associate's Degree | $79,097 | $13,750 |
| Bachelor's Degree | - | - |
| Graduate Degree | - | - |
| Total | $77,917 | $14,609 |
Family Income in Cleveland
Family Income Brackets in Cleveland
According to the Cleveland family income data, there are 39 families falling into the $75,000 to $99,999 income range, which is the most common income bracket and makes up 26.7% of all families.
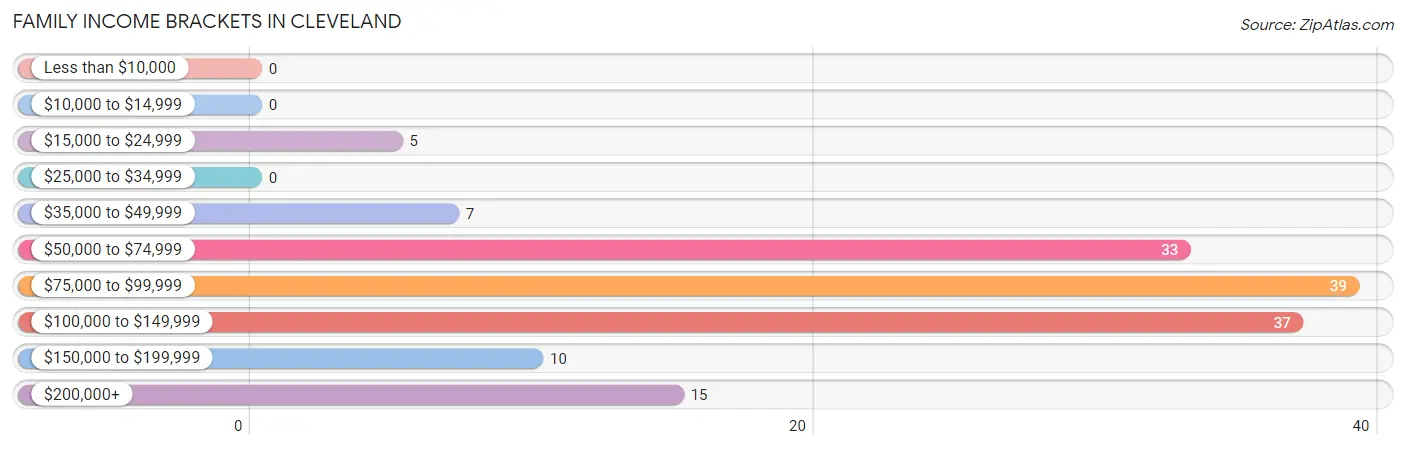
| Income Bracket | # Families | % Families |
| Less than $10,000 | 0 | 0.0% |
| $10,000 to $14,999 | 0 | 0.0% |
| $15,000 to $24,999 | 5 | 3.4% |
| $25,000 to $34,999 | 0 | 0.0% |
| $35,000 to $49,999 | 7 | 4.8% |
| $50,000 to $74,999 | 33 | 22.6% |
| $75,000 to $99,999 | 39 | 26.7% |
| $100,000 to $149,999 | 37 | 25.3% |
| $150,000 to $199,999 | 10 | 6.8% |
| $200,000+ | 15 | 10.3% |
Family Income by Famaliy Size in Cleveland
6-person families (11 | 7.5%) account for the highest median family income in Cleveland with $118,750 per family, while 2-person families (65 | 44.5%) have the highest median income of $57,656 per family member.
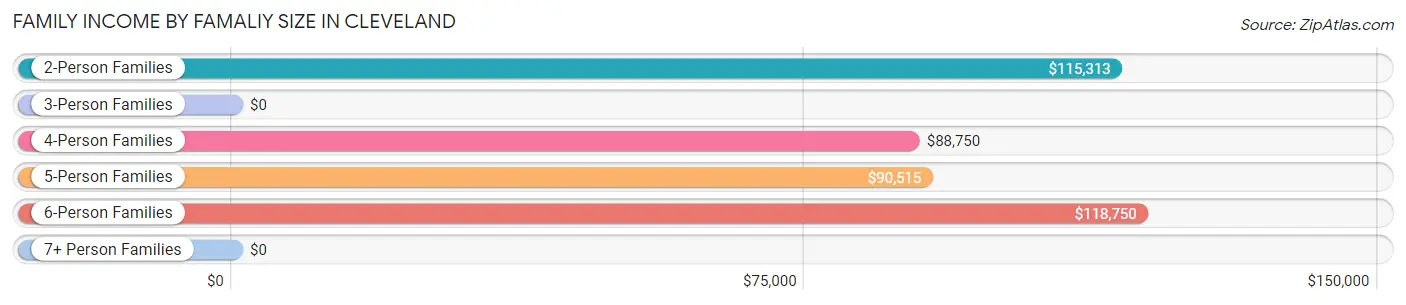
| Income Bracket | # Families | Median Income |
| 2-Person Families | 65 (44.5%) | $115,313 |
| 3-Person Families | 13 (8.9%) | $0 |
| 4-Person Families | 16 (11.0%) | $88,750 |
| 5-Person Families | 37 (25.3%) | $90,515 |
| 6-Person Families | 11 (7.5%) | $118,750 |
| 7+ Person Families | 4 (2.7%) | $0 |
| Total | 146 (100.0%) | $91,413 |
Family Income by Number of Earners in Cleveland
The median family income in Cleveland is $91,413, with families comprising 3+ earners (7) having the highest median family income of $177,813, while families with no earners (9) have the lowest median family income of $41,563, accounting for 4.8% and 6.2% of families, respectively.
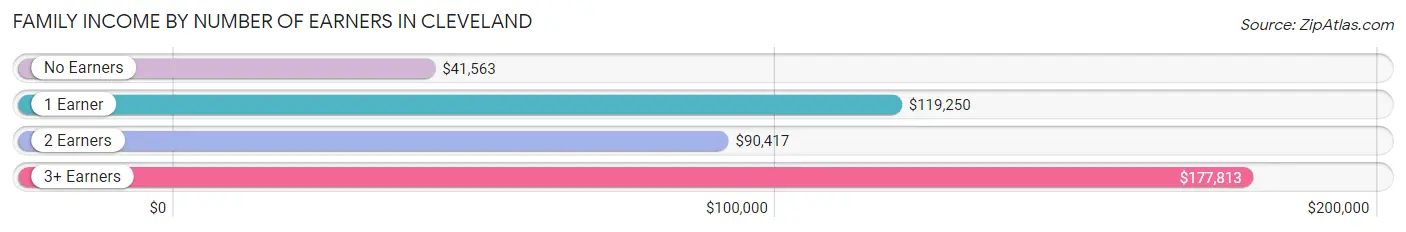
| Number of Earners | # Families | Median Income |
| No Earners | 9 (6.2%) | $41,563 |
| 1 Earner | 43 (29.4%) | $119,250 |
| 2 Earners | 87 (59.6%) | $90,417 |
| 3+ Earners | 7 (4.8%) | $177,813 |
| Total | 146 (100.0%) | $91,413 |
Household Income in Cleveland
Household Income Brackets in Cleveland
With 39 households falling in the category, the $75,000 to $99,999 income range is the most frequent in Cleveland, accounting for 23.5% of all households.
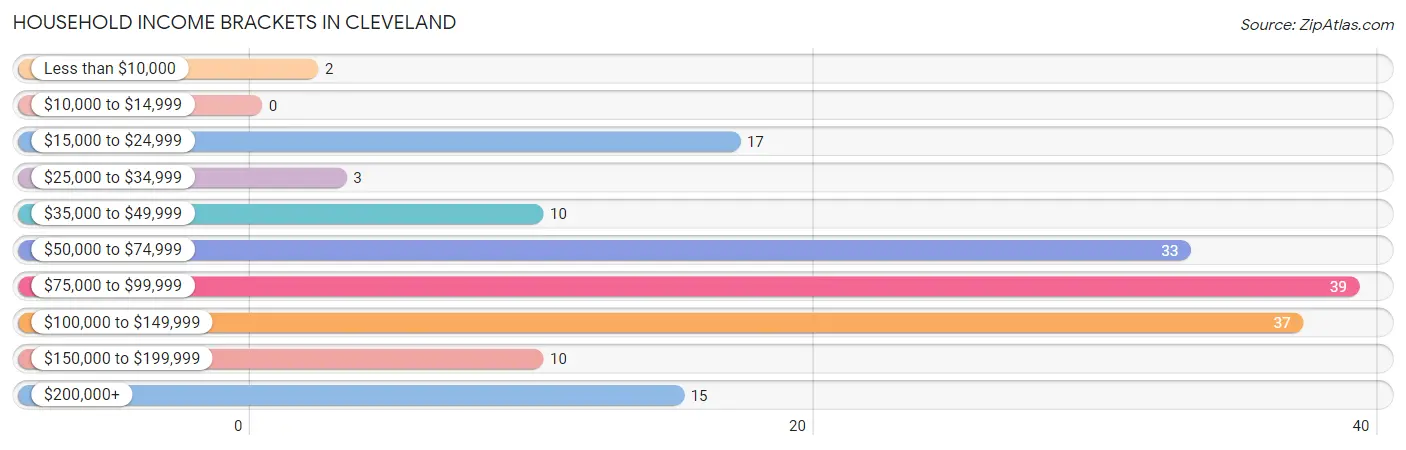
| Income Bracket | # Households | % Households |
| Less than $10,000 | 2 | 1.2% |
| $10,000 to $14,999 | 0 | 0.0% |
| $15,000 to $24,999 | 17 | 10.2% |
| $25,000 to $34,999 | 3 | 1.8% |
| $35,000 to $49,999 | 10 | 6.0% |
| $50,000 to $74,999 | 33 | 19.9% |
| $75,000 to $99,999 | 39 | 23.5% |
| $100,000 to $149,999 | 37 | 22.3% |
| $150,000 to $199,999 | 10 | 6.0% |
| $200,000+ | 15 | 9.0% |
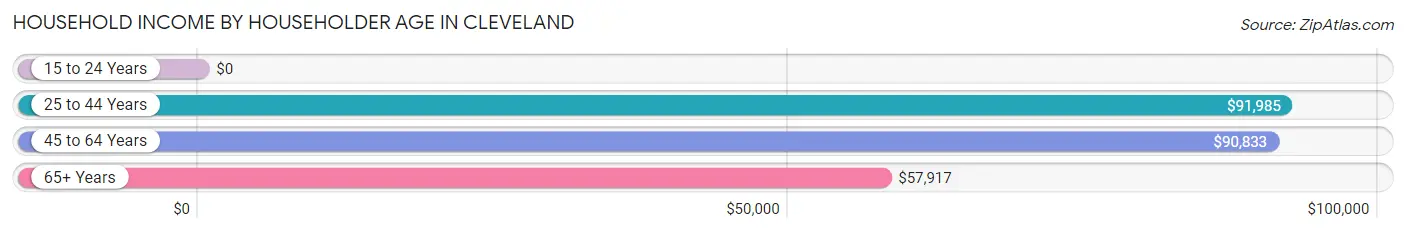
Household Income by Householder Age in Cleveland
The median household income in Cleveland is $90,326, with the highest median household income of $91,985 found in the 25 to 44 years age bracket for the primary householder. A total of 43 households (25.9%) fall into this category.
| Income Bracket | # Households | Median Income |
| 15 to 24 Years | 0 (0.0%) | $0 |
| 25 to 44 Years | 43 (25.9%) | $91,985 |
| 45 to 64 Years | 68 (41.0%) | $90,833 |
| 65+ Years | 55 (33.1%) | $57,917 |
| Total | 166 (100.0%) | $90,326 |
Poverty in Cleveland
Income Below Poverty by Sex and Age in Cleveland
With 3.7% poverty level for males and 9.7% for females among the residents of Cleveland, under 5 year old males and 18 to 24 year old females are the most vulnerable to poverty, with 3 males (15.0%) and 13 females (50.0%) in their respective age groups living below the poverty level.
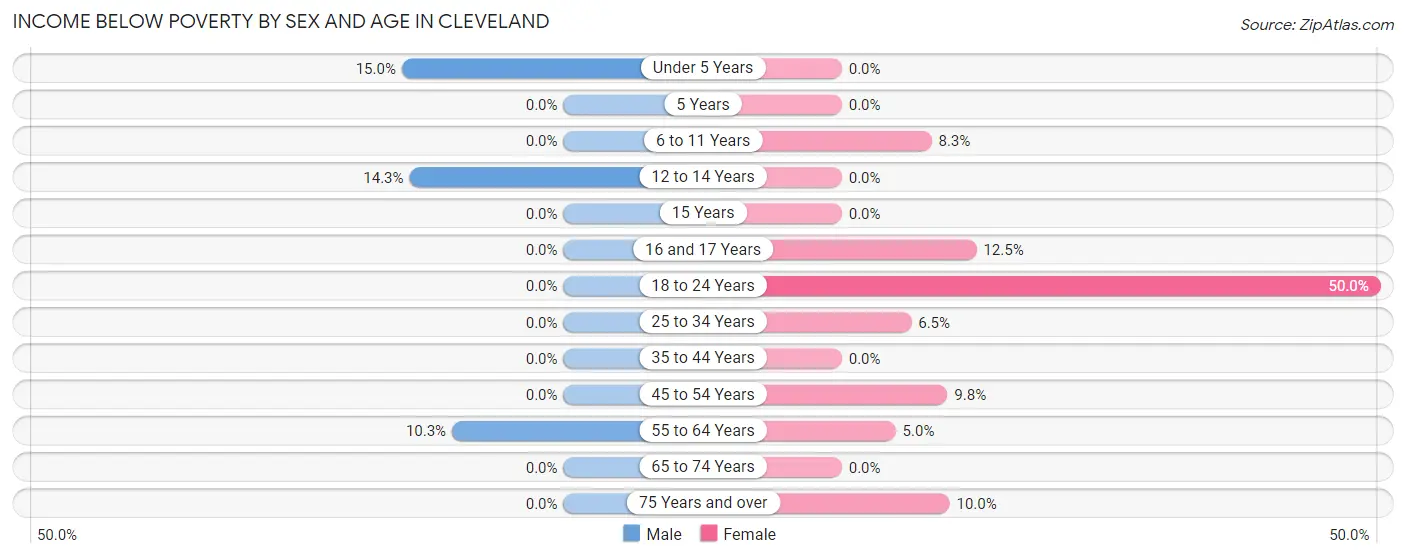
| Age Bracket | Male | Female |
| Under 5 Years | 3 (15.0%) | 0 (0.0%) |
| 5 Years | 0 (0.0%) | 0 (0.0%) |
| 6 to 11 Years | 0 (0.0%) | 1 (8.3%) |
| 12 to 14 Years | 3 (14.3%) | 0 (0.0%) |
| 15 Years | 0 (0.0%) | 0 (0.0%) |
| 16 and 17 Years | 0 (0.0%) | 1 (12.5%) |
| 18 to 24 Years | 0 (0.0%) | 13 (50.0%) |
| 25 to 34 Years | 0 (0.0%) | 2 (6.5%) |
| 35 to 44 Years | 0 (0.0%) | 0 (0.0%) |
| 45 to 54 Years | 0 (0.0%) | 5 (9.8%) |
| 55 to 64 Years | 3 (10.3%) | 1 (5.0%) |
| 65 to 74 Years | 0 (0.0%) | 0 (0.0%) |
| 75 Years and over | 0 (0.0%) | 2 (10.0%) |
| Total | 9 (3.7%) | 25 (9.7%) |
Income Above Poverty by Sex and Age in Cleveland
According to the poverty statistics in Cleveland, males aged 6 to 11 years and females aged under 5 years are the age groups that are most secure financially, with 100.0% of males and 100.0% of females in these age groups living above the poverty line.
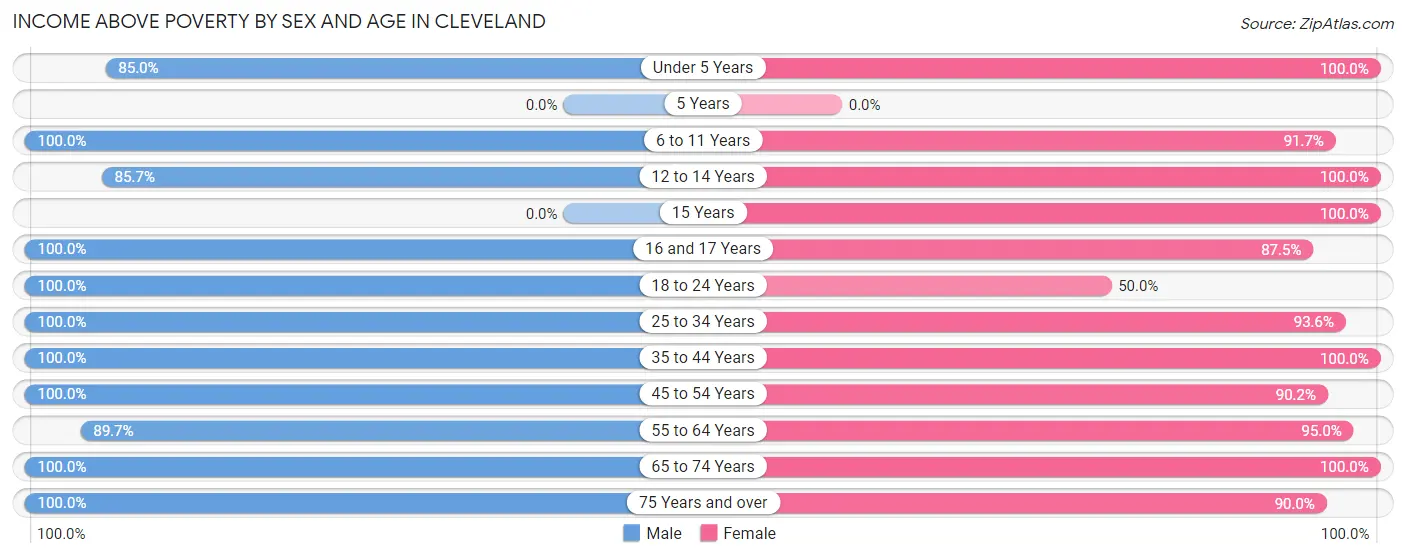
| Age Bracket | Male | Female |
| Under 5 Years | 17 (85.0%) | 7 (100.0%) |
| 5 Years | 0 (0.0%) | 0 (0.0%) |
| 6 to 11 Years | 35 (100.0%) | 11 (91.7%) |
| 12 to 14 Years | 18 (85.7%) | 18 (100.0%) |
| 15 Years | 0 (0.0%) | 23 (100.0%) |
| 16 and 17 Years | 10 (100.0%) | 7 (87.5%) |
| 18 to 24 Years | 15 (100.0%) | 13 (50.0%) |
| 25 to 34 Years | 14 (100.0%) | 29 (93.5%) |
| 35 to 44 Years | 31 (100.0%) | 20 (100.0%) |
| 45 to 54 Years | 30 (100.0%) | 46 (90.2%) |
| 55 to 64 Years | 26 (89.7%) | 19 (95.0%) |
| 65 to 74 Years | 22 (100.0%) | 21 (100.0%) |
| 75 Years and over | 17 (100.0%) | 18 (90.0%) |
| Total | 235 (96.3%) | 232 (90.3%) |
Income Below Poverty Among Married-Couple Families in Cleveland
The poverty statistics for married-couple families in Cleveland show that 3.5% or 5 of the total 143 families live below the poverty line. Families with 1 or 2 children have the highest poverty rate of 12.8%, comprising of 5 families. On the other hand, families with no children have the lowest poverty rate of 0.0%, which includes 0 families.
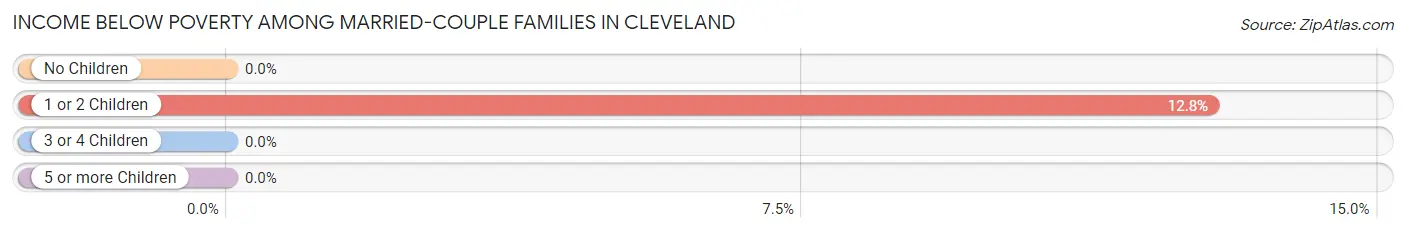
| Children | Above Poverty | Below Poverty |
| No Children | 69 (100.0%) | 0 (0.0%) |
| 1 or 2 Children | 34 (87.2%) | 5 (12.8%) |
| 3 or 4 Children | 31 (100.0%) | 0 (0.0%) |
| 5 or more Children | 4 (100.0%) | 0 (0.0%) |
| Total | 138 (96.5%) | 5 (3.5%) |
Income Below Poverty Among Single-Parent Households in Cleveland
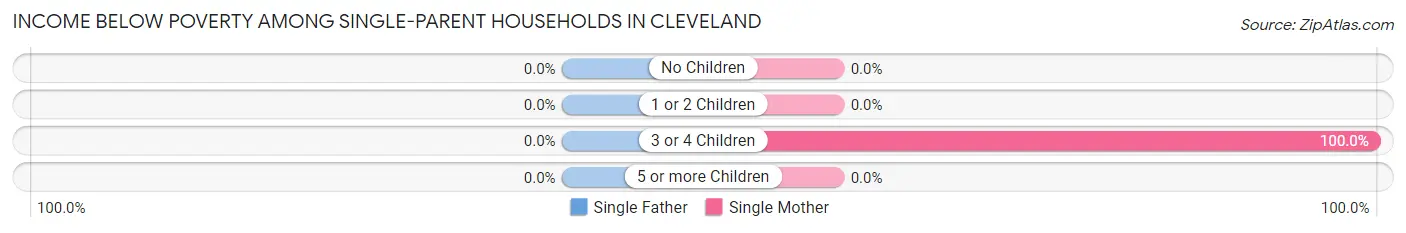
| Children | Single Father | Single Mother |
| No Children | 0 (0.0%) | 0 (0.0%) |
| 1 or 2 Children | 0 (0.0%) | 0 (0.0%) |
| 3 or 4 Children | 0 (0.0%) | 1 (100.0%) |
| 5 or more Children | 0 (0.0%) | 0 (0.0%) |
| Total | 0 (0.0%) | 1 (100.0%) |
Income Below Poverty Among Married-Couple vs Single-Parent Households in Cleveland
The poverty data for Cleveland shows that 5 of the married-couple family households (3.5%) and 1 of the single-parent households (33.3%) are living below the poverty level. Within the married-couple family households, those with 1 or 2 children have the highest poverty rate, with 5 households (12.8%) falling below the poverty line. Among the single-parent households, those with 3 or 4 children have the highest poverty rate, with 1 household (100.0%) living below poverty.
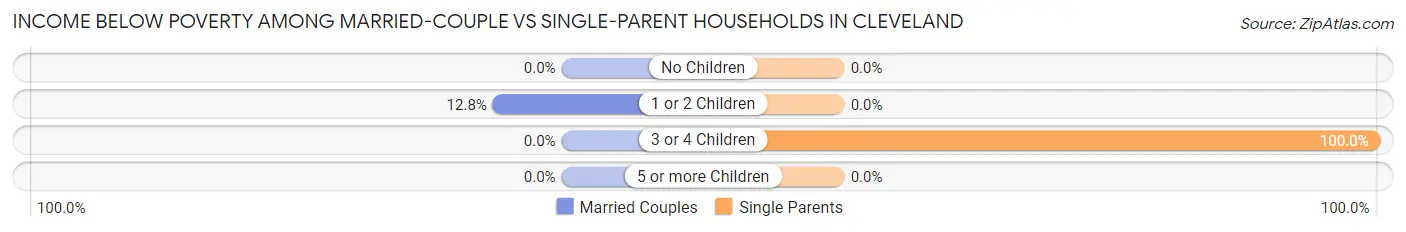
| Children | Married-Couple Families | Single-Parent Households |
| No Children | 0 (0.0%) | 0 (0.0%) |
| 1 or 2 Children | 5 (12.8%) | 0 (0.0%) |
| 3 or 4 Children | 0 (0.0%) | 1 (100.0%) |
| 5 or more Children | 0 (0.0%) | 0 (0.0%) |
| Total | 5 (3.5%) | 1 (33.3%) |
Race in Cleveland
The most populous races in Cleveland are White / Caucasian (449 | 89.6%), Native / Alaskan (35 | 7.0%), and Two or more Races (17 | 3.4%).
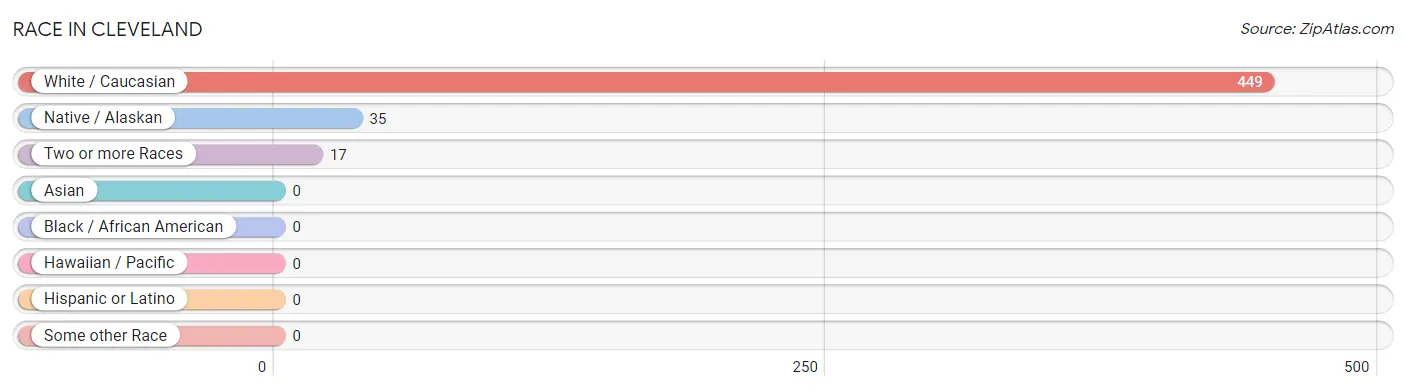
| Race | # Population | % Population |
| Asian | 0 | 0.0% |
| Black / African American | 0 | 0.0% |
| Hawaiian / Pacific | 0 | 0.0% |
| Hispanic or Latino | 0 | 0.0% |
| Native / Alaskan | 35 | 7.0% |
| White / Caucasian | 449 | 89.6% |
| Two or more Races | 17 | 3.4% |
| Some other Race | 0 | 0.0% |
| Total | 501 | 100.0% |
Ancestry in Cleveland
The most populous ancestries reported in Cleveland are English (181 | 36.1%), Danish (97 | 19.4%), German (43 | 8.6%), Navajo (35 | 7.0%), and Irish (34 | 6.8%), together accounting for 77.8% of all Cleveland residents.
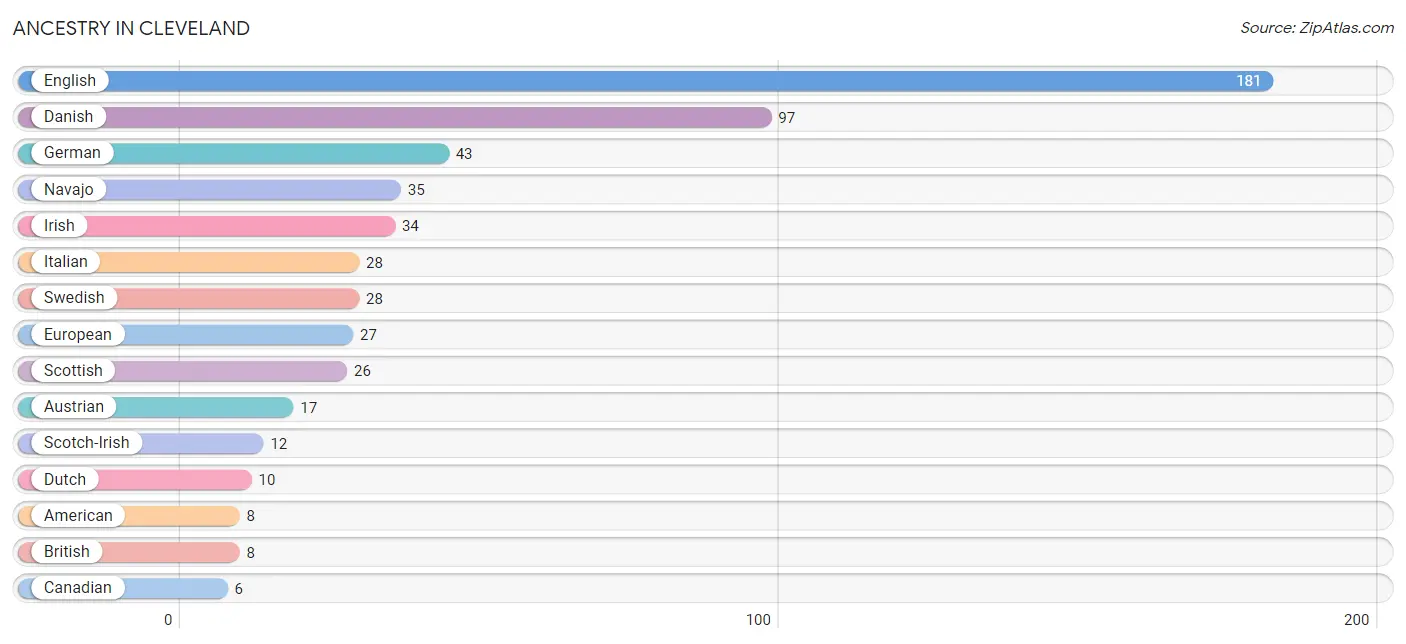
| Ancestry | # Population | % Population |
| American | 8 | 1.6% |
| Austrian | 17 | 3.4% |
| British | 8 | 1.6% |
| Canadian | 6 | 1.2% |
| Danish | 97 | 19.4% |
| Dutch | 10 | 2.0% |
| English | 181 | 36.1% |
| European | 27 | 5.4% |
| French | 3 | 0.6% |
| German | 43 | 8.6% |
| Irish | 34 | 6.8% |
| Italian | 28 | 5.6% |
| Navajo | 35 | 7.0% |
| Norwegian | 1 | 0.2% |
| Scandinavian | 6 | 1.2% |
| Scotch-Irish | 12 | 2.4% |
| Scottish | 26 | 5.2% |
| Swedish | 28 | 5.6% | View All 18 Rows |
Immigrants in Cleveland
The most numerous immigrant groups reported in Cleveland came from , and Canada (6 | 1.2%), together accounting for 1.2% of all Cleveland residents.

| Immigration Origin | # Population | % Population |
| Canada | 6 | 1.2% | View All 1 Rows |
Sex and Age in Cleveland
Sex and Age in Cleveland
The most populous age groups in Cleveland are 5 to 9 Years (35 | 14.3%) for men and 15 to 19 Years (38 | 14.8%) for women.
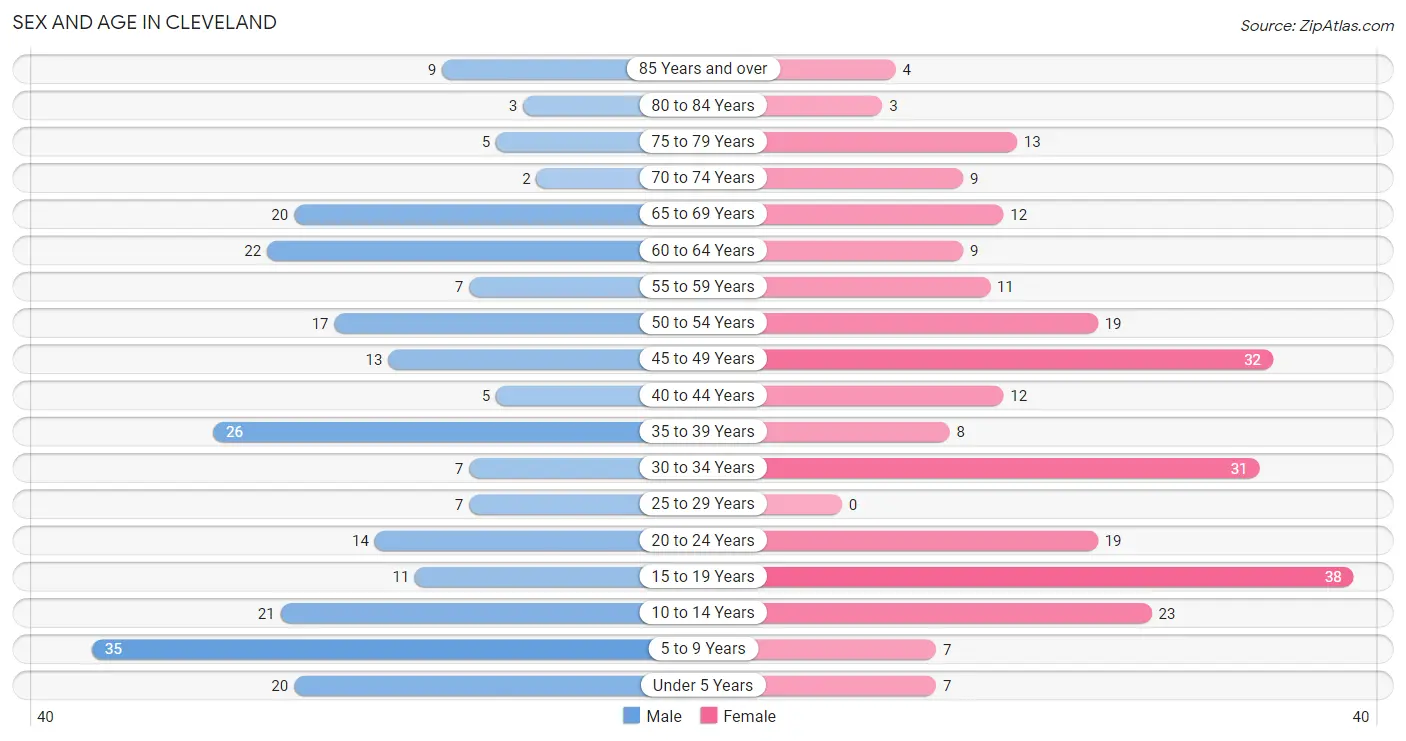
| Age Bracket | Male | Female |
| Under 5 Years | 20 (8.2%) | 7 (2.7%) |
| 5 to 9 Years | 35 (14.3%) | 7 (2.7%) |
| 10 to 14 Years | 21 (8.6%) | 23 (8.9%) |
| 15 to 19 Years | 11 (4.5%) | 38 (14.8%) |
| 20 to 24 Years | 14 (5.7%) | 19 (7.4%) |
| 25 to 29 Years | 7 (2.9%) | 0 (0.0%) |
| 30 to 34 Years | 7 (2.9%) | 31 (12.1%) |
| 35 to 39 Years | 26 (10.7%) | 8 (3.1%) |
| 40 to 44 Years | 5 (2.1%) | 12 (4.7%) |
| 45 to 49 Years | 13 (5.3%) | 32 (12.4%) |
| 50 to 54 Years | 17 (7.0%) | 19 (7.4%) |
| 55 to 59 Years | 7 (2.9%) | 11 (4.3%) |
| 60 to 64 Years | 22 (9.0%) | 9 (3.5%) |
| 65 to 69 Years | 20 (8.2%) | 12 (4.7%) |
| 70 to 74 Years | 2 (0.8%) | 9 (3.5%) |
| 75 to 79 Years | 5 (2.1%) | 13 (5.1%) |
| 80 to 84 Years | 3 (1.2%) | 3 (1.2%) |
| 85 Years and over | 9 (3.7%) | 4 (1.6%) |
| Total | 244 (100.0%) | 257 (100.0%) |
Families and Households in Cleveland
Median Family Size in Cleveland
The median family size in Cleveland is 3.21 persons per family, with single female/mother families (1 | 0.7%) accounting for the largest median family size of 8 persons per family. On the other hand, single male/father families (2 | 1.4%) represent the smallest median family size with 2.50 persons per family.
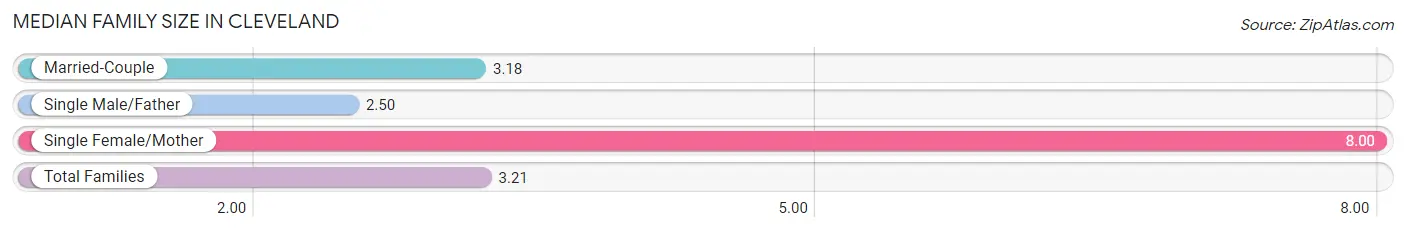
| Family Type | # Families | Family Size |
| Married-Couple | 143 (98.0%) | 3.18 |
| Single Male/Father | 2 (1.4%) | 2.50 |
| Single Female/Mother | 1 (0.7%) | 8.00 |
| Total Families | 146 (100.0%) | 3.21 |
Median Household Size in Cleveland
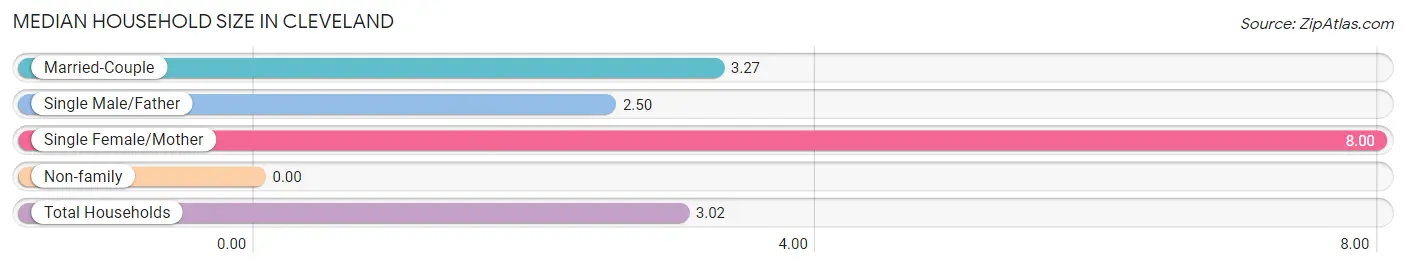
| Household Type | # Households | Household Size |
| Married-Couple | 143 (86.1%) | 3.27 |
| Single Male/Father | 2 (1.2%) | 2.50 |
| Single Female/Mother | 1 (0.6%) | 8.00 |
| Non-family | 20 (12.0%) | - |
| Total Households | 166 (100.0%) | 3.02 |
Household Size by Marriage Status in Cleveland
Out of a total of 166 households in Cleveland, 146 (87.9%) are family households, while 20 (12.0%) are nonfamily households. The most numerous type of family households are 2-person households, comprising 65, and the most common type of nonfamily households are 1-person households, comprising 20.
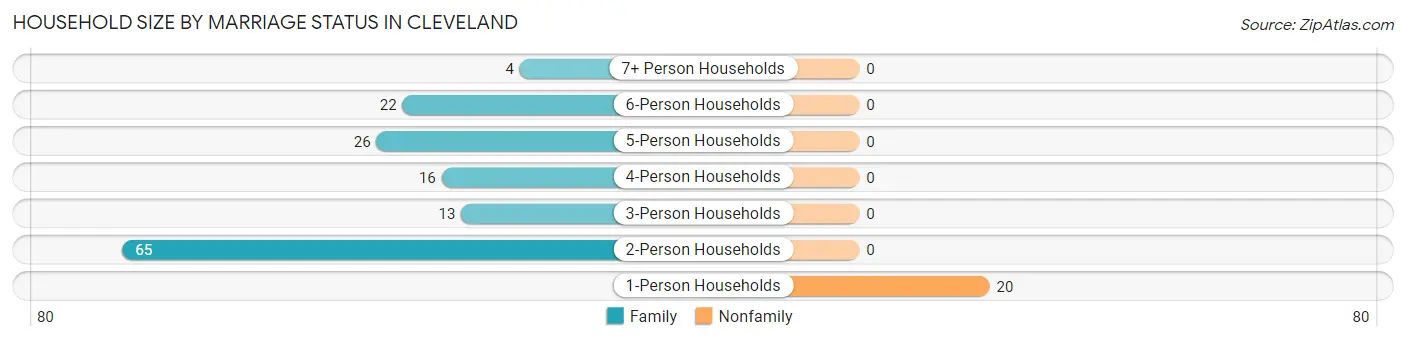
| Household Size | Family Households | Nonfamily Households |
| 1-Person Households | - | 20 (12.0%) |
| 2-Person Households | 65 (39.2%) | 0 (0.0%) |
| 3-Person Households | 13 (7.8%) | 0 (0.0%) |
| 4-Person Households | 16 (9.6%) | 0 (0.0%) |
| 5-Person Households | 26 (15.7%) | 0 (0.0%) |
| 6-Person Households | 22 (13.3%) | 0 (0.0%) |
| 7+ Person Households | 4 (2.4%) | 0 (0.0%) |
| Total | 146 (87.9%) | 20 (12.0%) |
Female Fertility in Cleveland
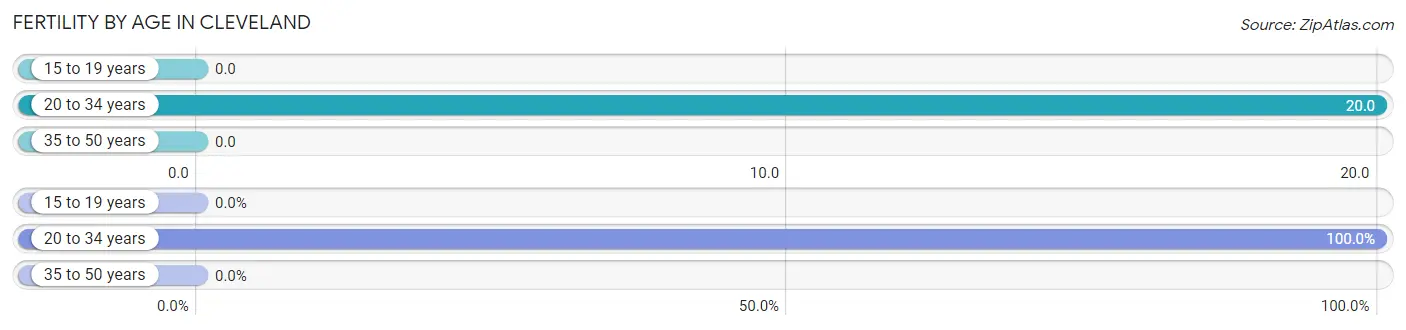
Fertility by Age in Cleveland
Average fertility rate in Cleveland is 7.0 births per 1,000 women. Women in the age bracket of 20 to 34 years have the highest fertility rate with 20.0 births per 1,000 women. Women in the age bracket of 20 to 34 years acount for 100.0% of all women with births.
| Age Bracket | Women with Births | Births / 1,000 Women |
| 15 to 19 years | 0 (0.0%) | 0.0 |
| 20 to 34 years | 1 (100.0%) | 20.0 |
| 35 to 50 years | 0 (0.0%) | 0.0 |
| Total | 1 (100.0%) | 7.0 |
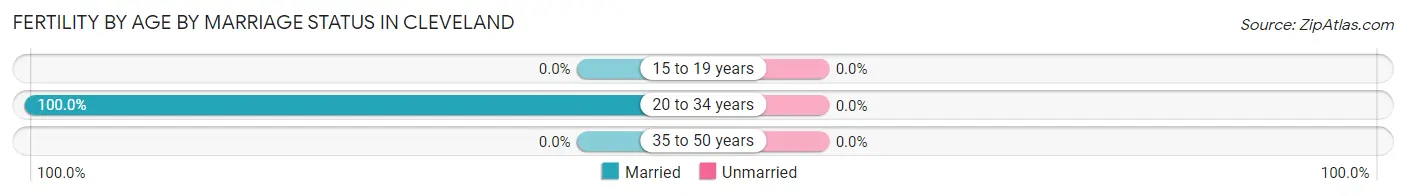
Fertility by Age by Marriage Status in Cleveland
| Age Bracket | Married | Unmarried |
| 15 to 19 years | 0 (0.0%) | 0 (0.0%) |
| 20 to 34 years | 1 (100.0%) | 0 (0.0%) |
| 35 to 50 years | 0 (0.0%) | 0 (0.0%) |
| Total | 1 (100.0%) | 0 (0.0%) |
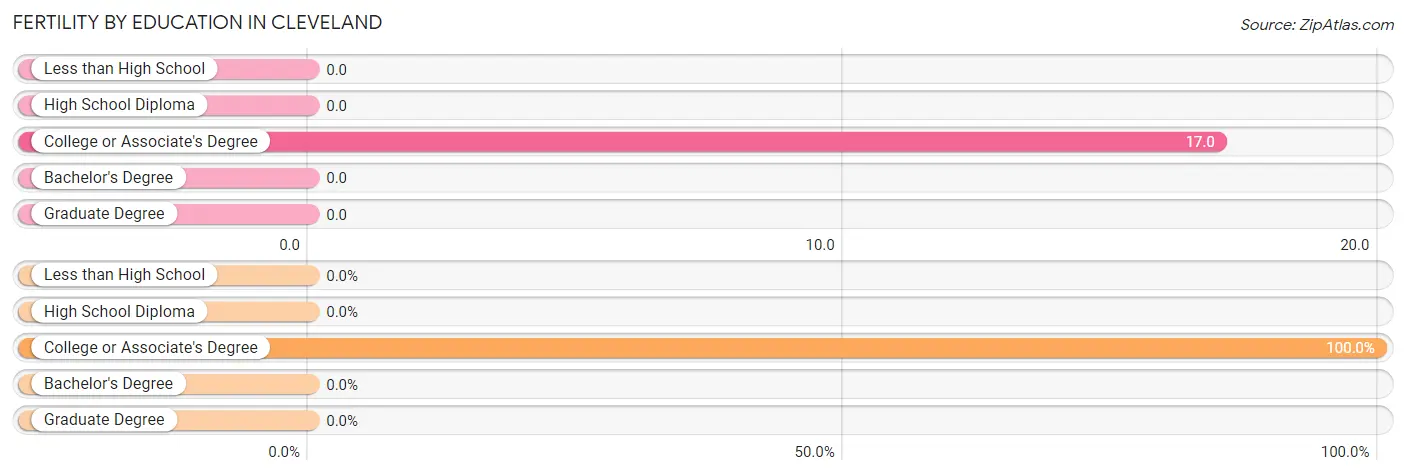
Fertility by Education in Cleveland
| Educational Attainment | Women with Births | Births / 1,000 Women |
| Less than High School | 0 (0.0%) | 0.0 |
| High School Diploma | 0 (0.0%) | 0.0 |
| College or Associate's Degree | 1 (100.0%) | 17.0 |
| Bachelor's Degree | 0 (0.0%) | 0.0 |
| Graduate Degree | 0 (0.0%) | 0.0 |
| Total | 1 (100.0%) | 7.0 |
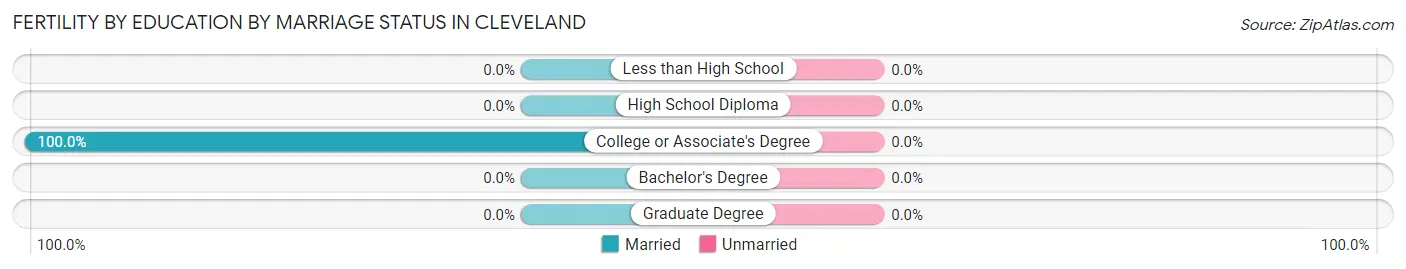
Fertility by Education by Marriage Status in Cleveland
| Educational Attainment | Married | Unmarried |
| Less than High School | 0 (0.0%) | 0 (0.0%) |
| High School Diploma | 0 (0.0%) | 0 (0.0%) |
| College or Associate's Degree | 1 (100.0%) | 0 (0.0%) |
| Bachelor's Degree | 0 (0.0%) | 0 (0.0%) |
| Graduate Degree | 0 (0.0%) | 0 (0.0%) |
| Total | 1 (100.0%) | 0 (0.0%) |
Employment Characteristics in Cleveland
Employment by Class of Employer in Cleveland
Among the 219 employed individuals in Cleveland, private company employees (171 | 78.1%), local government employees (23 | 10.5%), and self-employed (incorporated) (10 | 4.6%) make up the most common classes of employment.
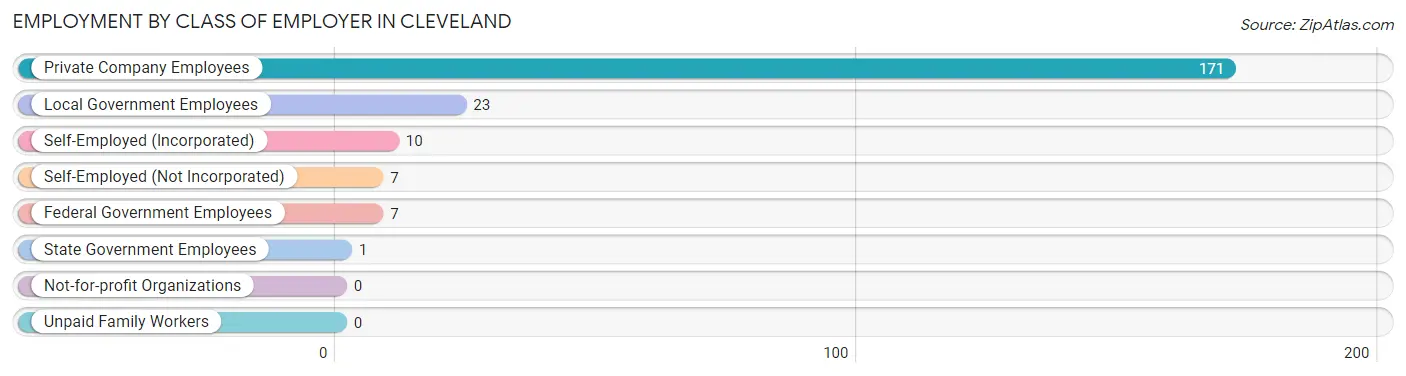
| Employer Class | # Employees | % Employees |
| Private Company Employees | 171 | 78.1% |
| Self-Employed (Incorporated) | 10 | 4.6% |
| Self-Employed (Not Incorporated) | 7 | 3.2% |
| Not-for-profit Organizations | 0 | 0.0% |
| Local Government Employees | 23 | 10.5% |
| State Government Employees | 1 | 0.5% |
| Federal Government Employees | 7 | 3.2% |
| Unpaid Family Workers | 0 | 0.0% |
| Total | 219 | 100.0% |
Employment Status by Age in Cleveland
According to the labor force statistics for Cleveland, out of the total population over 16 years of age (365), 60.5% or 221 individuals are in the labor force, with 0.9% or 2 of them unemployed. The age group with the highest labor force participation rate is 25 to 29 years, with 100.0% or 7 individuals in the labor force. Within the labor force, the 30 to 34 years age range has the highest percentage of unemployed individuals, with 5.4% or 2 of them being unemployed.
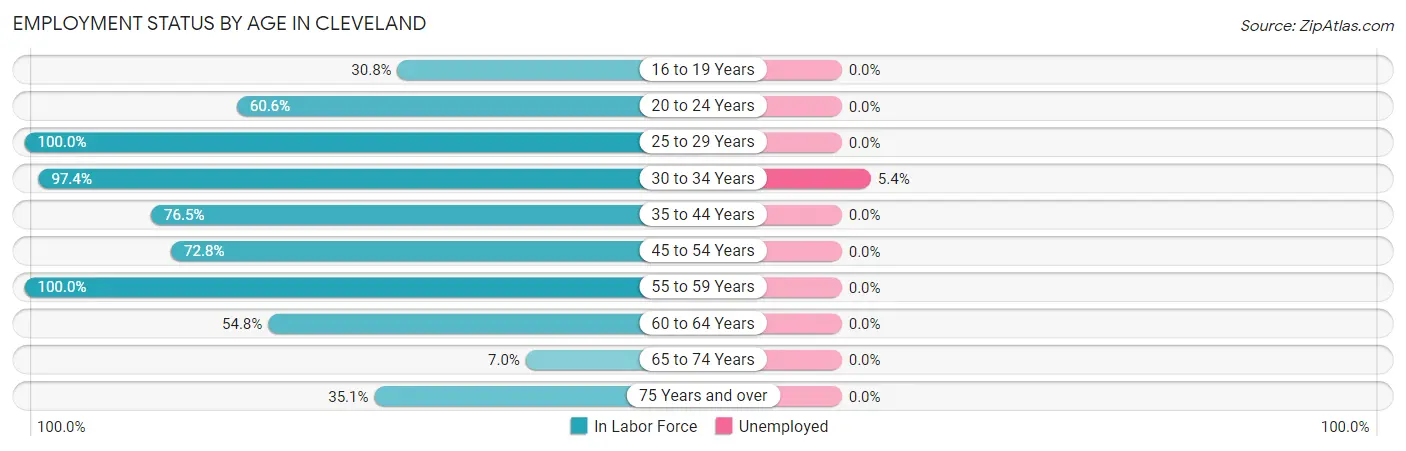
| Age Bracket | In Labor Force | Unemployed |
| 16 to 19 Years | 8 (30.8%) | 0 (0.0%) |
| 20 to 24 Years | 20 (60.6%) | 0 (0.0%) |
| 25 to 29 Years | 7 (100.0%) | 0 (0.0%) |
| 30 to 34 Years | 37 (97.4%) | 2 (5.4%) |
| 35 to 44 Years | 39 (76.5%) | 0 (0.0%) |
| 45 to 54 Years | 59 (72.8%) | 0 (0.0%) |
| 55 to 59 Years | 18 (100.0%) | 0 (0.0%) |
| 60 to 64 Years | 17 (54.8%) | 0 (0.0%) |
| 65 to 74 Years | 3 (7.0%) | 0 (0.0%) |
| 75 Years and over | 13 (35.1%) | 0 (0.0%) |
| Total | 221 (60.5%) | 2 (0.9%) |
Employment Status by Educational Attainment in Cleveland
According to labor force statistics for Cleveland, 78.3% of individuals (177) out of the total population between 25 and 64 years of age (226) are in the labor force, with 1.1% or 2 of them being unemployed. The group with the highest labor force participation rate are those with the educational attainment of bachelor's degree or higher, with 87.5% or 28 individuals in the labor force. Within the labor force, individuals with college / associate degree education have the highest percentage of unemployment, with 2.1% or 2 of them being unemployed.
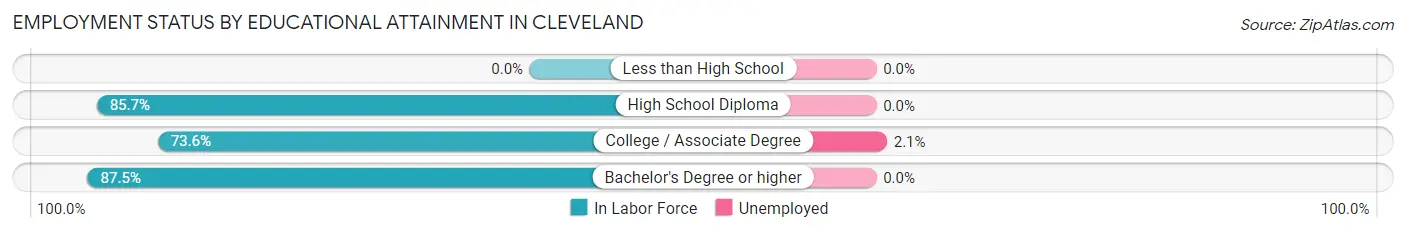
| Educational Attainment | In Labor Force | Unemployed |
| Less than High School | 0 (0.0%) | 0 (0.0%) |
| High School Diploma | 54 (85.7%) | 0 (0.0%) |
| College / Associate Degree | 95 (73.6%) | 3 (2.1%) |
| Bachelor's Degree or higher | 28 (87.5%) | 0 (0.0%) |
| Total | 177 (78.3%) | 2 (1.1%) |
Employment Occupations by Sex in Cleveland
Management, Business, Science and Arts Occupations
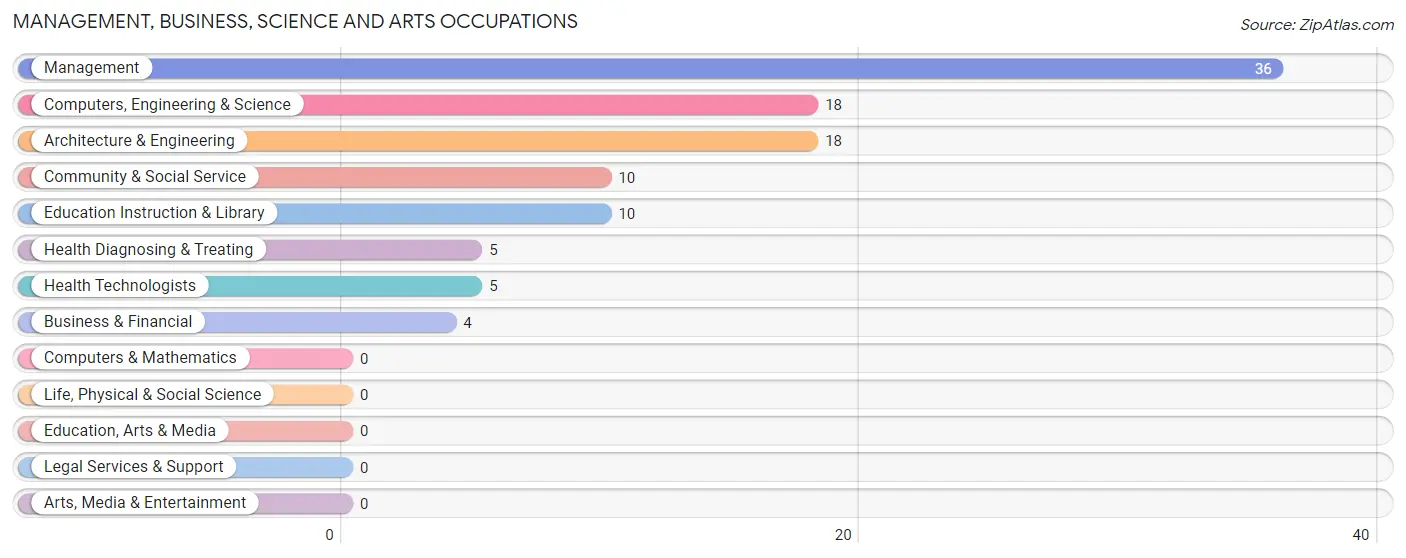
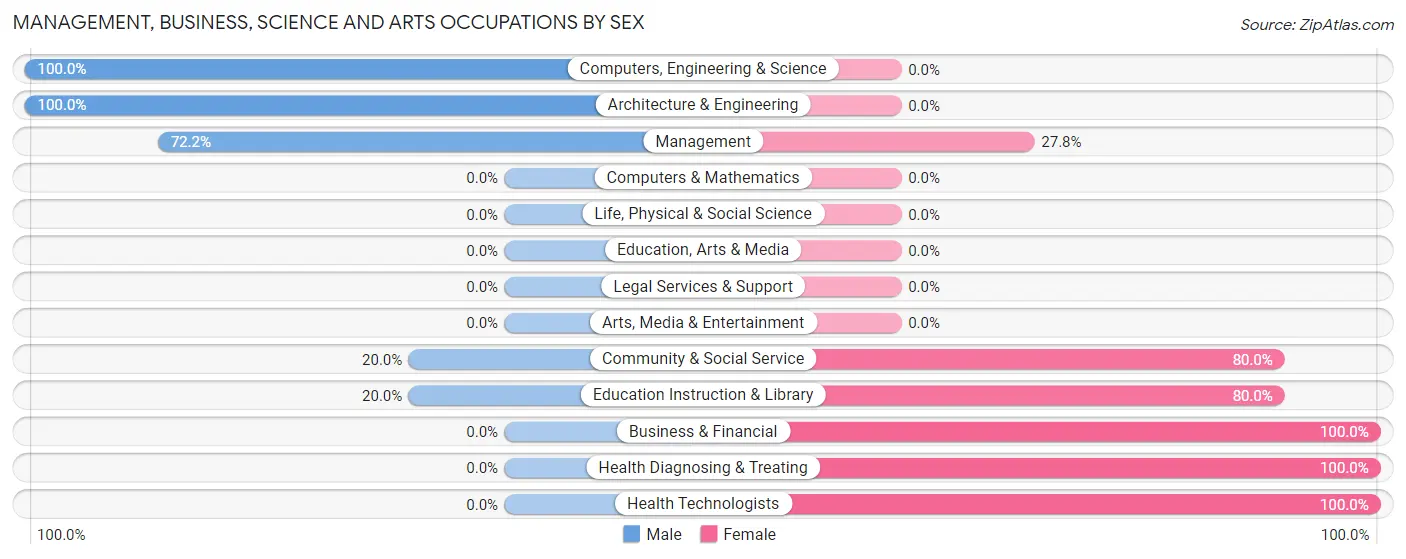
The most common Management, Business, Science and Arts occupations in Cleveland are Management (36 | 16.4%), Computers, Engineering & Science (18 | 8.2%), Architecture & Engineering (18 | 8.2%), Community & Social Service (10 | 4.6%), and Education Instruction & Library (10 | 4.6%).
Management, Business, Science and Arts Occupations by Sex
Within the Management, Business, Science and Arts occupations in Cleveland, the most male-oriented occupations are Computers, Engineering & Science (100.0%), Architecture & Engineering (100.0%), and Management (72.2%), while the most female-oriented occupations are Business & Financial (100.0%), Health Diagnosing & Treating (100.0%), and Health Technologists (100.0%).
| Occupation | Male | Female |
| Management | 26 (72.2%) | 10 (27.8%) |
| Business & Financial | 0 (0.0%) | 4 (100.0%) |
| Computers, Engineering & Science | 18 (100.0%) | 0 (0.0%) |
| Computers & Mathematics | 0 (0.0%) | 0 (0.0%) |
| Architecture & Engineering | 18 (100.0%) | 0 (0.0%) |
| Life, Physical & Social Science | 0 (0.0%) | 0 (0.0%) |
| Community & Social Service | 2 (20.0%) | 8 (80.0%) |
| Education, Arts & Media | 0 (0.0%) | 0 (0.0%) |
| Legal Services & Support | 0 (0.0%) | 0 (0.0%) |
| Education Instruction & Library | 2 (20.0%) | 8 (80.0%) |
| Arts, Media & Entertainment | 0 (0.0%) | 0 (0.0%) |
| Health Diagnosing & Treating | 0 (0.0%) | 5 (100.0%) |
| Health Technologists | 0 (0.0%) | 5 (100.0%) |
| Total (Category) | 46 (63.0%) | 27 (37.0%) |
| Total (Overall) | 106 (48.4%) | 113 (51.6%) |
Services Occupations
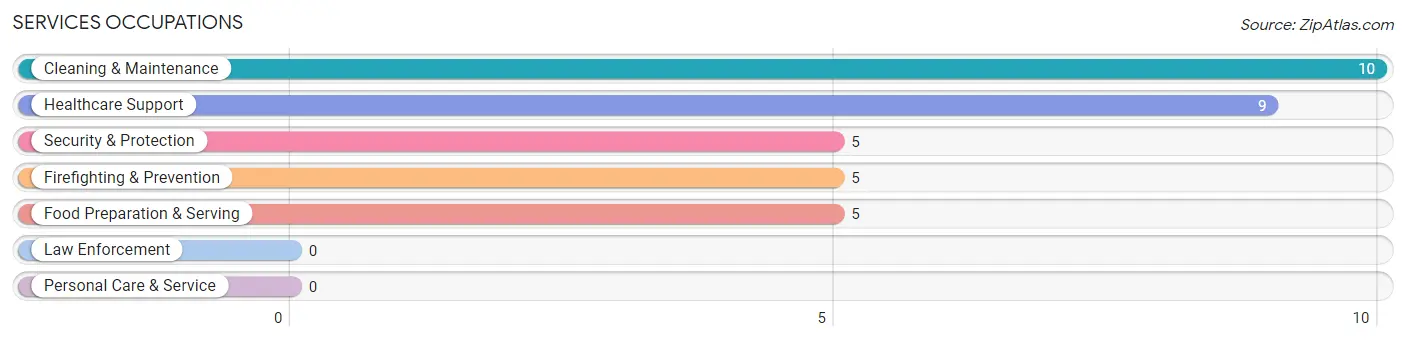
The most common Services occupations in Cleveland are Cleaning & Maintenance (10 | 4.6%), Healthcare Support (9 | 4.1%), Security & Protection (5 | 2.3%), Firefighting & Prevention (5 | 2.3%), and Food Preparation & Serving (5 | 2.3%).
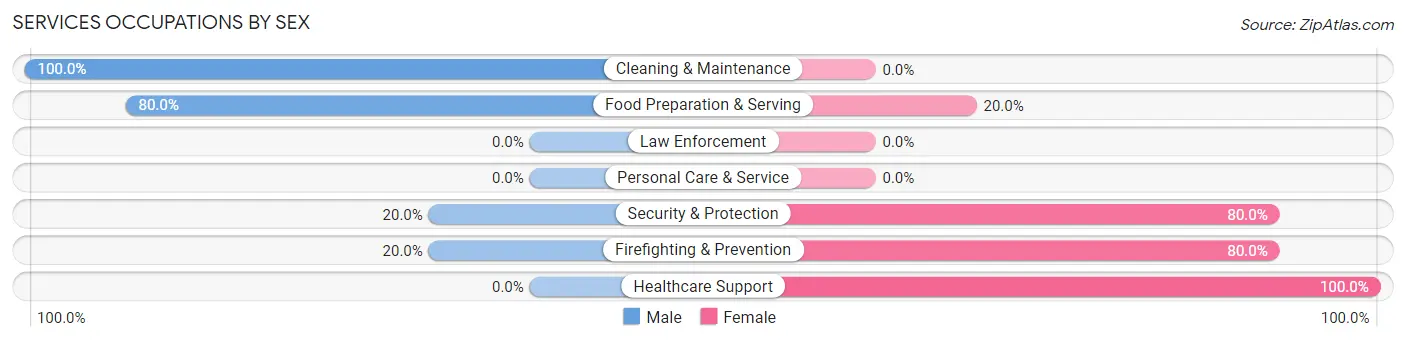
Services Occupations by Sex
Within the Services occupations in Cleveland, the most male-oriented occupations are Cleaning & Maintenance (100.0%), Food Preparation & Serving (80.0%), and Security & Protection (20.0%), while the most female-oriented occupations are Healthcare Support (100.0%), Security & Protection (80.0%), and Firefighting & Prevention (80.0%).
| Occupation | Male | Female |
| Healthcare Support | 0 (0.0%) | 9 (100.0%) |
| Security & Protection | 1 (20.0%) | 4 (80.0%) |
| Firefighting & Prevention | 1 (20.0%) | 4 (80.0%) |
| Law Enforcement | 0 (0.0%) | 0 (0.0%) |
| Food Preparation & Serving | 4 (80.0%) | 1 (20.0%) |
| Cleaning & Maintenance | 10 (100.0%) | 0 (0.0%) |
| Personal Care & Service | 0 (0.0%) | 0 (0.0%) |
| Total (Category) | 15 (51.7%) | 14 (48.3%) |
| Total (Overall) | 106 (48.4%) | 113 (51.6%) |
Sales and Office Occupations
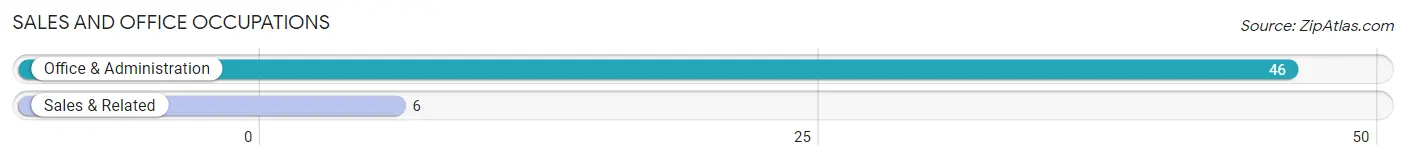
The most common Sales and Office occupations in Cleveland are Office & Administration (46 | 21.0%), and Sales & Related (6 | 2.7%).
Sales and Office Occupations by Sex
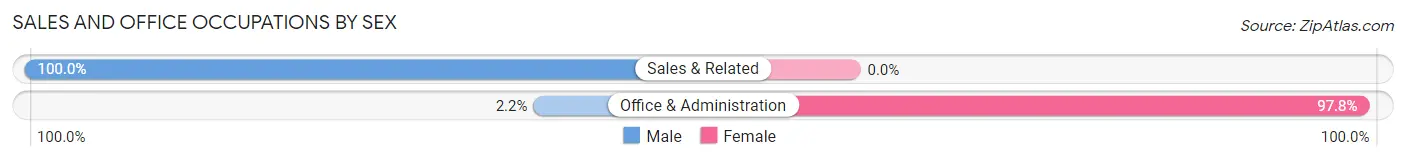
| Occupation | Male | Female |
| Sales & Related | 6 (100.0%) | 0 (0.0%) |
| Office & Administration | 1 (2.2%) | 45 (97.8%) |
| Total (Category) | 7 (13.5%) | 45 (86.5%) |
| Total (Overall) | 106 (48.4%) | 113 (51.6%) |
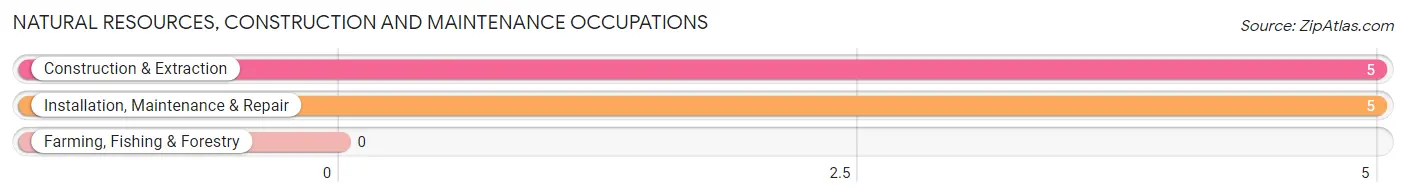
Natural Resources, Construction and Maintenance Occupations
The most common Natural Resources, Construction and Maintenance occupations in Cleveland are Construction & Extraction (5 | 2.3%), and Installation, Maintenance & Repair (5 | 2.3%).
Natural Resources, Construction and Maintenance Occupations by Sex
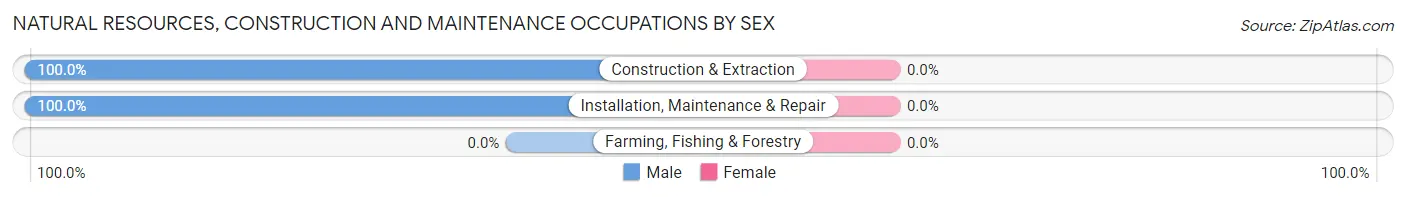
| Occupation | Male | Female |
| Farming, Fishing & Forestry | 0 (0.0%) | 0 (0.0%) |
| Construction & Extraction | 5 (100.0%) | 0 (0.0%) |
| Installation, Maintenance & Repair | 5 (100.0%) | 0 (0.0%) |
| Total (Category) | 10 (100.0%) | 0 (0.0%) |
| Total (Overall) | 106 (48.4%) | 113 (51.6%) |
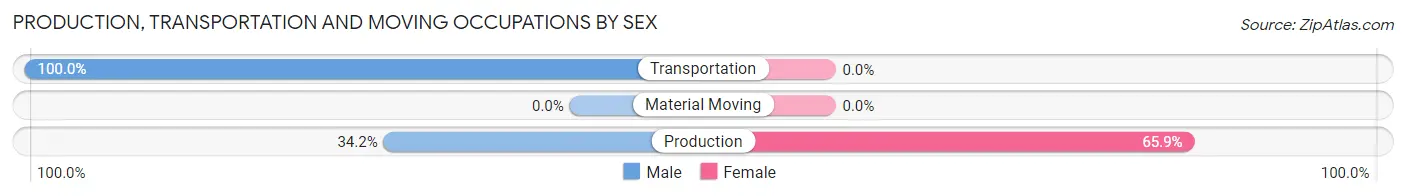
Production, Transportation and Moving Occupations
The most common Production, Transportation and Moving occupations in Cleveland are Production (41 | 18.7%), and Transportation (14 | 6.4%).
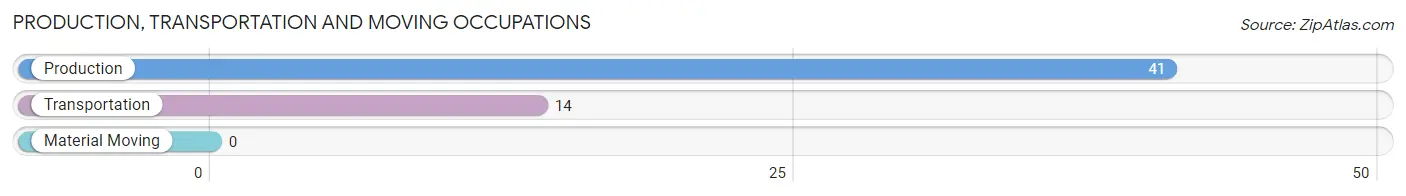
Production, Transportation and Moving Occupations by Sex
| Occupation | Male | Female |
| Production | 14 (34.2%) | 27 (65.8%) |
| Transportation | 14 (100.0%) | 0 (0.0%) |
| Material Moving | 0 (0.0%) | 0 (0.0%) |
| Total (Category) | 28 (50.9%) | 27 (49.1%) |
| Total (Overall) | 106 (48.4%) | 113 (51.6%) |
Employment Industries by Sex in Cleveland
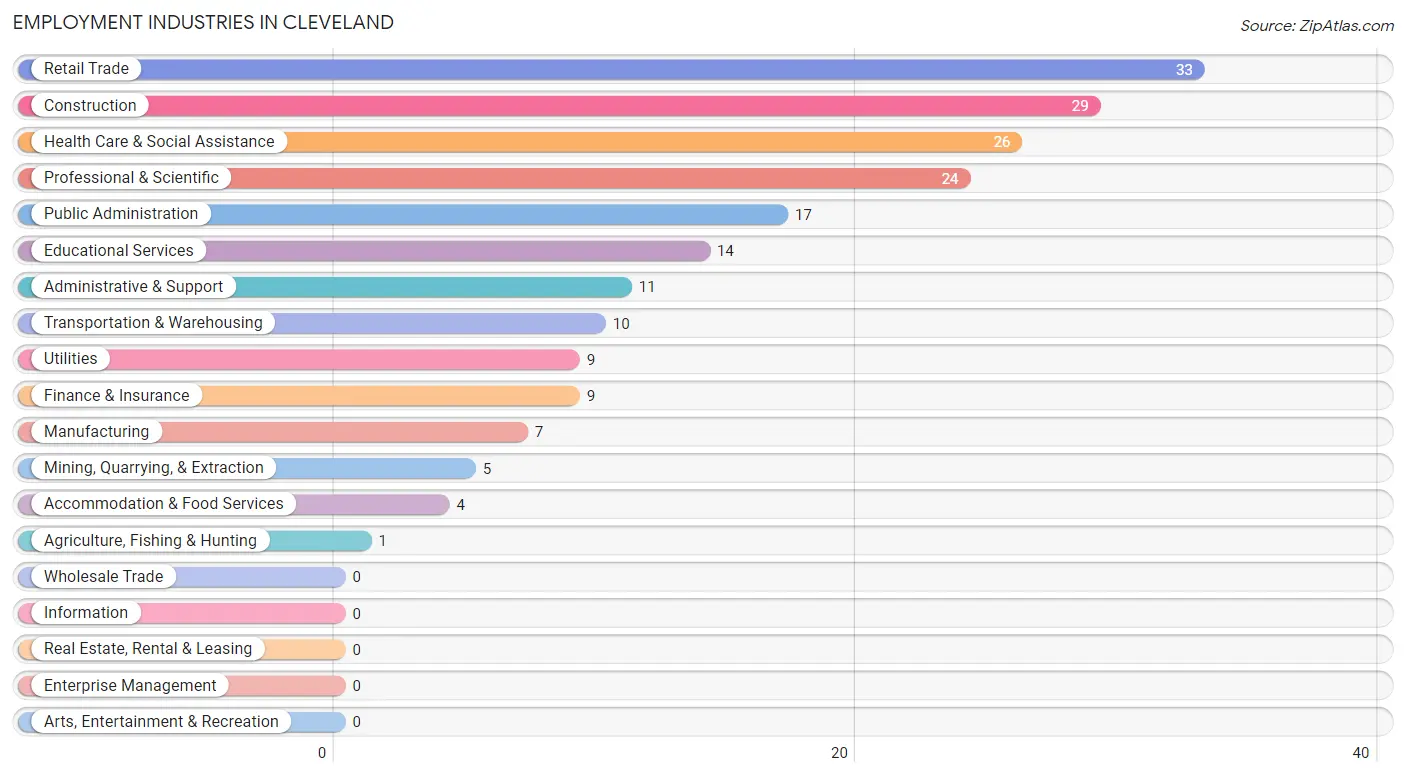
Employment Industries in Cleveland
The major employment industries in Cleveland include Retail Trade (33 | 15.1%), Construction (29 | 13.2%), Health Care & Social Assistance (26 | 11.9%), Professional & Scientific (24 | 11.0%), and Public Administration (17 | 7.8%).
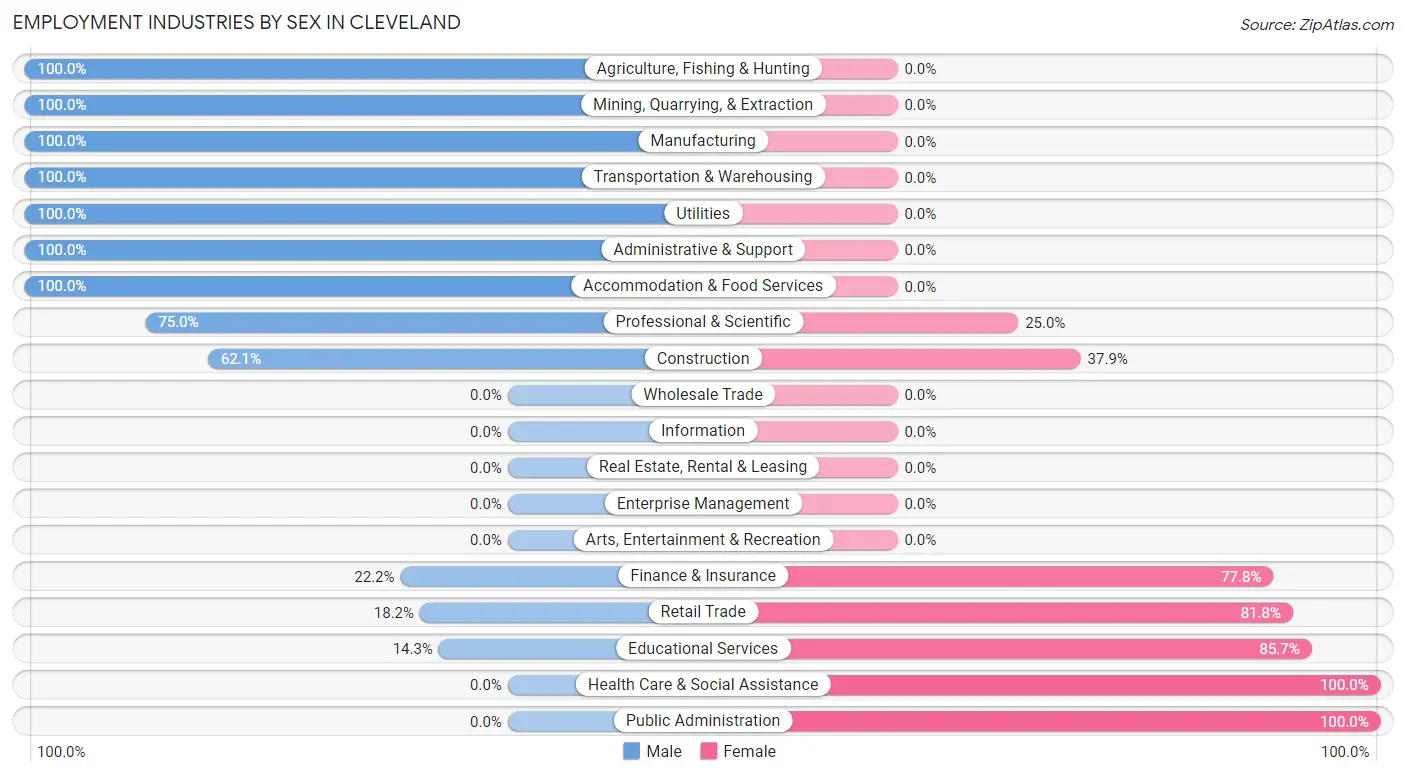
Employment Industries by Sex in Cleveland
The Cleveland industries that see more men than women are Agriculture, Fishing & Hunting (100.0%), Mining, Quarrying, & Extraction (100.0%), and Manufacturing (100.0%), whereas the industries that tend to have a higher number of women are Health Care & Social Assistance (100.0%), Public Administration (100.0%), and Educational Services (85.7%).
| Industry | Male | Female |
| Agriculture, Fishing & Hunting | 1 (100.0%) | 0 (0.0%) |
| Mining, Quarrying, & Extraction | 5 (100.0%) | 0 (0.0%) |
| Construction | 18 (62.1%) | 11 (37.9%) |
| Manufacturing | 7 (100.0%) | 0 (0.0%) |
| Wholesale Trade | 0 (0.0%) | 0 (0.0%) |
| Retail Trade | 6 (18.2%) | 27 (81.8%) |
| Transportation & Warehousing | 10 (100.0%) | 0 (0.0%) |
| Utilities | 9 (100.0%) | 0 (0.0%) |
| Information | 0 (0.0%) | 0 (0.0%) |
| Finance & Insurance | 2 (22.2%) | 7 (77.8%) |
| Real Estate, Rental & Leasing | 0 (0.0%) | 0 (0.0%) |
| Professional & Scientific | 18 (75.0%) | 6 (25.0%) |
| Enterprise Management | 0 (0.0%) | 0 (0.0%) |
| Administrative & Support | 11 (100.0%) | 0 (0.0%) |
| Educational Services | 2 (14.3%) | 12 (85.7%) |
| Health Care & Social Assistance | 0 (0.0%) | 26 (100.0%) |
| Arts, Entertainment & Recreation | 0 (0.0%) | 0 (0.0%) |
| Accommodation & Food Services | 4 (100.0%) | 0 (0.0%) |
| Public Administration | 0 (0.0%) | 17 (100.0%) |
| Total | 106 (48.4%) | 113 (51.6%) |
Education in Cleveland
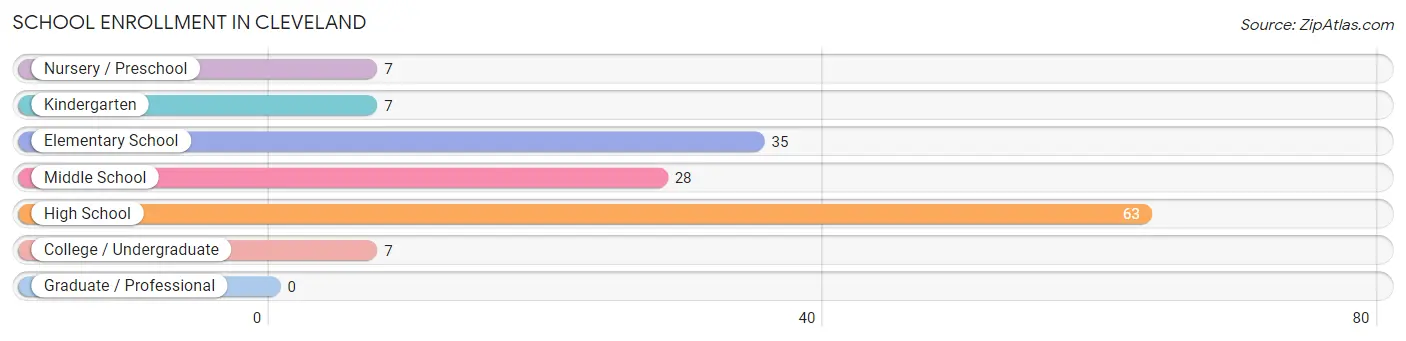
School Enrollment in Cleveland
The most common levels of schooling among the 147 students in Cleveland are high school (63 | 42.9%), elementary school (35 | 23.8%), and middle school (28 | 19.1%).
| School Level | # Students | % Students |
| Nursery / Preschool | 7 | 4.8% |
| Kindergarten | 7 | 4.8% |
| Elementary School | 35 | 23.8% |
| Middle School | 28 | 19.1% |
| High School | 63 | 42.9% |
| College / Undergraduate | 7 | 4.8% |
| Graduate / Professional | 0 | 0.0% |
| Total | 147 | 100.0% |
School Enrollment by Age by Funding Source in Cleveland
Out of a total of 147 students who are enrolled in schools in Cleveland, 3 (2.0%) attend a private institution, while the remaining 144 (98.0%) are enrolled in public schools. The age group of 3 to 4 year olds has the highest likelihood of being enrolled in private schools, with 3 (42.9% in the age bracket) enrolled. Conversely, the age group of 5 to 9 year old has the lowest likelihood of being enrolled in a private school, with 42 (100.0% in the age bracket) attending a public institution.
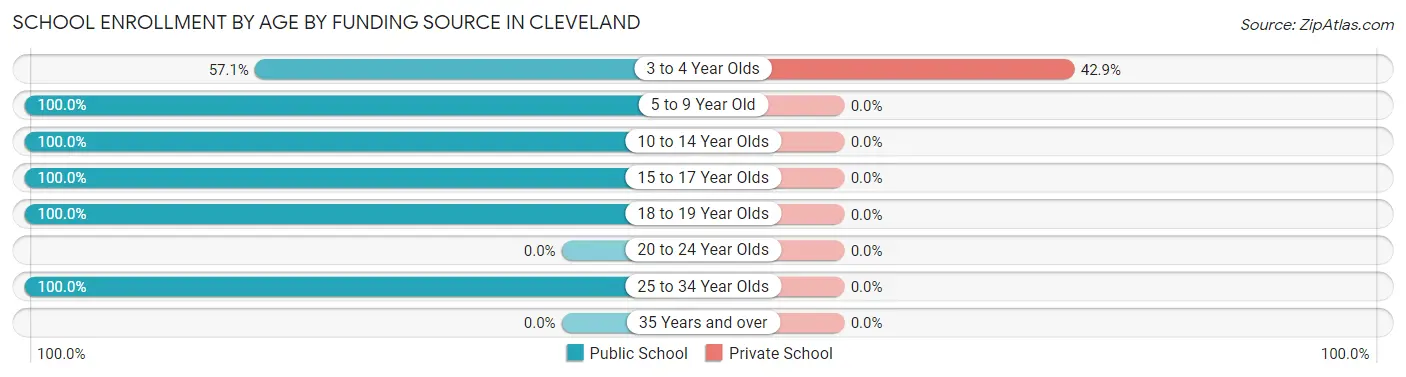
| Age Bracket | Public School | Private School |
| 3 to 4 Year Olds | 4 (57.1%) | 3 (42.9%) |
| 5 to 9 Year Old | 42 (100.0%) | 0 (0.0%) |
| 10 to 14 Year Olds | 44 (100.0%) | 0 (0.0%) |
| 15 to 17 Year Olds | 41 (100.0%) | 0 (0.0%) |
| 18 to 19 Year Olds | 7 (100.0%) | 0 (0.0%) |
| 20 to 24 Year Olds | 0 (0.0%) | 0 (0.0%) |
| 25 to 34 Year Olds | 6 (100.0%) | 0 (0.0%) |
| 35 Years and over | 0 (0.0%) | 0 (0.0%) |
| Total | 144 (98.0%) | 3 (2.0%) |
Educational Attainment by Field of Study in Cleveland
Education (13 | 26.0%), computers & mathematics (7 | 14.0%), arts & humanities (7 | 14.0%), science & technology (6 | 12.0%), and business (5 | 10.0%) are the most common fields of study among 50 individuals in Cleveland who have obtained a bachelor's degree or higher.
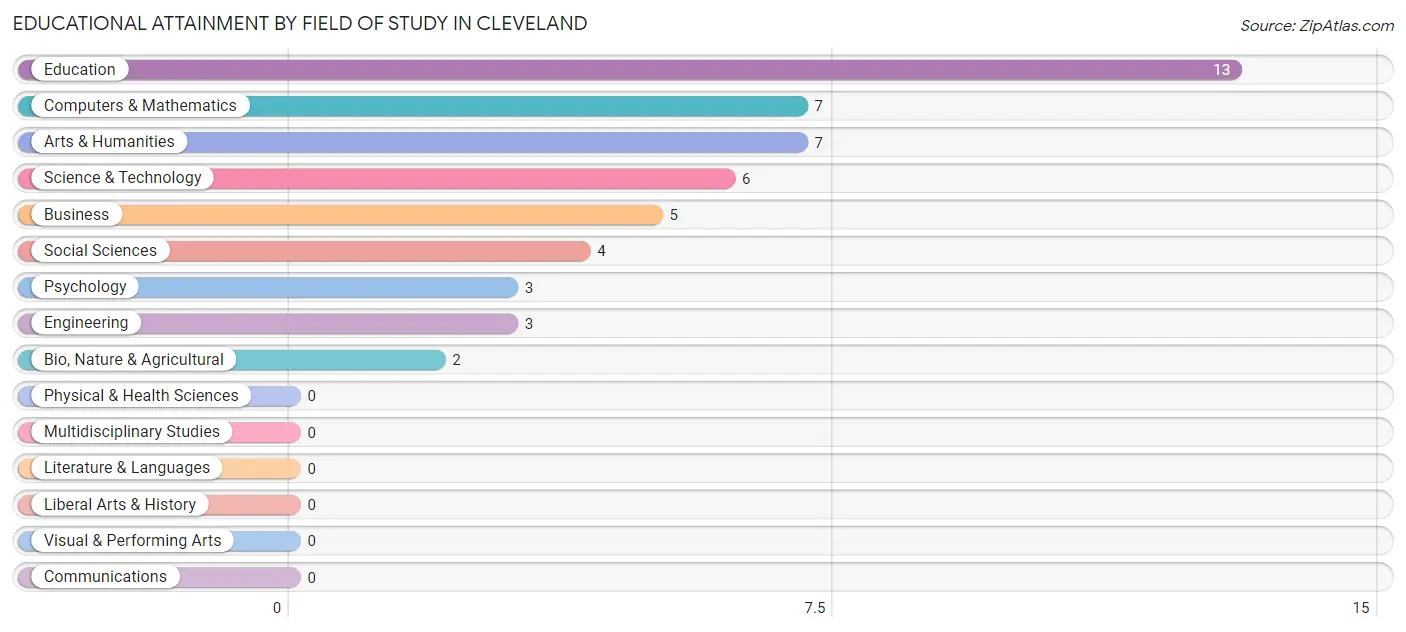
| Field of Study | # Graduates | % Graduates |
| Computers & Mathematics | 7 | 14.0% |
| Bio, Nature & Agricultural | 2 | 4.0% |
| Physical & Health Sciences | 0 | 0.0% |
| Psychology | 3 | 6.0% |
| Social Sciences | 4 | 8.0% |
| Engineering | 3 | 6.0% |
| Multidisciplinary Studies | 0 | 0.0% |
| Science & Technology | 6 | 12.0% |
| Business | 5 | 10.0% |
| Education | 13 | 26.0% |
| Literature & Languages | 0 | 0.0% |
| Liberal Arts & History | 0 | 0.0% |
| Visual & Performing Arts | 0 | 0.0% |
| Communications | 0 | 0.0% |
| Arts & Humanities | 7 | 14.0% |
| Total | 50 | 100.0% |
Transportation & Commute in Cleveland
Vehicle Availability by Sex in Cleveland
The most prevalent vehicle ownership categories in Cleveland are males with 5 or more vehicles (42, accounting for 39.6%) and females with 5 or more vehicles (36, making up 37.2%).
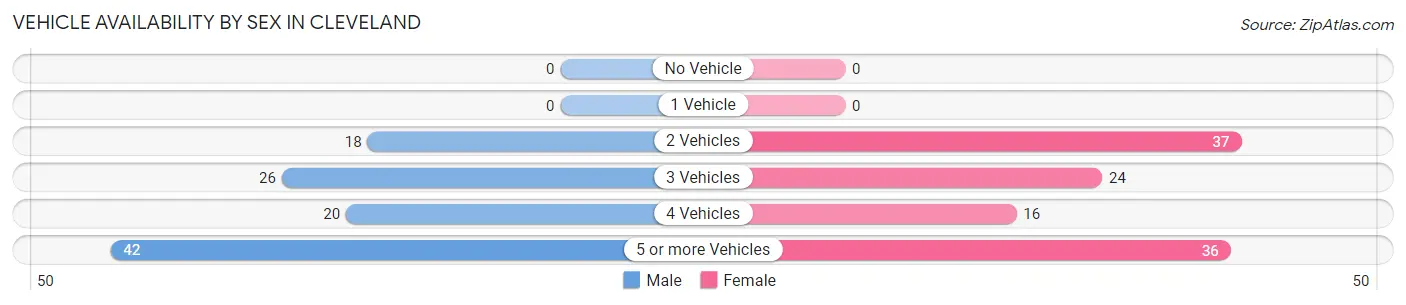
| Vehicles Available | Male | Female |
| No Vehicle | 0 (0.0%) | 0 (0.0%) |
| 1 Vehicle | 0 (0.0%) | 0 (0.0%) |
| 2 Vehicles | 18 (17.0%) | 37 (32.7%) |
| 3 Vehicles | 26 (24.5%) | 24 (21.2%) |
| 4 Vehicles | 20 (18.9%) | 16 (14.2%) |
| 5 or more Vehicles | 42 (39.6%) | 36 (31.9%) |
| Total | 106 (100.0%) | 113 (100.0%) |
Commute Time in Cleveland
The most frequently occuring commute durations in Cleveland are 20 to 24 minutes (45 commuters, 22.6%), 25 to 29 minutes (44 commuters, 22.1%), and 5 to 9 minutes (36 commuters, 18.1%).
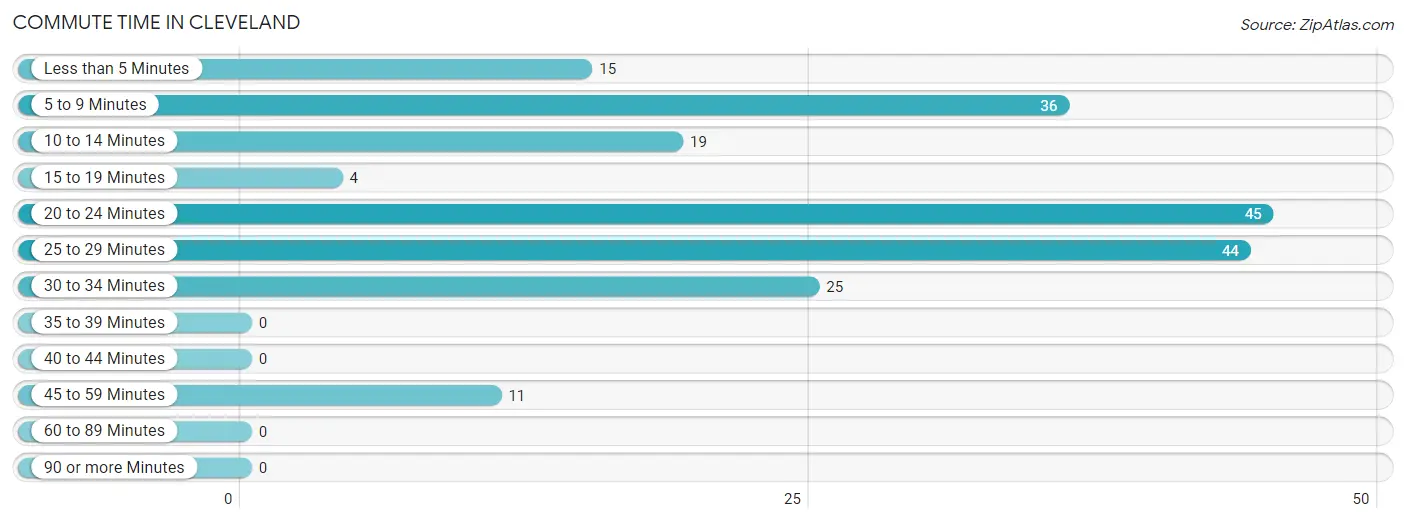
| Commute Time | # Commuters | % Commuters |
| Less than 5 Minutes | 15 | 7.5% |
| 5 to 9 Minutes | 36 | 18.1% |
| 10 to 14 Minutes | 19 | 9.6% |
| 15 to 19 Minutes | 4 | 2.0% |
| 20 to 24 Minutes | 45 | 22.6% |
| 25 to 29 Minutes | 44 | 22.1% |
| 30 to 34 Minutes | 25 | 12.6% |
| 35 to 39 Minutes | 0 | 0.0% |
| 40 to 44 Minutes | 0 | 0.0% |
| 45 to 59 Minutes | 11 | 5.5% |
| 60 to 89 Minutes | 0 | 0.0% |
| 90 or more Minutes | 0 | 0.0% |
Commute Time by Sex in Cleveland
The most common commute times in Cleveland are 25 to 29 minutes (25 commuters, 24.3%) for males and 20 to 24 minutes (24 commuters, 25.0%) for females.
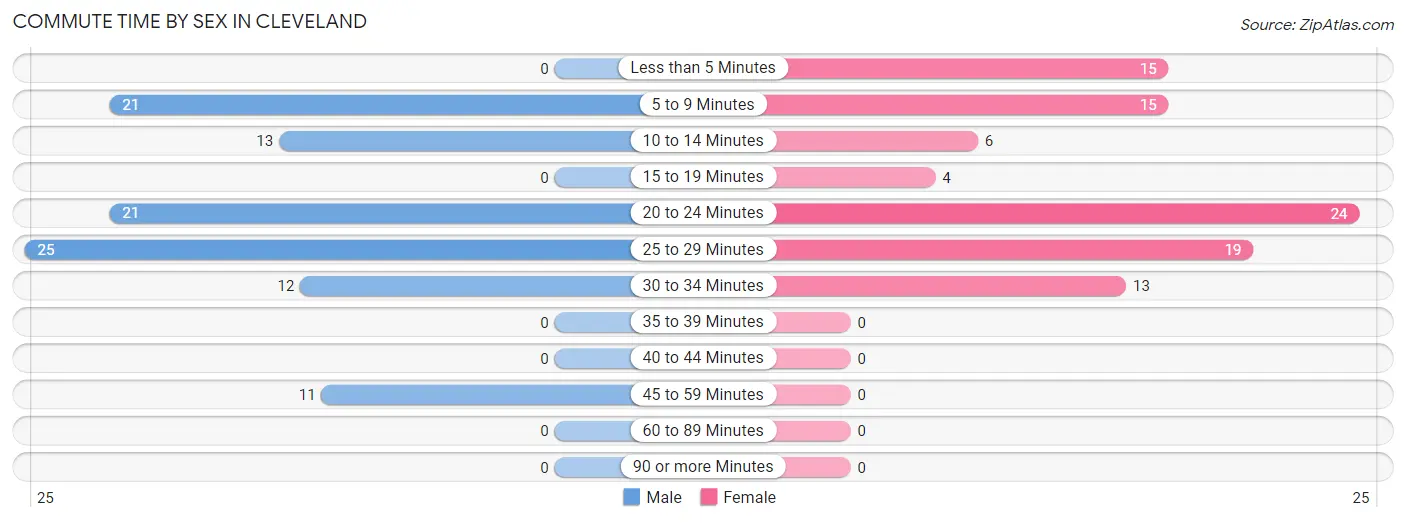
| Commute Time | Male | Female |
| Less than 5 Minutes | 0 (0.0%) | 15 (15.6%) |
| 5 to 9 Minutes | 21 (20.4%) | 15 (15.6%) |
| 10 to 14 Minutes | 13 (12.6%) | 6 (6.2%) |
| 15 to 19 Minutes | 0 (0.0%) | 4 (4.2%) |
| 20 to 24 Minutes | 21 (20.4%) | 24 (25.0%) |
| 25 to 29 Minutes | 25 (24.3%) | 19 (19.8%) |
| 30 to 34 Minutes | 12 (11.7%) | 13 (13.5%) |
| 35 to 39 Minutes | 0 (0.0%) | 0 (0.0%) |
| 40 to 44 Minutes | 0 (0.0%) | 0 (0.0%) |
| 45 to 59 Minutes | 11 (10.7%) | 0 (0.0%) |
| 60 to 89 Minutes | 0 (0.0%) | 0 (0.0%) |
| 90 or more Minutes | 0 (0.0%) | 0 (0.0%) |
Time of Departure to Work by Sex in Cleveland
The most frequent times of departure to work in Cleveland are 6:30 AM to 6:59 AM (25, 24.3%) for males and 6:30 AM to 6:59 AM (27, 28.1%) for females.
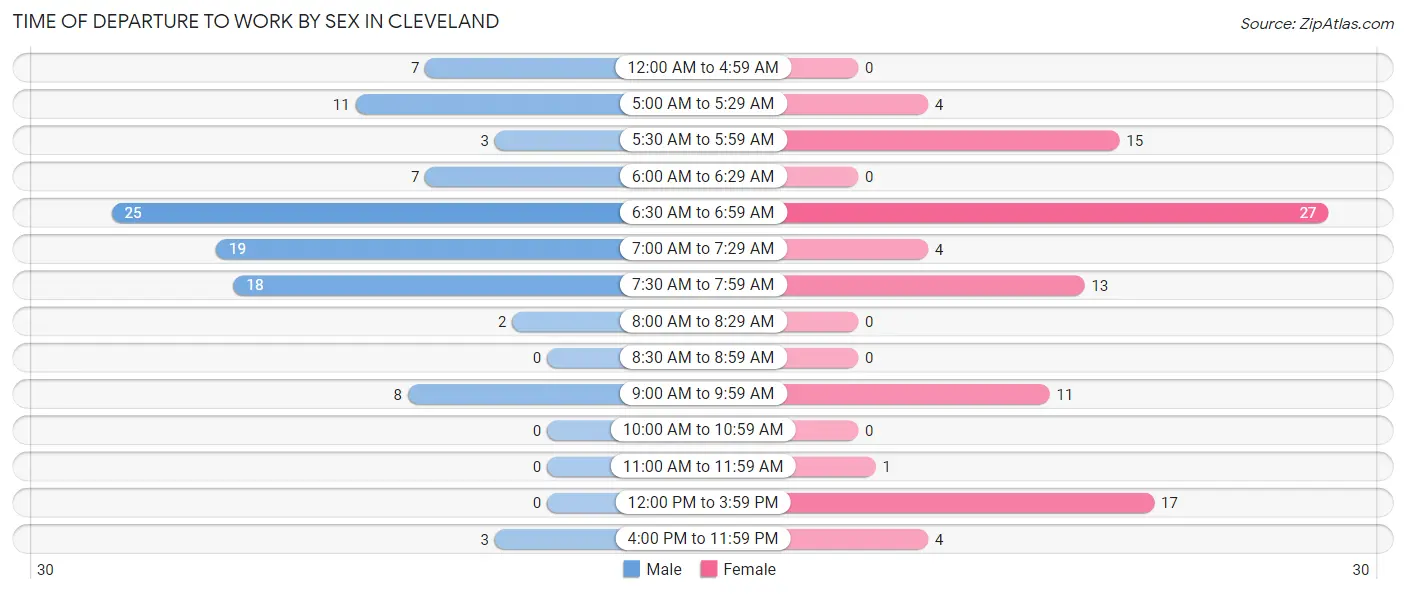
| Time of Departure | Male | Female |
| 12:00 AM to 4:59 AM | 7 (6.8%) | 0 (0.0%) |
| 5:00 AM to 5:29 AM | 11 (10.7%) | 4 (4.2%) |
| 5:30 AM to 5:59 AM | 3 (2.9%) | 15 (15.6%) |
| 6:00 AM to 6:29 AM | 7 (6.8%) | 0 (0.0%) |
| 6:30 AM to 6:59 AM | 25 (24.3%) | 27 (28.1%) |
| 7:00 AM to 7:29 AM | 19 (18.4%) | 4 (4.2%) |
| 7:30 AM to 7:59 AM | 18 (17.5%) | 13 (13.5%) |
| 8:00 AM to 8:29 AM | 2 (1.9%) | 0 (0.0%) |
| 8:30 AM to 8:59 AM | 0 (0.0%) | 0 (0.0%) |
| 9:00 AM to 9:59 AM | 8 (7.8%) | 11 (11.5%) |
| 10:00 AM to 10:59 AM | 0 (0.0%) | 0 (0.0%) |
| 11:00 AM to 11:59 AM | 0 (0.0%) | 1 (1.0%) |
| 12:00 PM to 3:59 PM | 0 (0.0%) | 17 (17.7%) |
| 4:00 PM to 11:59 PM | 3 (2.9%) | 4 (4.2%) |
| Total | 103 (100.0%) | 96 (100.0%) |
Housing Occupancy in Cleveland
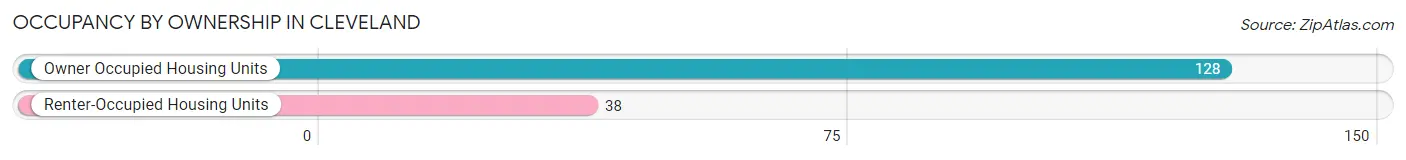
Occupancy by Ownership in Cleveland
Of the total 166 dwellings in Cleveland, owner-occupied units account for 128 (77.1%), while renter-occupied units make up 38 (22.9%).
| Occupancy | # Housing Units | % Housing Units |
| Owner Occupied Housing Units | 128 | 77.1% |
| Renter-Occupied Housing Units | 38 | 22.9% |
| Total Occupied Housing Units | 166 | 100.0% |
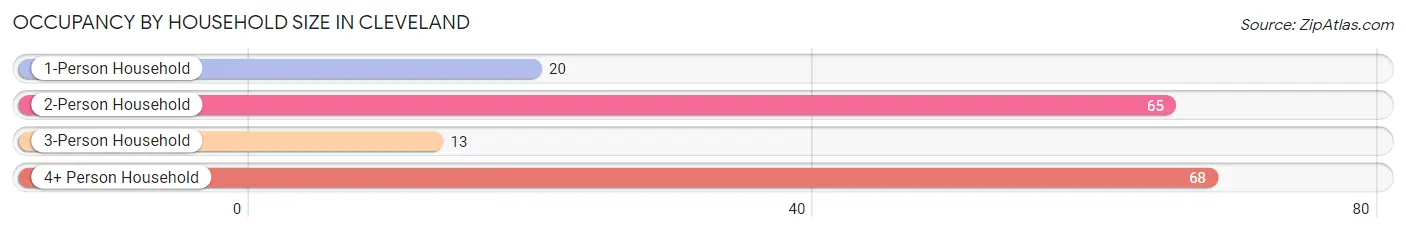
Occupancy by Household Size in Cleveland
| Household Size | # Housing Units | % Housing Units |
| 1-Person Household | 20 | 12.0% |
| 2-Person Household | 65 | 39.2% |
| 3-Person Household | 13 | 7.8% |
| 4+ Person Household | 68 | 41.0% |
| Total Housing Units | 166 | 100.0% |
Occupancy by Ownership by Household Size in Cleveland
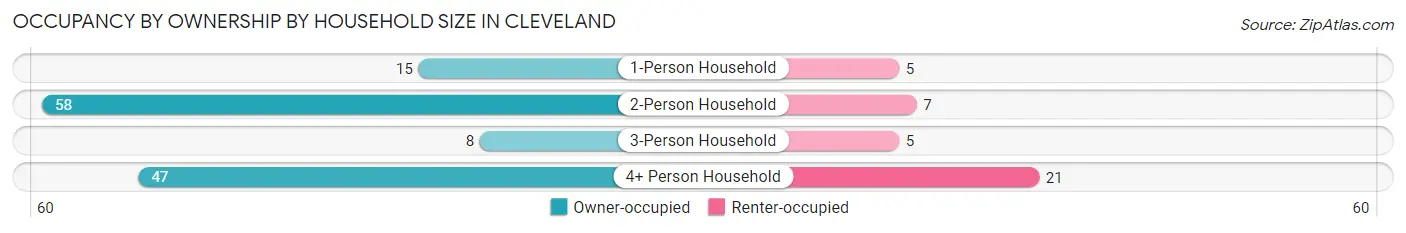
| Household Size | Owner-occupied | Renter-occupied |
| 1-Person Household | 15 (75.0%) | 5 (25.0%) |
| 2-Person Household | 58 (89.2%) | 7 (10.8%) |
| 3-Person Household | 8 (61.5%) | 5 (38.5%) |
| 4+ Person Household | 47 (69.1%) | 21 (30.9%) |
| Total Housing Units | 128 (77.1%) | 38 (22.9%) |
Occupancy by Educational Attainment in Cleveland
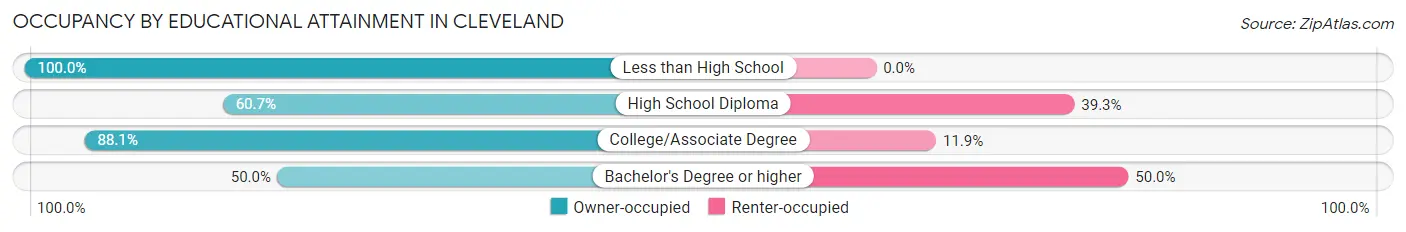
| Household Size | Owner-occupied | Renter-occupied |
| Less than High School | 1 (100.0%) | 0 (0.0%) |
| High School Diploma | 34 (60.7%) | 22 (39.3%) |
| College/Associate Degree | 89 (88.1%) | 12 (11.9%) |
| Bachelor's Degree or higher | 4 (50.0%) | 4 (50.0%) |
Occupancy by Age of Householder in Cleveland
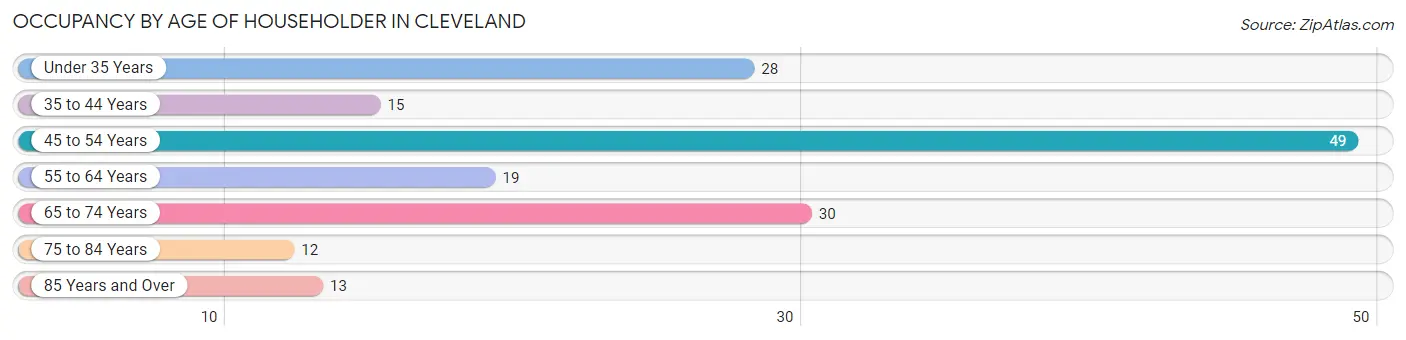
| Age Bracket | # Households | % Households |
| Under 35 Years | 28 | 16.9% |
| 35 to 44 Years | 15 | 9.0% |
| 45 to 54 Years | 49 | 29.5% |
| 55 to 64 Years | 19 | 11.5% |
| 65 to 74 Years | 30 | 18.1% |
| 75 to 84 Years | 12 | 7.2% |
| 85 Years and Over | 13 | 7.8% |
| Total | 166 | 100.0% |
Housing Finances in Cleveland
Median Income by Occupancy in Cleveland
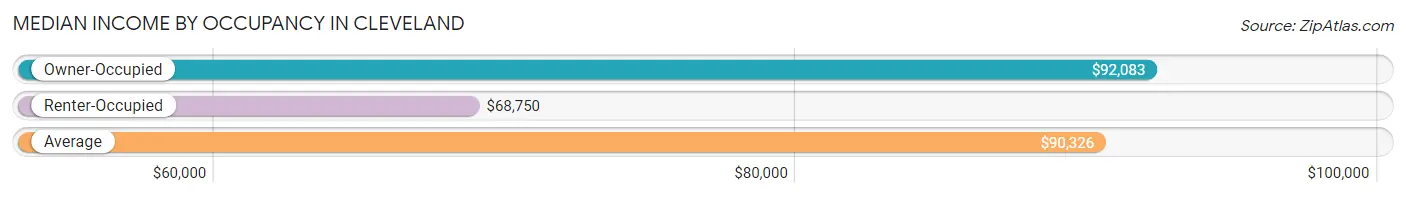
| Occupancy Type | # Households | Median Income |
| Owner-Occupied | 128 (77.1%) | $92,083 |
| Renter-Occupied | 38 (22.9%) | $68,750 |
| Average | 166 (100.0%) | $90,326 |
Occupancy by Householder Income Bracket in Cleveland
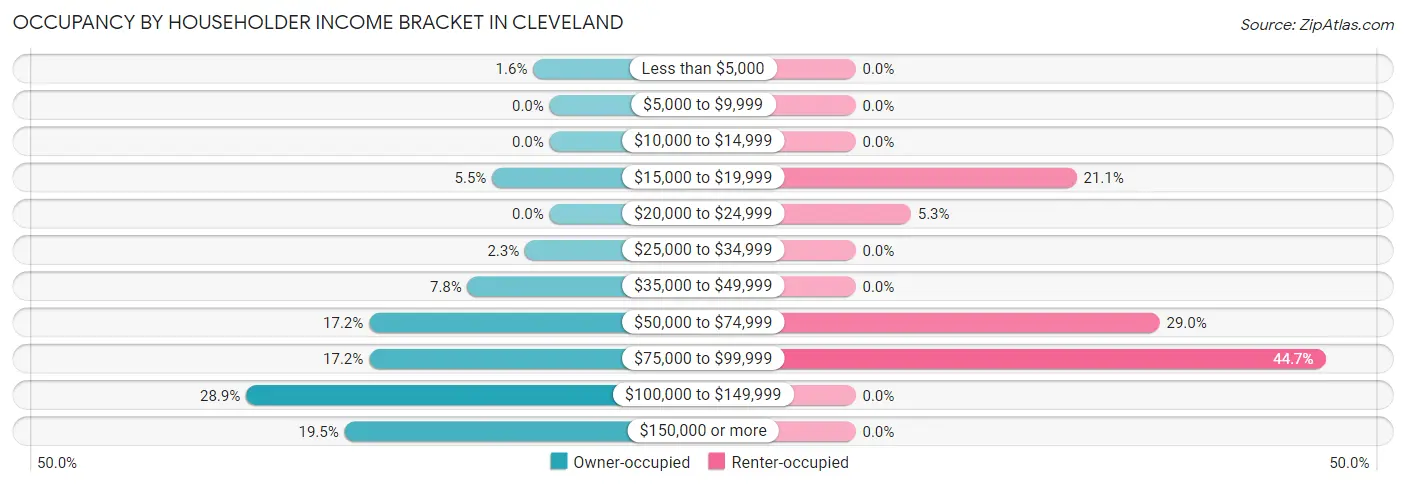
| Income Bracket | Owner-occupied | Renter-occupied |
| Less than $5,000 | 2 (1.6%) | 0 (0.0%) |
| $5,000 to $9,999 | 0 (0.0%) | 0 (0.0%) |
| $10,000 to $14,999 | 0 (0.0%) | 0 (0.0%) |
| $15,000 to $19,999 | 7 (5.5%) | 8 (21.0%) |
| $20,000 to $24,999 | 0 (0.0%) | 2 (5.3%) |
| $25,000 to $34,999 | 3 (2.3%) | 0 (0.0%) |
| $35,000 to $49,999 | 10 (7.8%) | 0 (0.0%) |
| $50,000 to $74,999 | 22 (17.2%) | 11 (28.9%) |
| $75,000 to $99,999 | 22 (17.2%) | 17 (44.7%) |
| $100,000 to $149,999 | 37 (28.9%) | 0 (0.0%) |
| $150,000 or more | 25 (19.5%) | 0 (0.0%) |
| Total | 128 (100.0%) | 38 (100.0%) |
Monthly Housing Cost Tiers in Cleveland
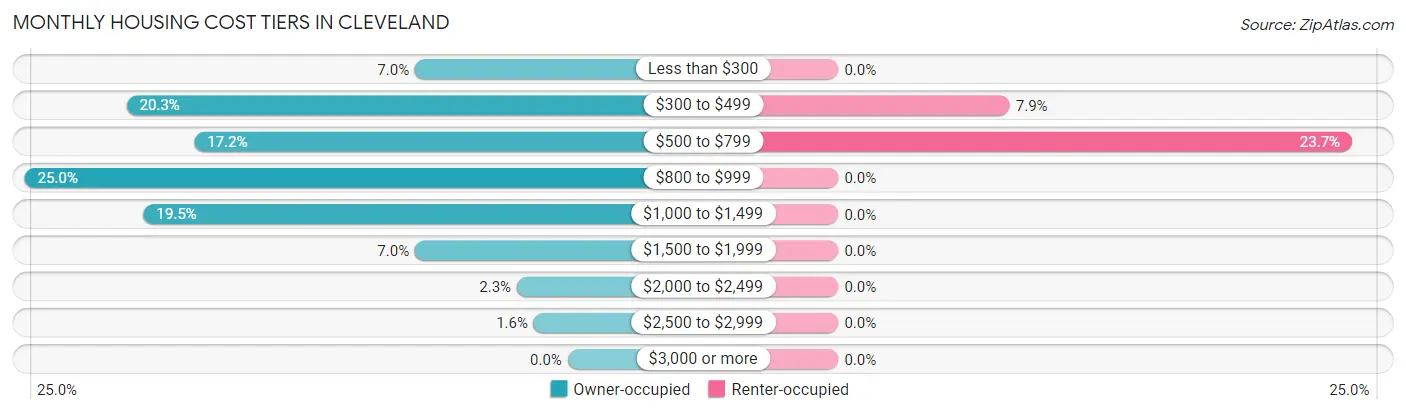
| Monthly Cost | Owner-occupied | Renter-occupied |
| Less than $300 | 9 (7.0%) | 0 (0.0%) |
| $300 to $499 | 26 (20.3%) | 3 (7.9%) |
| $500 to $799 | 22 (17.2%) | 9 (23.7%) |
| $800 to $999 | 32 (25.0%) | 0 (0.0%) |
| $1,000 to $1,499 | 25 (19.5%) | 0 (0.0%) |
| $1,500 to $1,999 | 9 (7.0%) | 0 (0.0%) |
| $2,000 to $2,499 | 3 (2.3%) | 0 (0.0%) |
| $2,500 to $2,999 | 2 (1.6%) | 0 (0.0%) |
| $3,000 or more | 0 (0.0%) | 0 (0.0%) |
| Total | 128 (100.0%) | 38 (100.0%) |
Physical Housing Characteristics in Cleveland
Housing Structures in Cleveland
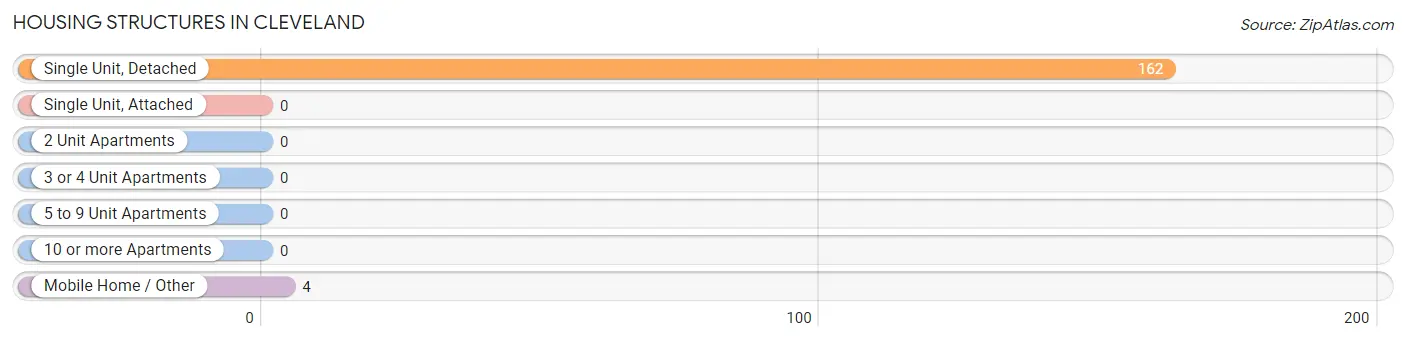
| Structure Type | # Housing Units | % Housing Units |
| Single Unit, Detached | 162 | 97.6% |
| Single Unit, Attached | 0 | 0.0% |
| 2 Unit Apartments | 0 | 0.0% |
| 3 or 4 Unit Apartments | 0 | 0.0% |
| 5 to 9 Unit Apartments | 0 | 0.0% |
| 10 or more Apartments | 0 | 0.0% |
| Mobile Home / Other | 4 | 2.4% |
| Total | 166 | 100.0% |
Housing Structures by Occupancy in Cleveland
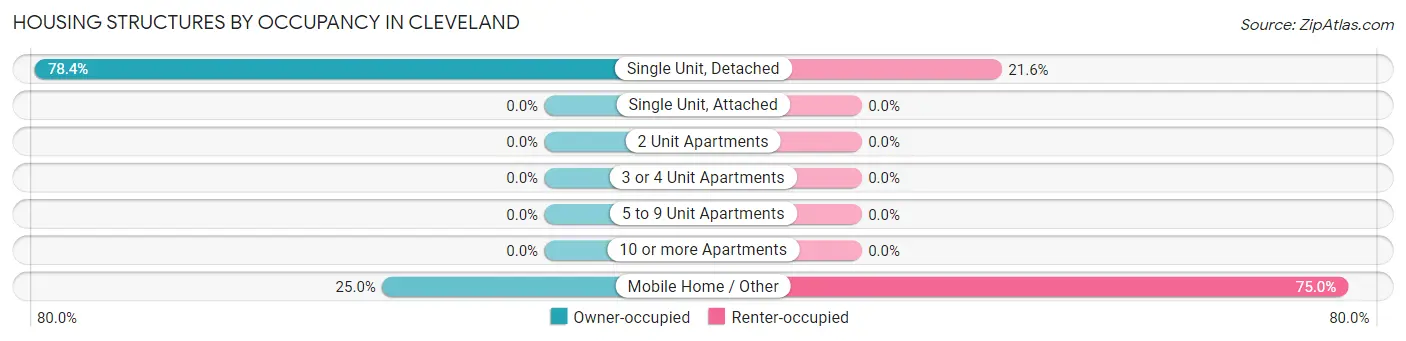
| Structure Type | Owner-occupied | Renter-occupied |
| Single Unit, Detached | 127 (78.4%) | 35 (21.6%) |
| Single Unit, Attached | 0 (0.0%) | 0 (0.0%) |
| 2 Unit Apartments | 0 (0.0%) | 0 (0.0%) |
| 3 or 4 Unit Apartments | 0 (0.0%) | 0 (0.0%) |
| 5 to 9 Unit Apartments | 0 (0.0%) | 0 (0.0%) |
| 10 or more Apartments | 0 (0.0%) | 0 (0.0%) |
| Mobile Home / Other | 1 (25.0%) | 3 (75.0%) |
| Total | 128 (77.1%) | 38 (22.9%) |
Housing Structures by Number of Rooms in Cleveland
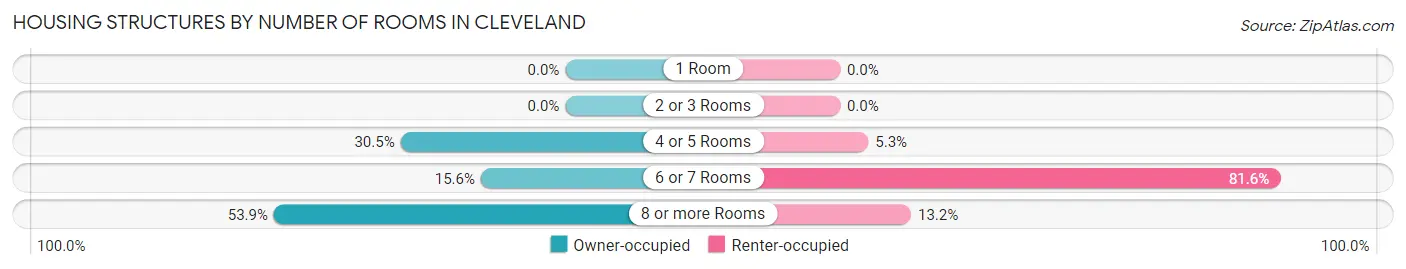
| Number of Rooms | Owner-occupied | Renter-occupied |
| 1 Room | 0 (0.0%) | 0 (0.0%) |
| 2 or 3 Rooms | 0 (0.0%) | 0 (0.0%) |
| 4 or 5 Rooms | 39 (30.5%) | 2 (5.3%) |
| 6 or 7 Rooms | 20 (15.6%) | 31 (81.6%) |
| 8 or more Rooms | 69 (53.9%) | 5 (13.2%) |
| Total | 128 (100.0%) | 38 (100.0%) |
Housing Structure by Heating Type in Cleveland
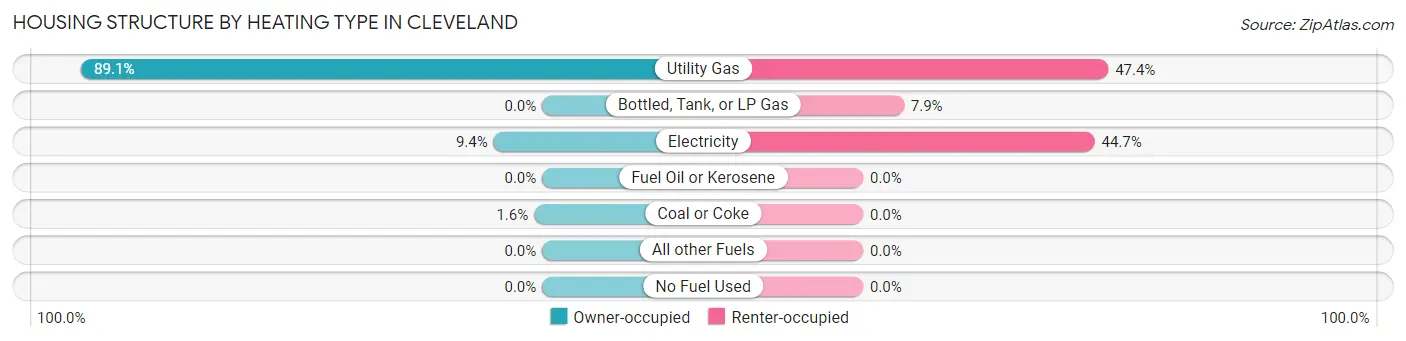
| Heating Type | Owner-occupied | Renter-occupied |
| Utility Gas | 114 (89.1%) | 18 (47.4%) |
| Bottled, Tank, or LP Gas | 0 (0.0%) | 3 (7.9%) |
| Electricity | 12 (9.4%) | 17 (44.7%) |
| Fuel Oil or Kerosene | 0 (0.0%) | 0 (0.0%) |
| Coal or Coke | 2 (1.6%) | 0 (0.0%) |
| All other Fuels | 0 (0.0%) | 0 (0.0%) |
| No Fuel Used | 0 (0.0%) | 0 (0.0%) |
| Total | 128 (100.0%) | 38 (100.0%) |
Household Vehicle Usage in Cleveland
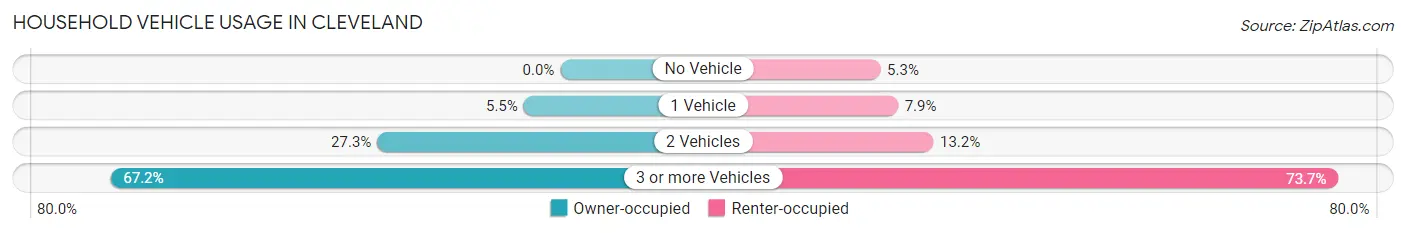
| Vehicles per Household | Owner-occupied | Renter-occupied |
| No Vehicle | 0 (0.0%) | 2 (5.3%) |
| 1 Vehicle | 7 (5.5%) | 3 (7.9%) |
| 2 Vehicles | 35 (27.3%) | 5 (13.2%) |
| 3 or more Vehicles | 86 (67.2%) | 28 (73.7%) |
| Total | 128 (100.0%) | 38 (100.0%) |
Real Estate & Mortgages in Cleveland
Real Estate and Mortgage Overview in Cleveland
| Characteristic | Without Mortgage | With Mortgage |
| Housing Units | 47 | 81 |
| Median Property Value | $179,200 | $158,900 |
| Median Household Income | $90,313 | $17 |
| Monthly Housing Costs | $388 | $0 |
| Real Estate Taxes | $950 | $0 |
Property Value by Mortgage Status in Cleveland
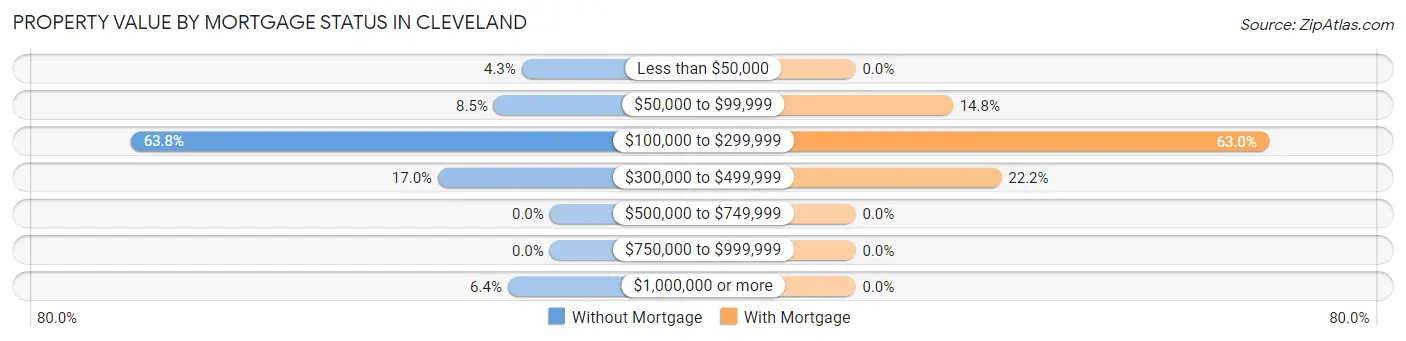
| Property Value | Without Mortgage | With Mortgage |
| Less than $50,000 | 2 (4.3%) | 0 (0.0%) |
| $50,000 to $99,999 | 4 (8.5%) | 12 (14.8%) |
| $100,000 to $299,999 | 30 (63.8%) | 51 (63.0%) |
| $300,000 to $499,999 | 8 (17.0%) | 18 (22.2%) |
| $500,000 to $749,999 | 0 (0.0%) | 0 (0.0%) |
| $750,000 to $999,999 | 0 (0.0%) | 0 (0.0%) |
| $1,000,000 or more | 3 (6.4%) | 0 (0.0%) |
| Total | 47 (100.0%) | 81 (100.0%) |
Household Income by Mortgage Status in Cleveland
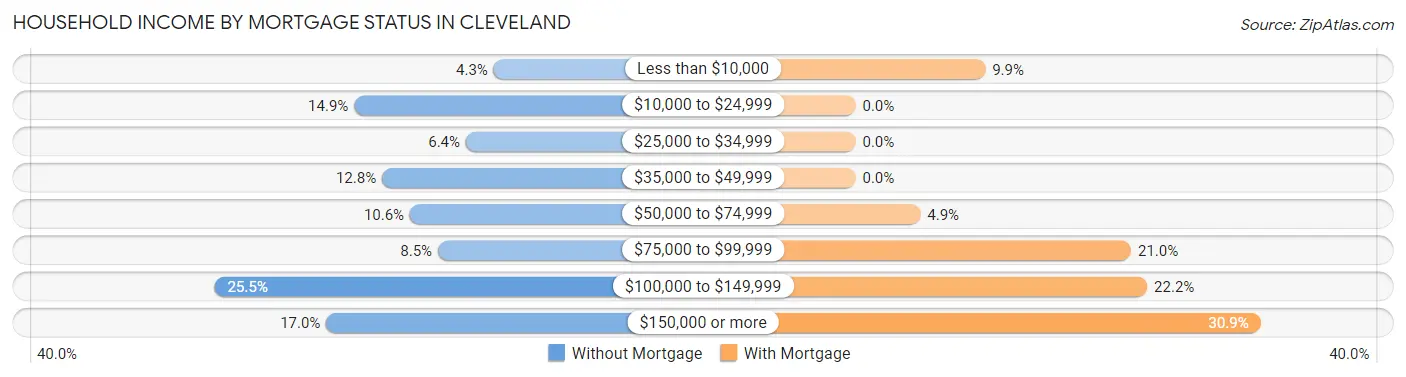
| Household Income | Without Mortgage | With Mortgage |
| Less than $10,000 | 2 (4.3%) | 8 (9.9%) |
| $10,000 to $24,999 | 7 (14.9%) | 0 (0.0%) |
| $25,000 to $34,999 | 3 (6.4%) | 0 (0.0%) |
| $35,000 to $49,999 | 6 (12.8%) | 0 (0.0%) |
| $50,000 to $74,999 | 5 (10.6%) | 4 (4.9%) |
| $75,000 to $99,999 | 4 (8.5%) | 17 (21.0%) |
| $100,000 to $149,999 | 12 (25.5%) | 18 (22.2%) |
| $150,000 or more | 8 (17.0%) | 25 (30.9%) |
| Total | 47 (100.0%) | 81 (100.0%) |
Property Value to Household Income Ratio in Cleveland
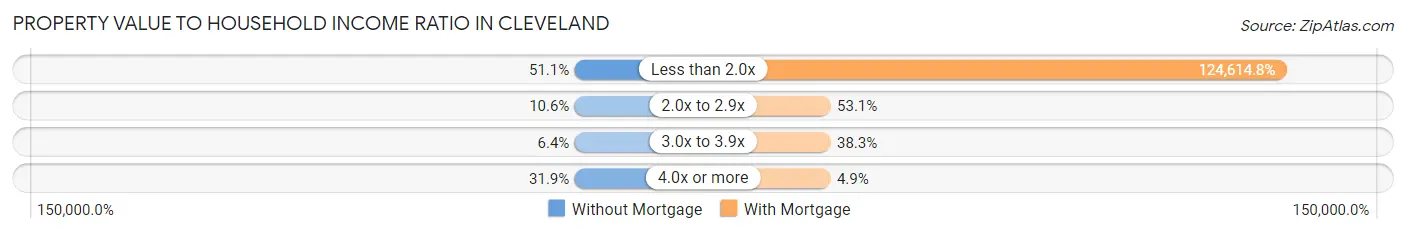
| Value-to-Income Ratio | Without Mortgage | With Mortgage |
| Less than 2.0x | 24 (51.1%) | 100,938 (124,614.8%) |
| 2.0x to 2.9x | 5 (10.6%) | 43 (53.1%) |
| 3.0x to 3.9x | 3 (6.4%) | 31 (38.3%) |
| 4.0x or more | 15 (31.9%) | 4 (4.9%) |
| Total | 47 (100.0%) | 81 (100.0%) |
Real Estate Taxes by Mortgage Status in Cleveland
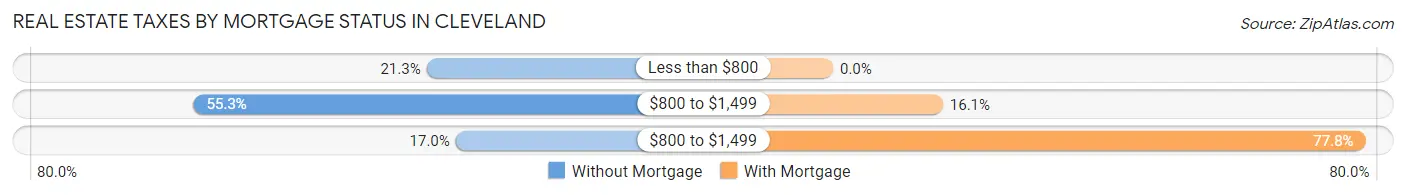
| Property Taxes | Without Mortgage | With Mortgage |
| Less than $800 | 10 (21.3%) | 0 (0.0%) |
| $800 to $1,499 | 26 (55.3%) | 13 (16.1%) |
| $800 to $1,499 | 8 (17.0%) | 63 (77.8%) |
| Total | 47 (100.0%) | 81 (100.0%) |
Health & Disability in Cleveland
Health Insurance Coverage by Age in Cleveland
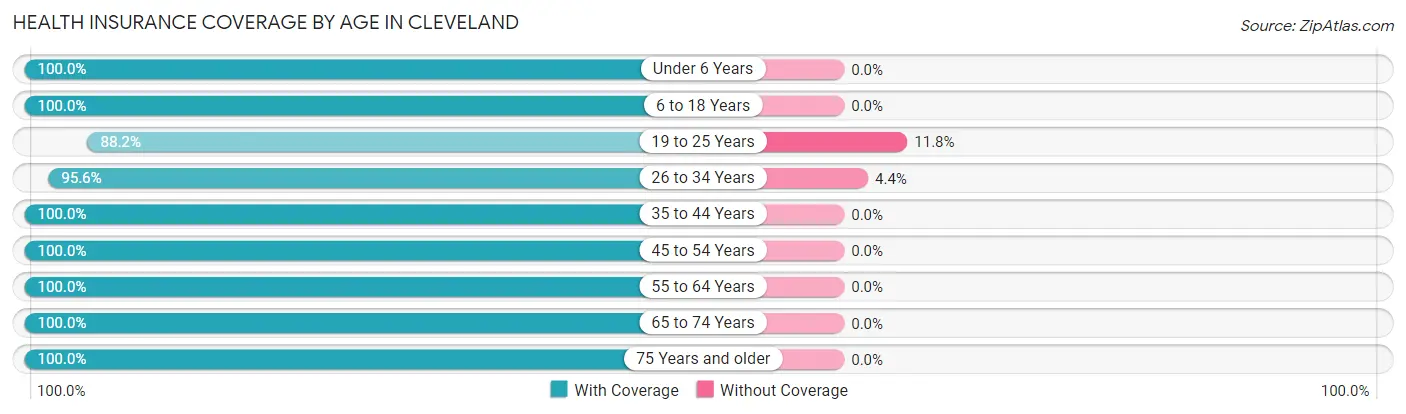
| Age Bracket | With Coverage | Without Coverage |
| Under 6 Years | 27 (100.0%) | 0 (0.0%) |
| 6 to 18 Years | 134 (100.0%) | 0 (0.0%) |
| 19 to 25 Years | 30 (88.2%) | 4 (11.8%) |
| 26 to 34 Years | 43 (95.6%) | 2 (4.4%) |
| 35 to 44 Years | 51 (100.0%) | 0 (0.0%) |
| 45 to 54 Years | 81 (100.0%) | 0 (0.0%) |
| 55 to 64 Years | 49 (100.0%) | 0 (0.0%) |
| 65 to 74 Years | 43 (100.0%) | 0 (0.0%) |
| 75 Years and older | 37 (100.0%) | 0 (0.0%) |
| Total | 495 (98.8%) | 6 (1.2%) |
Health Insurance Coverage by Citizenship Status in Cleveland
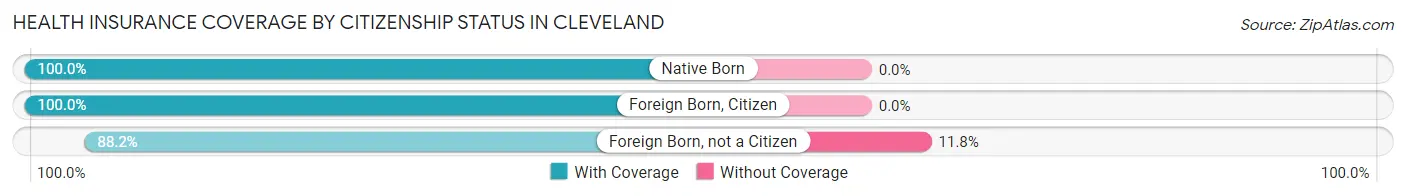
| Citizenship Status | With Coverage | Without Coverage |
| Native Born | 27 (100.0%) | 0 (0.0%) |
| Foreign Born, Citizen | 134 (100.0%) | 0 (0.0%) |
| Foreign Born, not a Citizen | 30 (88.2%) | 4 (11.8%) |
Health Insurance Coverage by Household Income in Cleveland
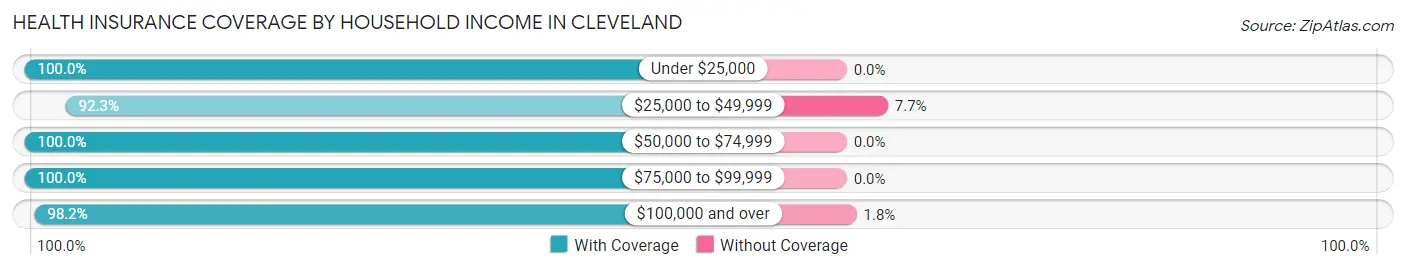
| Household Income | With Coverage | Without Coverage |
| Under $25,000 | 25 (100.0%) | 0 (0.0%) |
| $25,000 to $49,999 | 24 (92.3%) | 2 (7.7%) |
| $50,000 to $74,999 | 114 (100.0%) | 0 (0.0%) |
| $75,000 to $99,999 | 119 (100.0%) | 0 (0.0%) |
| $100,000 and over | 213 (98.2%) | 4 (1.8%) |
Public vs Private Health Insurance Coverage by Age in Cleveland
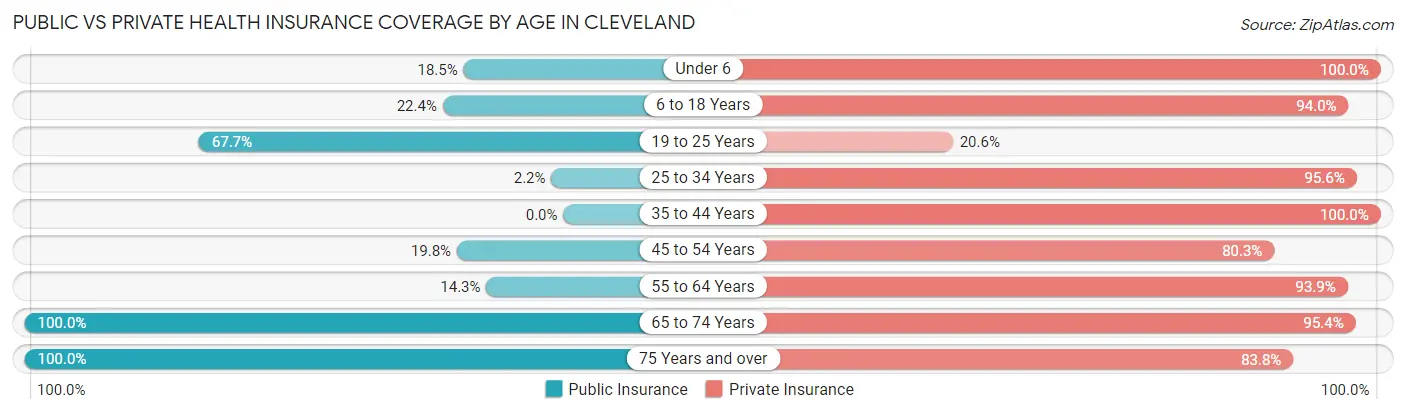
| Age Bracket | Public Insurance | Private Insurance |
| Under 6 | 5 (18.5%) | 27 (100.0%) |
| 6 to 18 Years | 30 (22.4%) | 126 (94.0%) |
| 19 to 25 Years | 23 (67.6%) | 7 (20.6%) |
| 25 to 34 Years | 1 (2.2%) | 43 (95.6%) |
| 35 to 44 Years | 0 (0.0%) | 51 (100.0%) |
| 45 to 54 Years | 16 (19.8%) | 65 (80.2%) |
| 55 to 64 Years | 7 (14.3%) | 46 (93.9%) |
| 65 to 74 Years | 43 (100.0%) | 41 (95.4%) |
| 75 Years and over | 37 (100.0%) | 31 (83.8%) |
| Total | 162 (32.3%) | 437 (87.2%) |
Disability Status by Sex by Age in Cleveland
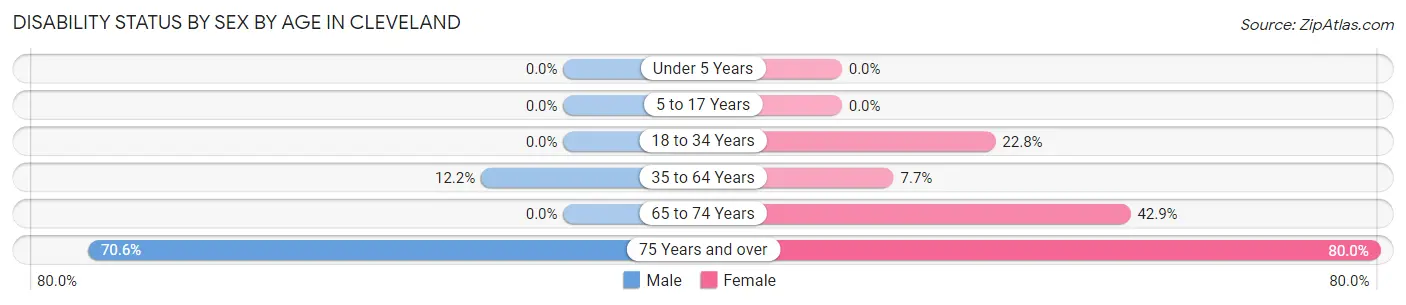
| Age Bracket | Male | Female |
| Under 5 Years | 0 (0.0%) | 0 (0.0%) |
| 5 to 17 Years | 0 (0.0%) | 0 (0.0%) |
| 18 to 34 Years | 0 (0.0%) | 13 (22.8%) |
| 35 to 64 Years | 11 (12.2%) | 7 (7.7%) |
| 65 to 74 Years | 0 (0.0%) | 9 (42.9%) |
| 75 Years and over | 12 (70.6%) | 16 (80.0%) |
Disability Class by Sex by Age in Cleveland
Disability Class: Hearing Difficulty
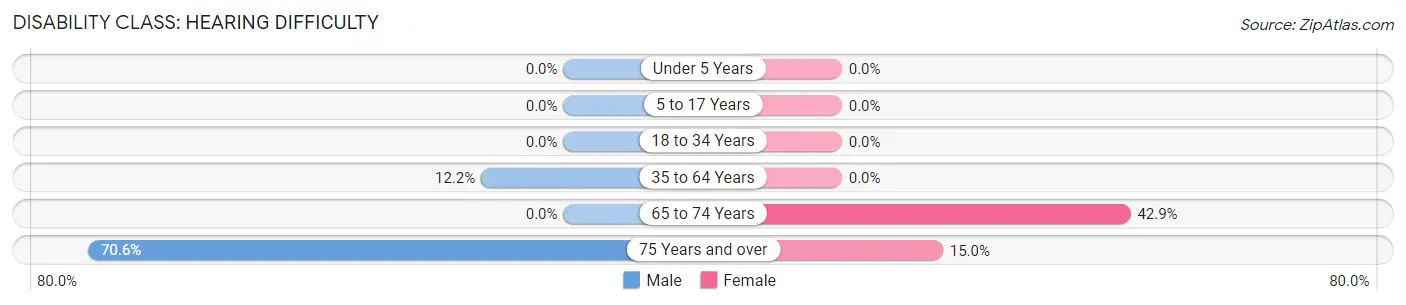
| Age Bracket | Male | Female |
| Under 5 Years | 0 (0.0%) | 0 (0.0%) |
| 5 to 17 Years | 0 (0.0%) | 0 (0.0%) |
| 18 to 34 Years | 0 (0.0%) | 0 (0.0%) |
| 35 to 64 Years | 11 (12.2%) | 0 (0.0%) |
| 65 to 74 Years | 0 (0.0%) | 9 (42.9%) |
| 75 Years and over | 12 (70.6%) | 3 (15.0%) |
Disability Class: Vision Difficulty
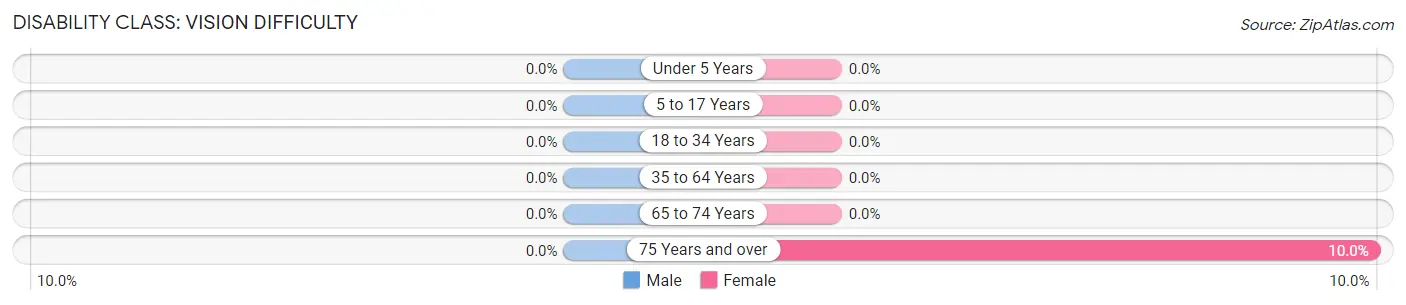
| Age Bracket | Male | Female |
| Under 5 Years | 0 (0.0%) | 0 (0.0%) |
| 5 to 17 Years | 0 (0.0%) | 0 (0.0%) |
| 18 to 34 Years | 0 (0.0%) | 0 (0.0%) |
| 35 to 64 Years | 0 (0.0%) | 0 (0.0%) |
| 65 to 74 Years | 0 (0.0%) | 0 (0.0%) |
| 75 Years and over | 0 (0.0%) | 2 (10.0%) |
Disability Class: Cognitive Difficulty
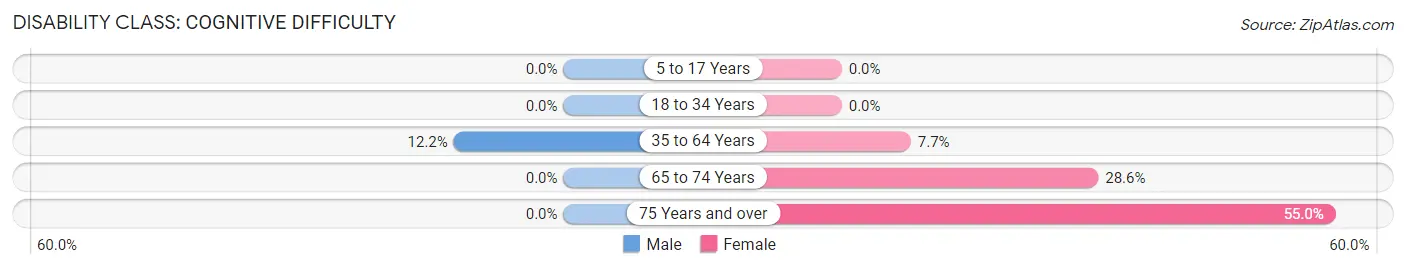
| Age Bracket | Male | Female |
| 5 to 17 Years | 0 (0.0%) | 0 (0.0%) |
| 18 to 34 Years | 0 (0.0%) | 0 (0.0%) |
| 35 to 64 Years | 11 (12.2%) | 7 (7.7%) |
| 65 to 74 Years | 0 (0.0%) | 6 (28.6%) |
| 75 Years and over | 0 (0.0%) | 11 (55.0%) |
Disability Class: Ambulatory Difficulty
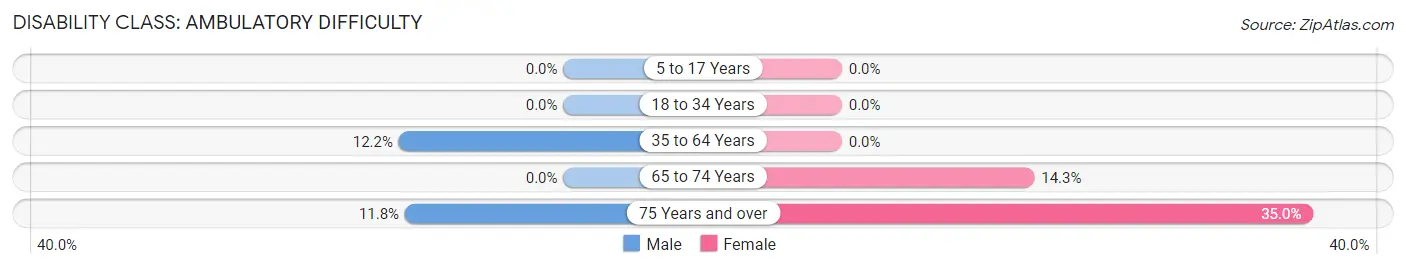
| Age Bracket | Male | Female |
| 5 to 17 Years | 0 (0.0%) | 0 (0.0%) |
| 18 to 34 Years | 0 (0.0%) | 0 (0.0%) |
| 35 to 64 Years | 11 (12.2%) | 0 (0.0%) |
| 65 to 74 Years | 0 (0.0%) | 3 (14.3%) |
| 75 Years and over | 2 (11.8%) | 7 (35.0%) |
Disability Class: Self-Care Difficulty
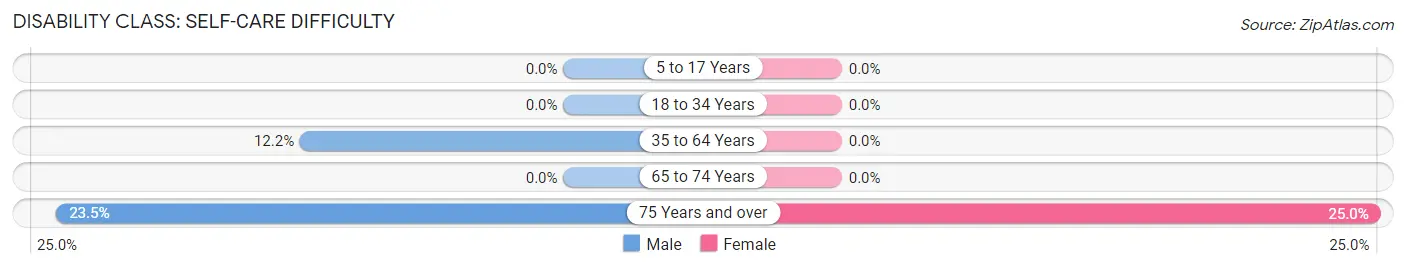
| Age Bracket | Male | Female |
| 5 to 17 Years | 0 (0.0%) | 0 (0.0%) |
| 18 to 34 Years | 0 (0.0%) | 0 (0.0%) |
| 35 to 64 Years | 11 (12.2%) | 0 (0.0%) |
| 65 to 74 Years | 0 (0.0%) | 0 (0.0%) |
| 75 Years and over | 4 (23.5%) | 5 (25.0%) |
Technology Access in Cleveland
Computing Device Access in Cleveland
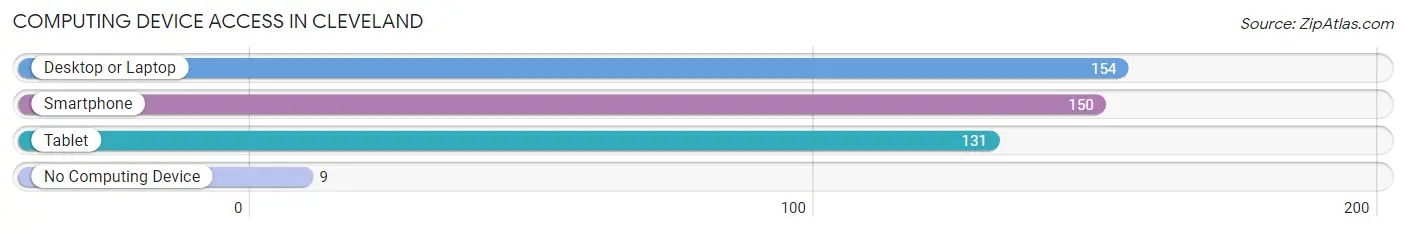
| Device Type | # Households | % Households |
| Desktop or Laptop | 154 | 92.8% |
| Smartphone | 150 | 90.4% |
| Tablet | 131 | 78.9% |
| No Computing Device | 9 | 5.4% |
| Total | 166 | 100.0% |
Internet Access in Cleveland
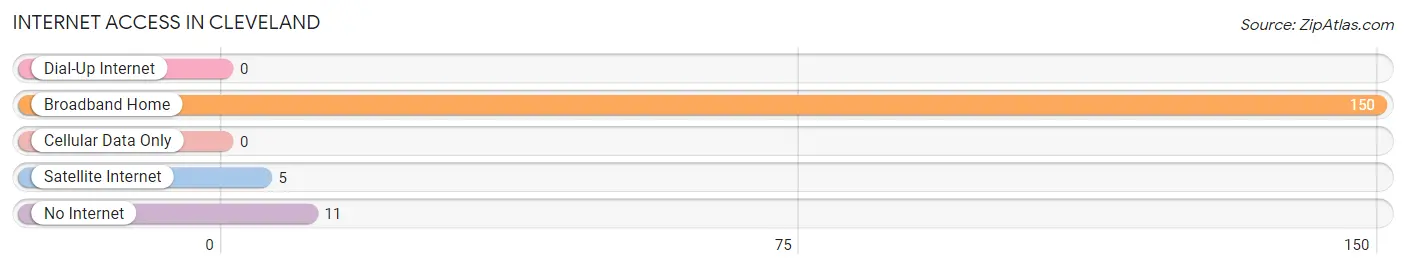
| Internet Type | # Households | % Households |
| Dial-Up Internet | 0 | 0.0% |
| Broadband Home | 150 | 90.4% |
| Cellular Data Only | 0 | 0.0% |
| Satellite Internet | 5 | 3.0% |
| No Internet | 11 | 6.6% |
| Total | 166 | 100.0% |
Cleveland Summary
Cleveland is a small city located in the state of Utah in the United States. It is situated in the southwestern part of the state, in the county of San Juan. The city is located at the junction of the San Juan River and the Colorado River, and is surrounded by the Navajo Nation. The city has a population of approximately 1,000 people, and is the county seat of San Juan County.
History
The area that is now Cleveland was first settled by the Navajo people in the late 1800s. The first non-Native American settlers arrived in the area in the early 1900s, and the town was officially founded in 1912. The town was named after President Grover Cleveland, who was in office at the time.
In the early 1900s, the town was a hub for the mining industry, with several mines in the area. The town also served as a trading post for the Navajo people, who would come to the town to trade goods.
In the 1950s, the town began to experience a decline in population as the mining industry declined. However, in the late 1970s, the town began to experience a resurgence in population as people began to move to the area for its scenic beauty and outdoor recreation opportunities.
Geography
Cleveland is located in the southwestern part of Utah, in the county of San Juan. The city is situated at the junction of the San Juan River and the Colorado River, and is surrounded by the Navajo Nation. The city has an elevation of 4,890 feet above sea level.
The climate in Cleveland is semi-arid, with hot summers and cold winters. The average annual temperature is around 50 degrees Fahrenheit, with temperatures ranging from the low 30s in the winter to the high 90s in the summer.
Economy
The economy of Cleveland is largely based on tourism and outdoor recreation. The city is home to several national parks and monuments, including Monument Valley, Natural Bridges National Monument, and Rainbow Bridge National Monument. These parks attract visitors from all over the world, and provide a significant boost to the local economy.
The city is also home to several businesses, including restaurants, hotels, and retail stores. The city is also home to several manufacturing companies, including a furniture factory and a food processing plant.
Demographics
As of the 2010 census, the population of Cleveland was 1,000 people. The racial makeup of the city was 94.2% White, 0.7% African American, 0.7% Native American, 0.3% Asian, 0.1% Pacific Islander, and 3.1% from other races. The median household income in the city was $30,000, and the median family income was $35,000. The per capita income in the city was $14,000.
Common Questions
What is Per Capita Income in Cleveland?
Per Capita income in Cleveland is $31,350.
What is the Median Family Income in Cleveland?
Median Family Income in Cleveland is $91,413.
What is the Median Household income in Cleveland?
Median Household Income in Cleveland is $90,326.
What is Income or Wage Gap in Cleveland?
Income or Wage Gap in Cleveland is 81.2%.
Women in Cleveland earn 18.8 cents for every dollar earned by a man.
What is Inequality or Gini Index in Cleveland?
Inequality or Gini Index in Cleveland is 0.32.
What is the Total Population of Cleveland?
Total Population of Cleveland is 501.
What is the Total Male Population of Cleveland?
Total Male Population of Cleveland is 244.
What is the Total Female Population of Cleveland?
Total Female Population of Cleveland is 257.
What is the Ratio of Males per 100 Females in Cleveland?
There are 94.94 Males per 100 Females in Cleveland.
What is the Ratio of Females per 100 Males in Cleveland?
There are 105.33 Females per 100 Males in Cleveland.
What is the Median Population Age in Cleveland?
Median Population Age in Cleveland is 36.4 Years.
What is the Average Family Size in Cleveland
Average Family Size in Cleveland is 3.2 People.
What is the Average Household Size in Cleveland
Average Household Size in Cleveland is 3.0 People.
How Large is the Labor Force in Cleveland?
There are 221 People in the Labor Forcein in Cleveland.
What is the Percentage of People in the Labor Force in Cleveland?
60.5% of People are in the Labor Force in Cleveland.
What is the Unemployment Rate in Cleveland?
Unemployment Rate in Cleveland is 0.9%.