Clawson, UT Map & Demographics
Clawson Map
Clawson Overview
$27,716
PER CAPITA INCOME
$60,938
AVG FAMILY INCOME
$43,750
AVG HOUSEHOLD INCOME
0.31
INEQUALITY / GINI INDEX
61
TOTAL POPULATION
31
MALE POPULATION
30
FEMALE POPULATION
103.33
MALES / 100 FEMALES
96.77
FEMALES / 100 MALES
67.9
MEDIAN AGE
2.2
AVG FAMILY SIZE
1.7
AVG HOUSEHOLD SIZE
13
LABOR FORCE [ PEOPLE ]
21.3%
PERCENT IN LABOR FORCE
Clawson Zip Codes
Clawson Area Codes
Income in Clawson
Income Overview in Clawson
Per Capita Income in Clawson is $27,716, while median incomes of families and households are $60,938 and $43,750 respectively.
| Characteristic | Number | Measure |
| Per Capita Income | 61 | $27,716 |
| Median Family Income | 21 | $60,938 |
| Mean Family Income | 21 | $64,490 |
| Median Household Income | 36 | $43,750 |
| Mean Household Income | 36 | $47,592 |
| Income Deficit | 21 | $0 |
| Wage / Income Gap (%) | 61 | 0.00% |
| Wage / Income Gap ($) | 61 | 100.00¢ per $1 |
| Gini / Inequality Index | 61 | 0.31 |
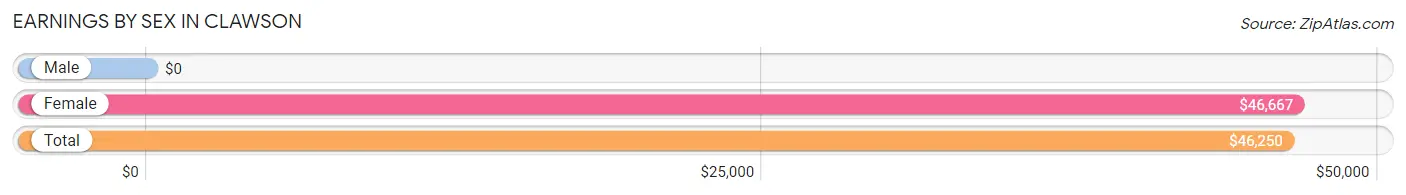
Earnings by Sex in Clawson
| Sex | Number | Average Earnings |
| Male | 7 (53.8%) | $0 |
| Female | 6 (46.2%) | $46,667 |
| Total | 13 (100.0%) | $46,250 |
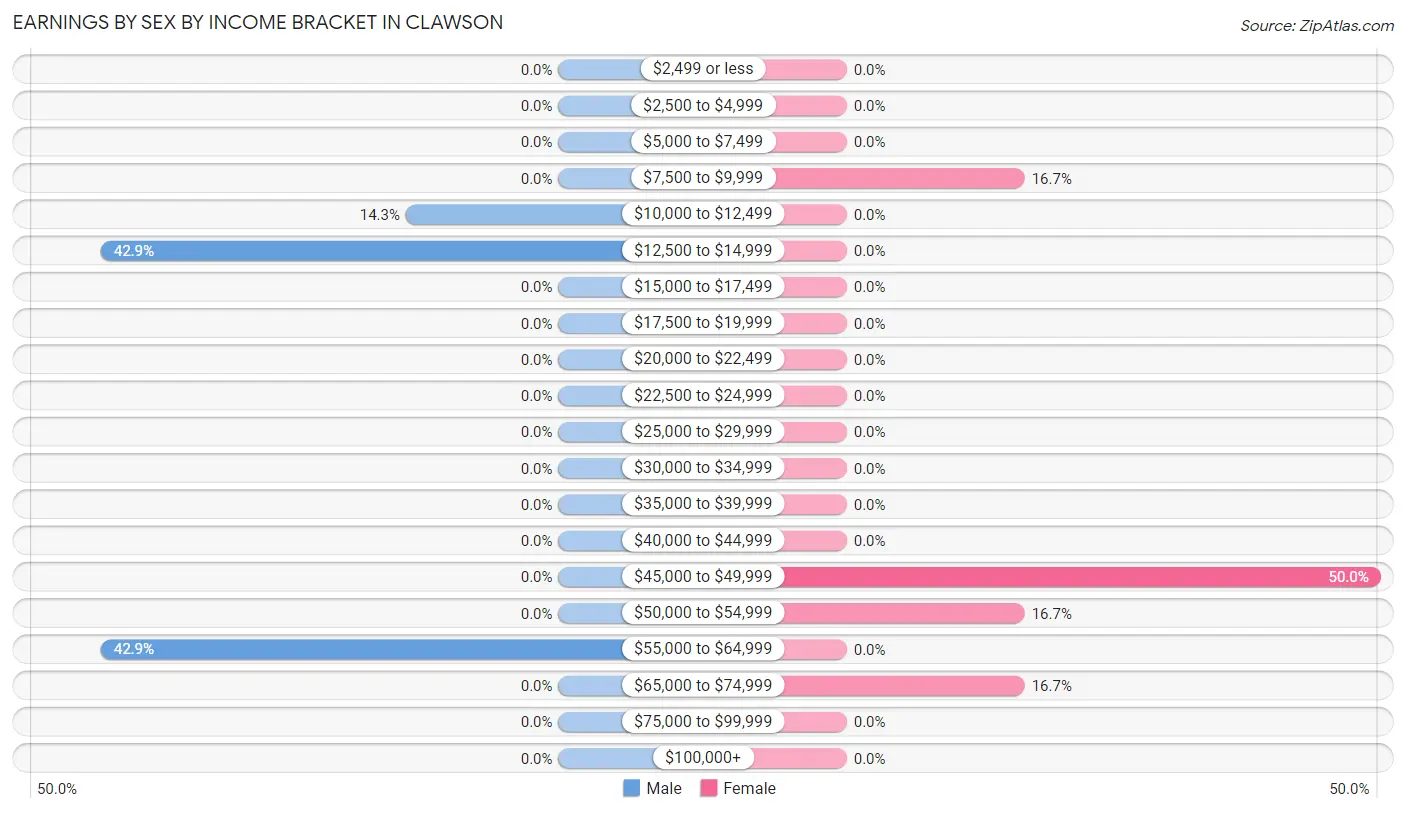
Earnings by Sex by Income Bracket in Clawson
The most common earnings brackets in Clawson are $12,500 to $14,999 for men (3 | 42.9%) and $45,000 to $49,999 for women (3 | 50.0%).
| Income | Male | Female |
| $2,499 or less | 0 (0.0%) | 0 (0.0%) |
| $2,500 to $4,999 | 0 (0.0%) | 0 (0.0%) |
| $5,000 to $7,499 | 0 (0.0%) | 0 (0.0%) |
| $7,500 to $9,999 | 0 (0.0%) | 1 (16.7%) |
| $10,000 to $12,499 | 1 (14.3%) | 0 (0.0%) |
| $12,500 to $14,999 | 3 (42.9%) | 0 (0.0%) |
| $15,000 to $17,499 | 0 (0.0%) | 0 (0.0%) |
| $17,500 to $19,999 | 0 (0.0%) | 0 (0.0%) |
| $20,000 to $22,499 | 0 (0.0%) | 0 (0.0%) |
| $22,500 to $24,999 | 0 (0.0%) | 0 (0.0%) |
| $25,000 to $29,999 | 0 (0.0%) | 0 (0.0%) |
| $30,000 to $34,999 | 0 (0.0%) | 0 (0.0%) |
| $35,000 to $39,999 | 0 (0.0%) | 0 (0.0%) |
| $40,000 to $44,999 | 0 (0.0%) | 0 (0.0%) |
| $45,000 to $49,999 | 0 (0.0%) | 3 (50.0%) |
| $50,000 to $54,999 | 0 (0.0%) | 1 (16.7%) |
| $55,000 to $64,999 | 3 (42.9%) | 0 (0.0%) |
| $65,000 to $74,999 | 0 (0.0%) | 1 (16.7%) |
| $75,000 to $99,999 | 0 (0.0%) | 0 (0.0%) |
| $100,000+ | 0 (0.0%) | 0 (0.0%) |
| Total | 7 (100.0%) | 6 (100.0%) |
Earnings by Sex by Educational Attainment in Clawson
| Educational Attainment | Male Income | Female Income |
| Less than High School | - | - |
| High School Diploma | - | - |
| College or Associate's Degree | - | - |
| Bachelor's Degree | - | - |
| Graduate Degree | - | - |
| Total | - | - |
Family Income in Clawson
Family Income Brackets in Clawson
According to the Clawson family income data, there are 12 families falling into the $50,000 to $74,999 income range, which is the most common income bracket and makes up 57.1% of all families.
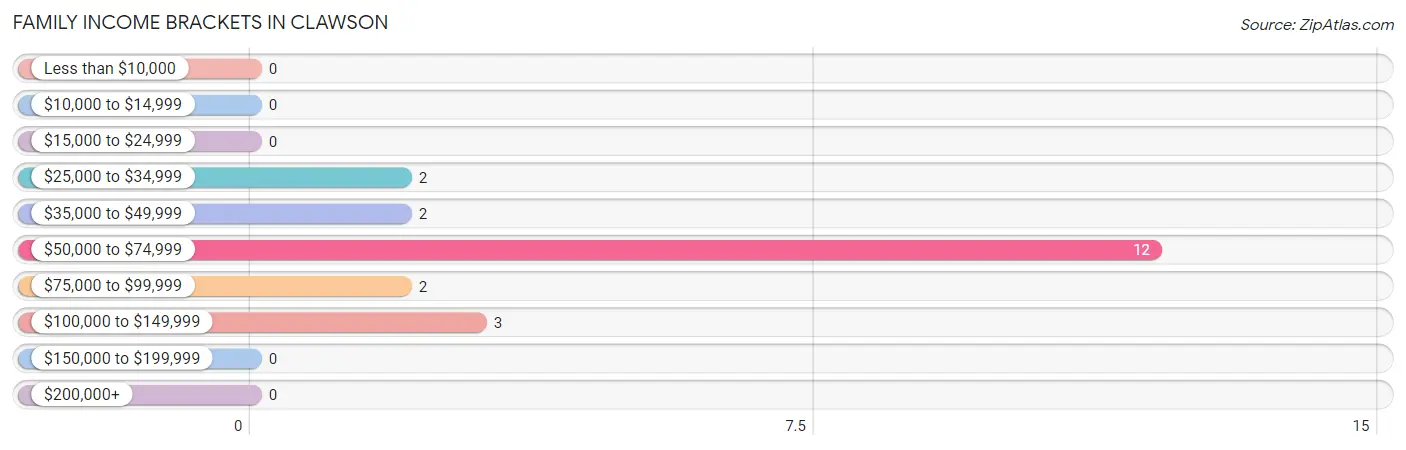
| Income Bracket | # Families | % Families |
| Less than $10,000 | 0 | 0.0% |
| $10,000 to $14,999 | 0 | 0.0% |
| $15,000 to $24,999 | 0 | 0.0% |
| $25,000 to $34,999 | 2 | 9.5% |
| $35,000 to $49,999 | 2 | 9.5% |
| $50,000 to $74,999 | 12 | 57.1% |
| $75,000 to $99,999 | 2 | 9.5% |
| $100,000 to $149,999 | 3 | 14.3% |
| $150,000 to $199,999 | 0 | 0.0% |
| $200,000+ | 0 | 0.0% |
Family Income by Famaliy Size in Clawson
2-person families (18 | 85.7%) account for the highest median family income in Clawson with $60,000 per family, while 2-person families (18 | 85.7%) have the highest median income of $30,000 per family member.
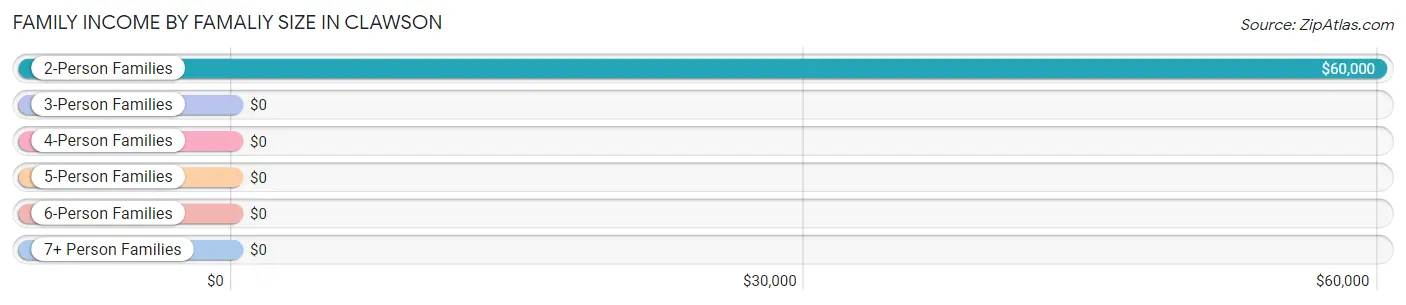
| Income Bracket | # Families | Median Income |
| 2-Person Families | 18 (85.7%) | $60,000 |
| 3-Person Families | 3 (14.3%) | $0 |
| 4-Person Families | 0 (0.0%) | $0 |
| 5-Person Families | 0 (0.0%) | $0 |
| 6-Person Families | 0 (0.0%) | $0 |
| 7+ Person Families | 0 (0.0%) | $0 |
| Total | 21 (100.0%) | $60,938 |
Family Income by Number of Earners in Clawson
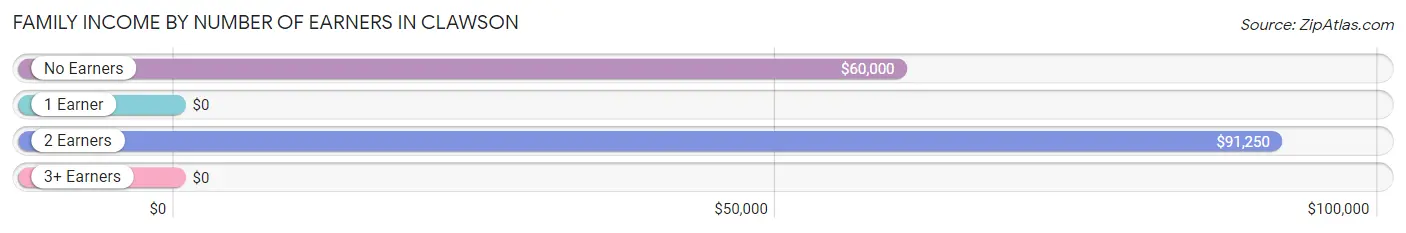
| Number of Earners | # Families | Median Income |
| No Earners | 14 (66.7%) | $60,000 |
| 1 Earner | 0 (0.0%) | $0 |
| 2 Earners | 7 (33.3%) | $91,250 |
| 3+ Earners | 0 (0.0%) | $0 |
| Total | 21 (100.0%) | $60,938 |
Household Income in Clawson
Household Income Brackets in Clawson
With 12 households falling in the category, the $50,000 to $74,999 income range is the most frequent in Clawson, accounting for 33.3% of all households.
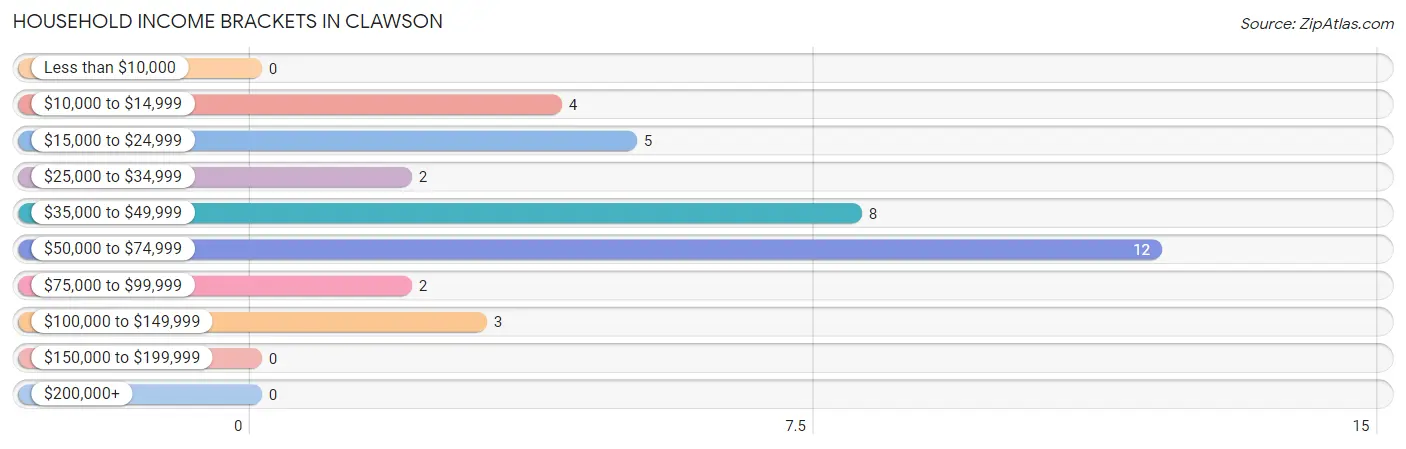
| Income Bracket | # Households | % Households |
| Less than $10,000 | 0 | 0.0% |
| $10,000 to $14,999 | 4 | 11.1% |
| $15,000 to $24,999 | 5 | 13.9% |
| $25,000 to $34,999 | 2 | 5.6% |
| $35,000 to $49,999 | 8 | 22.2% |
| $50,000 to $74,999 | 12 | 33.3% |
| $75,000 to $99,999 | 2 | 5.6% |
| $100,000 to $149,999 | 3 | 8.3% |
| $150,000 to $199,999 | 0 | 0.0% |
| $200,000+ | 0 | 0.0% |
Household Income by Householder Age in Clawson
The median household income in Clawson is $43,750, with the highest median household income of $105,417 found in the 45 to 64 years age bracket for the primary householder. A total of 5 households (13.9%) fall into this category.
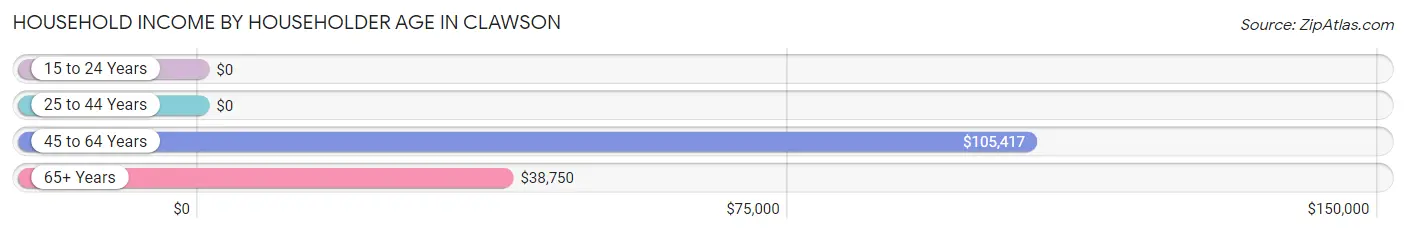
| Income Bracket | # Households | Median Income |
| 15 to 24 Years | 0 (0.0%) | $0 |
| 25 to 44 Years | 0 (0.0%) | $0 |
| 45 to 64 Years | 5 (13.9%) | $105,417 |
| 65+ Years | 31 (86.1%) | $38,750 |
| Total | 36 (100.0%) | $43,750 |
Poverty in Clawson
Income Below Poverty by Sex and Age in Clawson
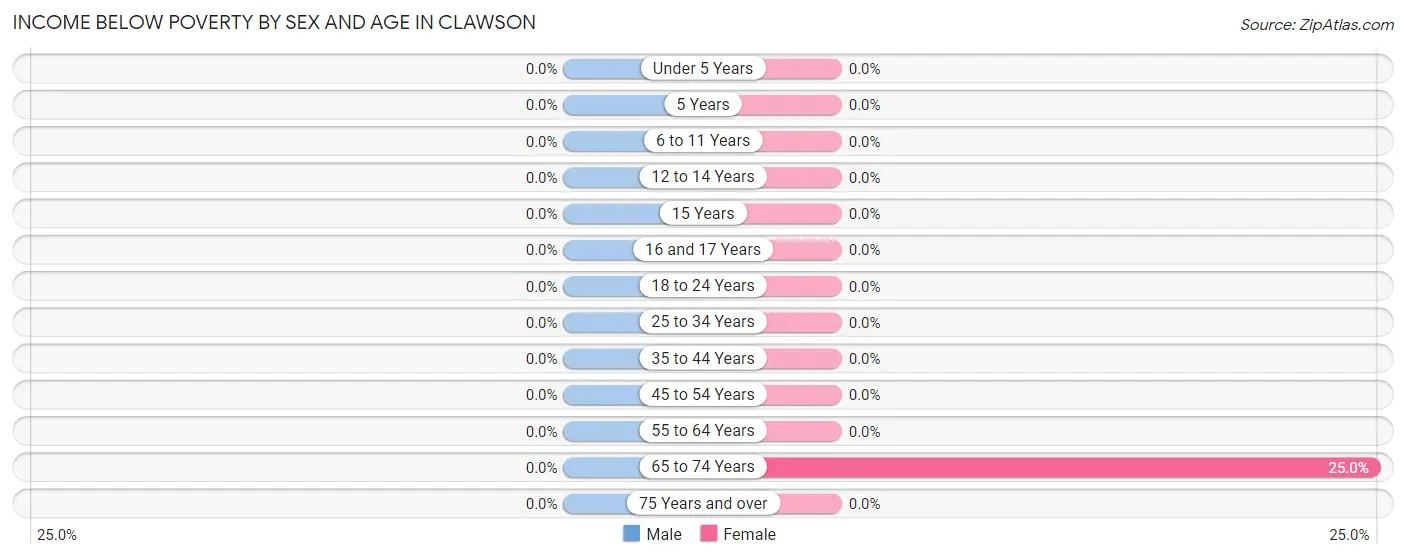
| Age Bracket | Male | Female |
| Under 5 Years | 0 (0.0%) | 0 (0.0%) |
| 5 Years | 0 (0.0%) | 0 (0.0%) |
| 6 to 11 Years | 0 (0.0%) | 0 (0.0%) |
| 12 to 14 Years | 0 (0.0%) | 0 (0.0%) |
| 15 Years | 0 (0.0%) | 0 (0.0%) |
| 16 and 17 Years | 0 (0.0%) | 0 (0.0%) |
| 18 to 24 Years | 0 (0.0%) | 0 (0.0%) |
| 25 to 34 Years | 0 (0.0%) | 0 (0.0%) |
| 35 to 44 Years | 0 (0.0%) | 0 (0.0%) |
| 45 to 54 Years | 0 (0.0%) | 0 (0.0%) |
| 55 to 64 Years | 0 (0.0%) | 0 (0.0%) |
| 65 to 74 Years | 0 (0.0%) | 4 (25.0%) |
| 75 Years and over | 0 (0.0%) | 0 (0.0%) |
| Total | 0 (0.0%) | 4 (13.3%) |
Income Above Poverty by Sex and Age in Clawson
According to the poverty statistics in Clawson, males aged 25 to 34 years and females aged 55 to 64 years are the age groups that are most secure financially, with 100.0% of males and 100.0% of females in these age groups living above the poverty line.
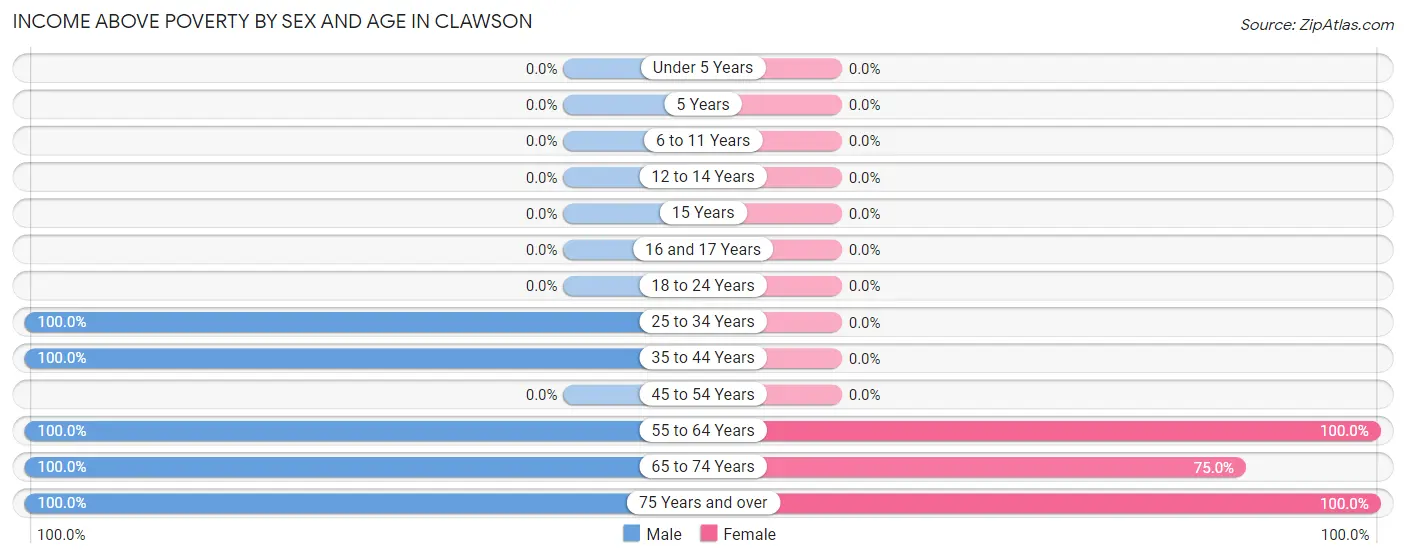
| Age Bracket | Male | Female |
| Under 5 Years | 0 (0.0%) | 0 (0.0%) |
| 5 Years | 0 (0.0%) | 0 (0.0%) |
| 6 to 11 Years | 0 (0.0%) | 0 (0.0%) |
| 12 to 14 Years | 0 (0.0%) | 0 (0.0%) |
| 15 Years | 0 (0.0%) | 0 (0.0%) |
| 16 and 17 Years | 0 (0.0%) | 0 (0.0%) |
| 18 to 24 Years | 0 (0.0%) | 0 (0.0%) |
| 25 to 34 Years | 5 (100.0%) | 0 (0.0%) |
| 35 to 44 Years | 2 (100.0%) | 0 (0.0%) |
| 45 to 54 Years | 0 (0.0%) | 0 (0.0%) |
| 55 to 64 Years | 5 (100.0%) | 5 (100.0%) |
| 65 to 74 Years | 14 (100.0%) | 12 (75.0%) |
| 75 Years and over | 5 (100.0%) | 9 (100.0%) |
| Total | 31 (100.0%) | 26 (86.7%) |
Income Below Poverty Among Married-Couple Families in Clawson
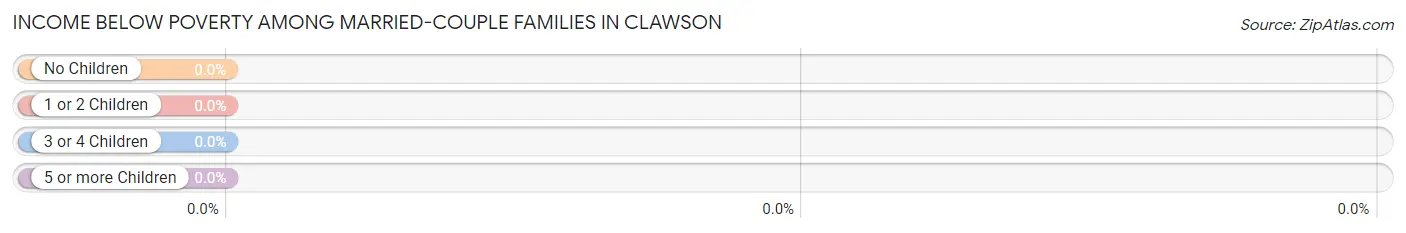
| Children | Above Poverty | Below Poverty |
| No Children | 19 (100.0%) | 0 (0.0%) |
| 1 or 2 Children | 0 (0.0%) | 0 (0.0%) |
| 3 or 4 Children | 0 (0.0%) | 0 (0.0%) |
| 5 or more Children | 0 (0.0%) | 0 (0.0%) |
| Total | 19 (100.0%) | 0 (0.0%) |
Income Below Poverty Among Single-Parent Households in Clawson
| Children | Single Father | Single Mother |
| No Children | 0 (0.0%) | 0 (0.0%) |
| 1 or 2 Children | 0 (0.0%) | 0 (0.0%) |
| 3 or 4 Children | 0 (0.0%) | 0 (0.0%) |
| 5 or more Children | 0 (0.0%) | 0 (0.0%) |
| Total | 0 (0.0%) | 0 (0.0%) |
Income Below Poverty Among Married-Couple vs Single-Parent Households in Clawson
| Children | Married-Couple Families | Single-Parent Households |
| No Children | 0 (0.0%) | 0 (0.0%) |
| 1 or 2 Children | 0 (0.0%) | 0 (0.0%) |
| 3 or 4 Children | 0 (0.0%) | 0 (0.0%) |
| 5 or more Children | 0 (0.0%) | 0 (0.0%) |
| Total | 0 (0.0%) | 0 (0.0%) |
Race in Clawson
The most populous races in Clawson are , and White / Caucasian (61 | 100.0%).
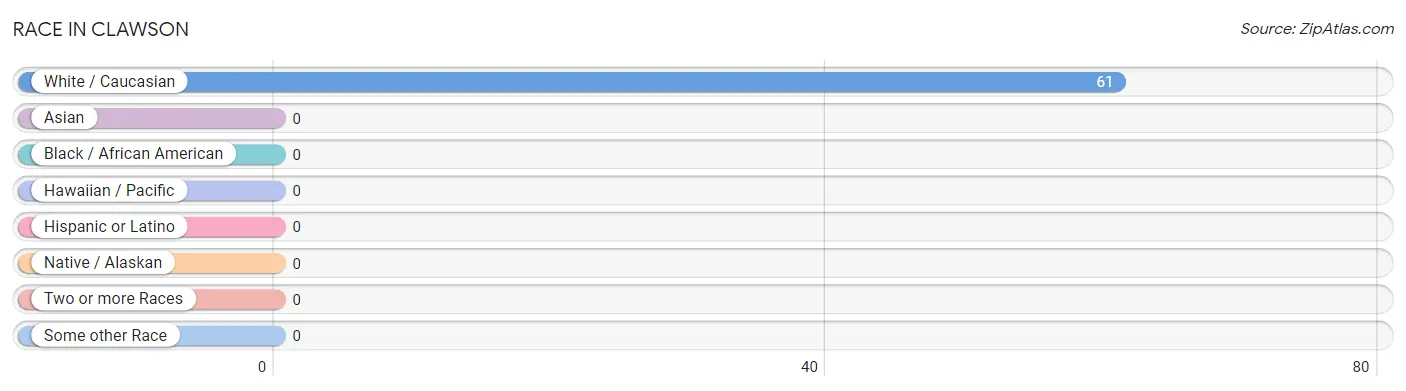
| Race | # Population | % Population |
| Asian | 0 | 0.0% |
| Black / African American | 0 | 0.0% |
| Hawaiian / Pacific | 0 | 0.0% |
| Hispanic or Latino | 0 | 0.0% |
| Native / Alaskan | 0 | 0.0% |
| White / Caucasian | 61 | 100.0% |
| Two or more Races | 0 | 0.0% |
| Some other Race | 0 | 0.0% |
| Total | 61 | 100.0% |
Ancestry in Clawson
The most populous ancestries reported in Clawson are English (21 | 34.4%), German (18 | 29.5%), Danish (9 | 14.7%), Irish (8 | 13.1%), and Swedish (8 | 13.1%), together accounting for 104.9% of all Clawson residents.
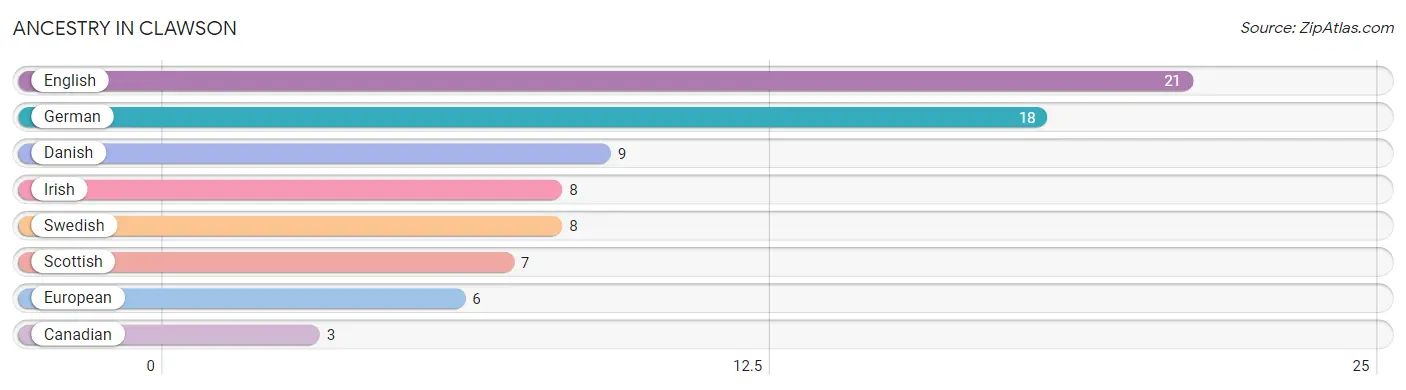
| Ancestry | # Population | % Population |
| Canadian | 3 | 4.9% |
| Danish | 9 | 14.7% |
| English | 21 | 34.4% |
| European | 6 | 9.8% |
| German | 18 | 29.5% |
| Irish | 8 | 13.1% |
| Scottish | 7 | 11.5% |
| Swedish | 8 | 13.1% | View All 8 Rows |
Immigrants in Clawson

| Immigration Origin | # Population | % Population | View All 0 Rows |
Sex and Age in Clawson
Sex and Age in Clawson
The most populous age groups in Clawson are 65 to 69 Years (9 | 29.0%) for men and 65 to 69 Years (8 | 26.7%) for women.
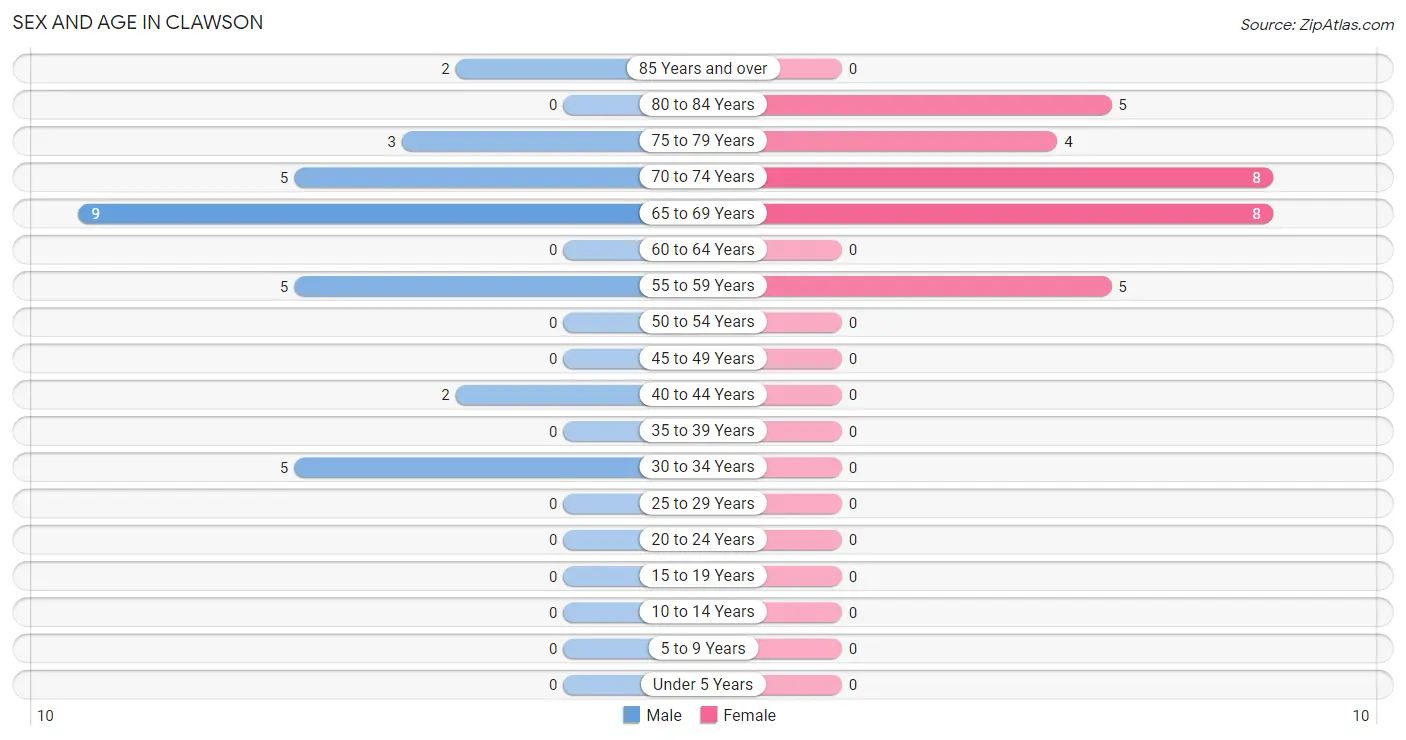
| Age Bracket | Male | Female |
| Under 5 Years | 0 (0.0%) | 0 (0.0%) |
| 5 to 9 Years | 0 (0.0%) | 0 (0.0%) |
| 10 to 14 Years | 0 (0.0%) | 0 (0.0%) |
| 15 to 19 Years | 0 (0.0%) | 0 (0.0%) |
| 20 to 24 Years | 0 (0.0%) | 0 (0.0%) |
| 25 to 29 Years | 0 (0.0%) | 0 (0.0%) |
| 30 to 34 Years | 5 (16.1%) | 0 (0.0%) |
| 35 to 39 Years | 0 (0.0%) | 0 (0.0%) |
| 40 to 44 Years | 2 (6.5%) | 0 (0.0%) |
| 45 to 49 Years | 0 (0.0%) | 0 (0.0%) |
| 50 to 54 Years | 0 (0.0%) | 0 (0.0%) |
| 55 to 59 Years | 5 (16.1%) | 5 (16.7%) |
| 60 to 64 Years | 0 (0.0%) | 0 (0.0%) |
| 65 to 69 Years | 9 (29.0%) | 8 (26.7%) |
| 70 to 74 Years | 5 (16.1%) | 8 (26.7%) |
| 75 to 79 Years | 3 (9.7%) | 4 (13.3%) |
| 80 to 84 Years | 0 (0.0%) | 5 (16.7%) |
| 85 Years and over | 2 (6.5%) | 0 (0.0%) |
| Total | 31 (100.0%) | 30 (100.0%) |
Families and Households in Clawson
Median Family Size in Clawson
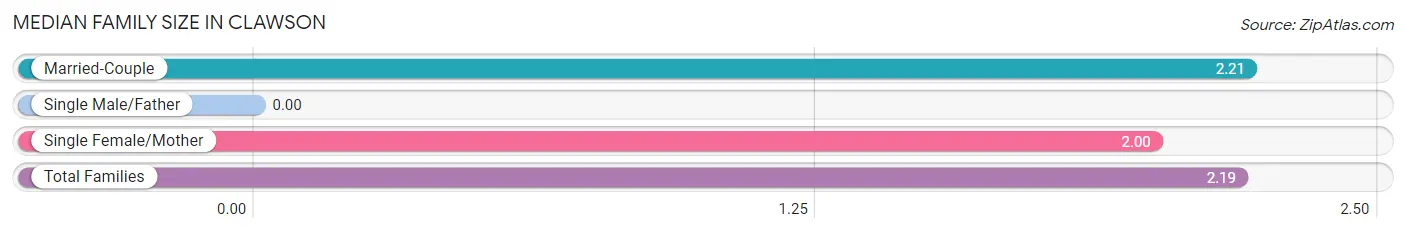
| Family Type | # Families | Family Size |
| Married-Couple | 19 (90.5%) | 2.21 |
| Single Male/Father | 0 (0.0%) | - |
| Single Female/Mother | 2 (9.5%) | 2.00 |
| Total Families | 21 (100.0%) | 2.19 |
Median Household Size in Clawson
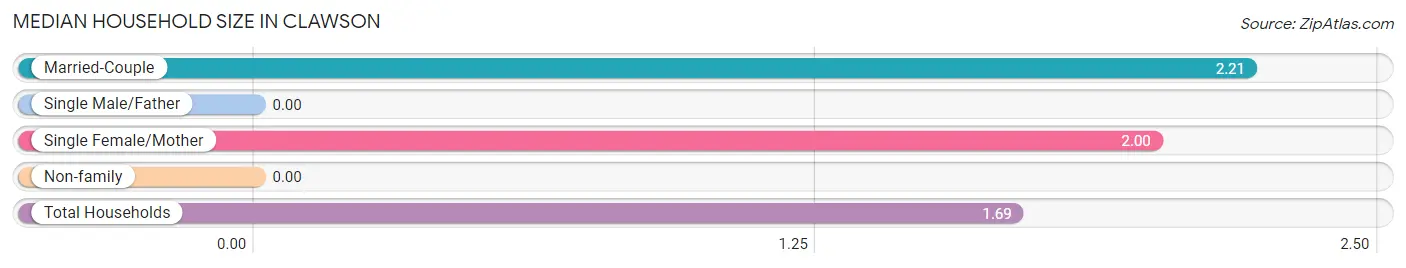
| Household Type | # Households | Household Size |
| Married-Couple | 19 (52.8%) | 2.21 |
| Single Male/Father | 0 (0.0%) | - |
| Single Female/Mother | 2 (5.6%) | 2.00 |
| Non-family | 15 (41.7%) | - |
| Total Households | 36 (100.0%) | 1.69 |
Household Size by Marriage Status in Clawson
Out of a total of 36 households in Clawson, 21 (58.3%) are family households, while 15 (41.7%) are nonfamily households. The most numerous type of family households are 2-person households, comprising 18, and the most common type of nonfamily households are 1-person households, comprising 15.
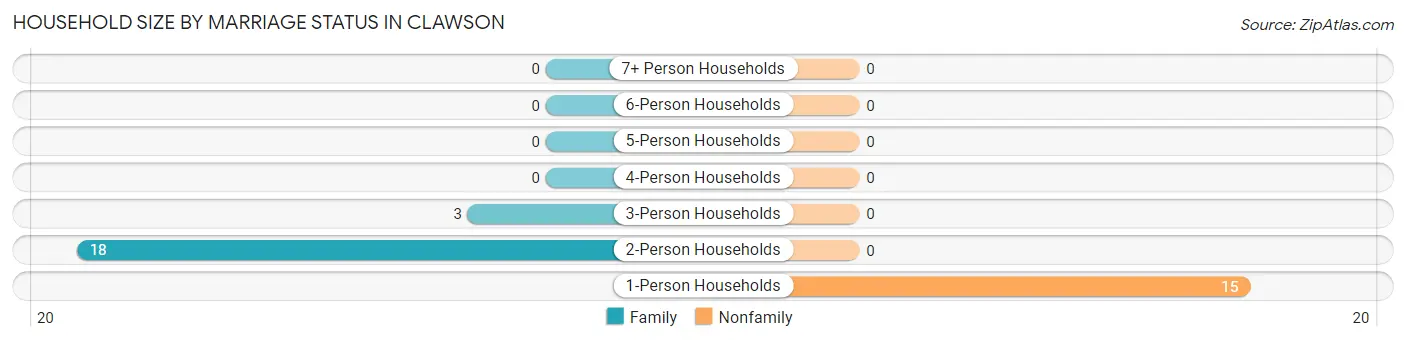
| Household Size | Family Households | Nonfamily Households |
| 1-Person Households | - | 15 (41.7%) |
| 2-Person Households | 18 (50.0%) | 0 (0.0%) |
| 3-Person Households | 3 (8.3%) | 0 (0.0%) |
| 4-Person Households | 0 (0.0%) | 0 (0.0%) |
| 5-Person Households | 0 (0.0%) | 0 (0.0%) |
| 6-Person Households | 0 (0.0%) | 0 (0.0%) |
| 7+ Person Households | 0 (0.0%) | 0 (0.0%) |
| Total | 21 (58.3%) | 15 (41.7%) |
Female Fertility in Clawson
Fertility by Age in Clawson
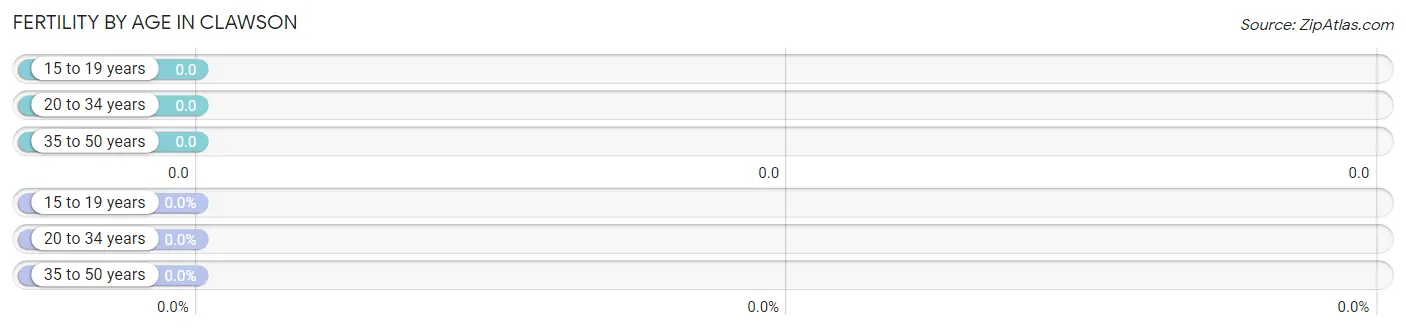
| Age Bracket | Women with Births | Births / 1,000 Women |
| 15 to 19 years | 0 (0.0%) | 0.0 |
| 20 to 34 years | 0 (0.0%) | 0.0 |
| 35 to 50 years | 0 (0.0%) | 0.0 |
| Total | 0 (0.0%) | 0.0 |
Fertility by Age by Marriage Status in Clawson
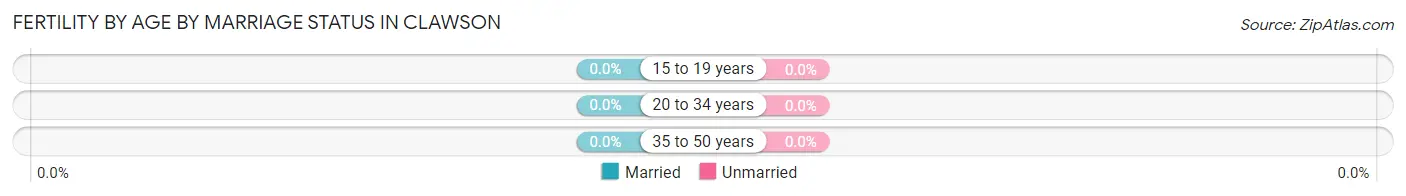
| Age Bracket | Married | Unmarried |
| 15 to 19 years | 0 (0.0%) | 0 (0.0%) |
| 20 to 34 years | 0 (0.0%) | 0 (0.0%) |
| 35 to 50 years | 0 (0.0%) | 0 (0.0%) |
| Total | 0 (0.0%) | 0 (0.0%) |
Fertility by Education in Clawson
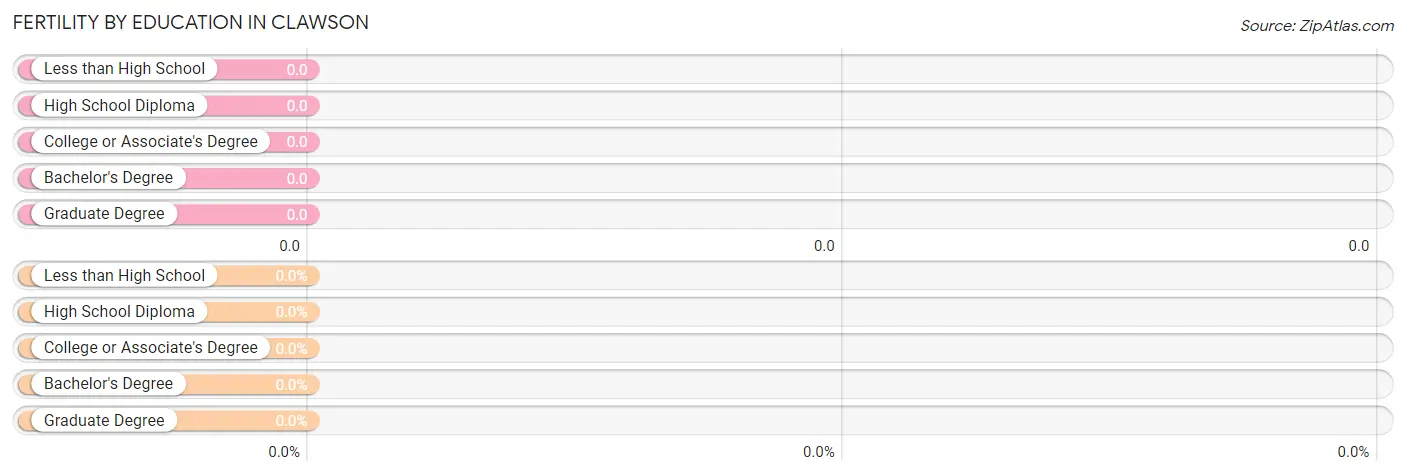
| Educational Attainment | Women with Births | Births / 1,000 Women |
| Less than High School | 0 (0.0%) | 0.0 |
| High School Diploma | 0 (0.0%) | 0.0 |
| College or Associate's Degree | 0 (0.0%) | 0.0 |
| Bachelor's Degree | 0 (0.0%) | 0.0 |
| Graduate Degree | 0 (0.0%) | 0.0 |
| Total | 0 (0.0%) | 0.0 |
Fertility by Education by Marriage Status in Clawson
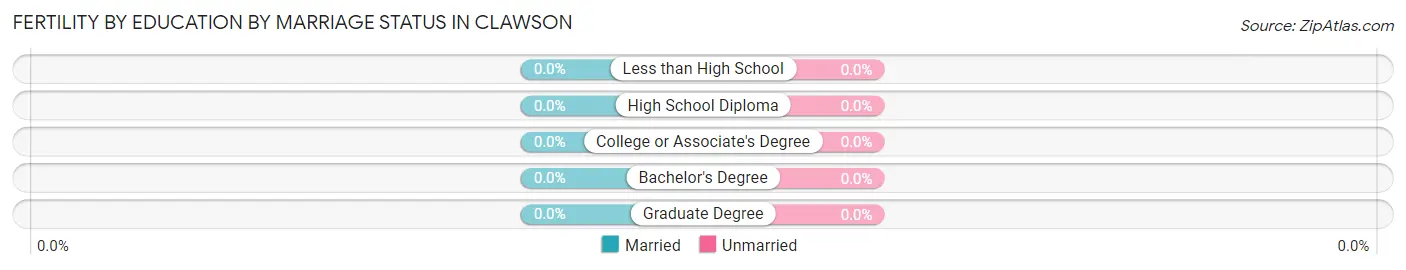
| Educational Attainment | Married | Unmarried |
| Less than High School | 0 (0.0%) | 0 (0.0%) |
| High School Diploma | 0 (0.0%) | 0 (0.0%) |
| College or Associate's Degree | 0 (0.0%) | 0 (0.0%) |
| Bachelor's Degree | 0 (0.0%) | 0 (0.0%) |
| Graduate Degree | 0 (0.0%) | 0 (0.0%) |
| Total | 0 (0.0%) | 0 (0.0%) |
Employment Characteristics in Clawson
Employment by Class of Employer in Clawson
Among the 11 employed individuals in Clawson, private company employees (3 | 27.3%), not-for-profit organizations (3 | 27.3%), and local government employees (3 | 27.3%) make up the most common classes of employment.
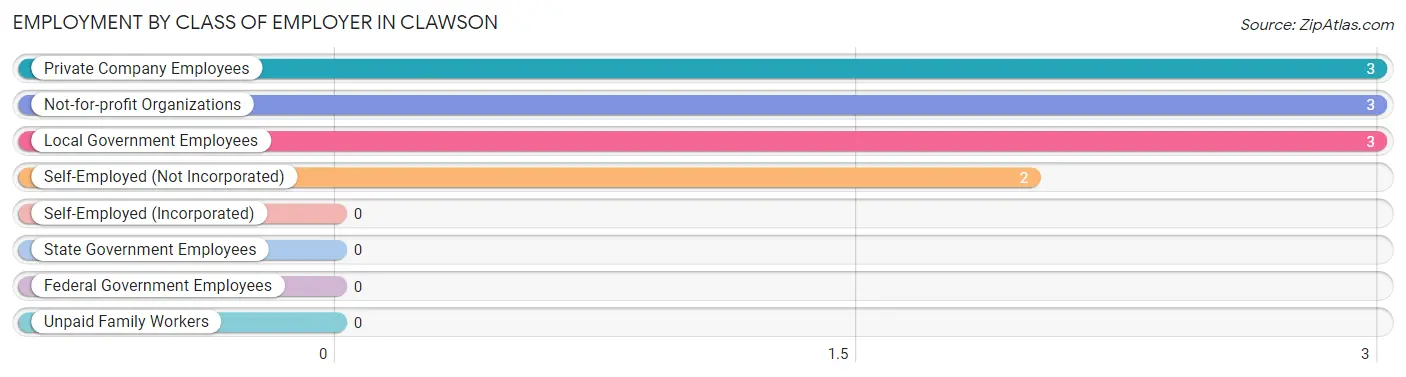
| Employer Class | # Employees | % Employees |
| Private Company Employees | 3 | 27.3% |
| Self-Employed (Incorporated) | 0 | 0.0% |
| Self-Employed (Not Incorporated) | 2 | 18.2% |
| Not-for-profit Organizations | 3 | 27.3% |
| Local Government Employees | 3 | 27.3% |
| State Government Employees | 0 | 0.0% |
| Federal Government Employees | 0 | 0.0% |
| Unpaid Family Workers | 0 | 0.0% |
| Total | 11 | 100.0% |
Employment Status by Age in Clawson

| Age Bracket | In Labor Force | Unemployed |
| 16 to 19 Years | 0 (0.0%) | 0 (0.0%) |
| 20 to 24 Years | 0 (0.0%) | 0 (0.0%) |
| 25 to 29 Years | 0 (0.0%) | 0 (0.0%) |
| 30 to 34 Years | 0 (0.0%) | 0 (0.0%) |
| 35 to 44 Years | 0 (0.0%) | 0 (0.0%) |
| 45 to 54 Years | 0 (0.0%) | 0 (0.0%) |
| 55 to 59 Years | 10 (100.0%) | 0 (0.0%) |
| 60 to 64 Years | 0 (0.0%) | 0 (0.0%) |
| 65 to 74 Years | 3 (10.0%) | 0 (0.0%) |
| 75 Years and over | 0 (0.0%) | 0 (0.0%) |
| Total | 13 (21.3%) | 0 (0.0%) |
Employment Status by Educational Attainment in Clawson
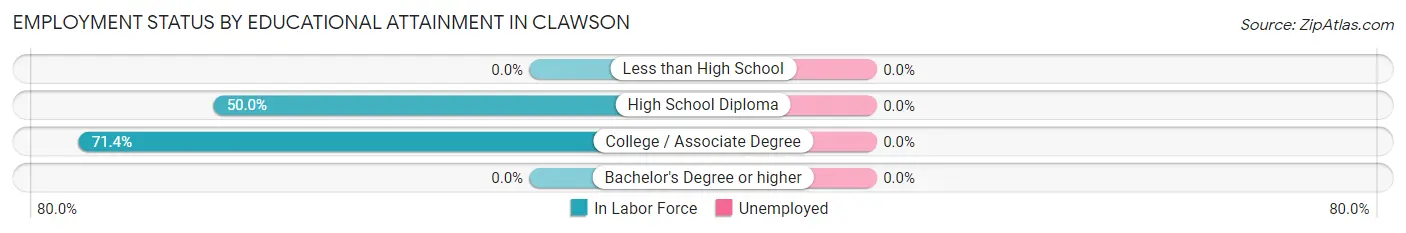
| Educational Attainment | In Labor Force | Unemployed |
| Less than High School | 0 (0.0%) | 0 (0.0%) |
| High School Diploma | 5 (50.0%) | 0 (0.0%) |
| College / Associate Degree | 5 (71.4%) | 0 (0.0%) |
| Bachelor's Degree or higher | 0 (0.0%) | 0 (0.0%) |
| Total | 10 (58.8%) | 0 (0.0%) |
Employment Occupations by Sex in Clawson
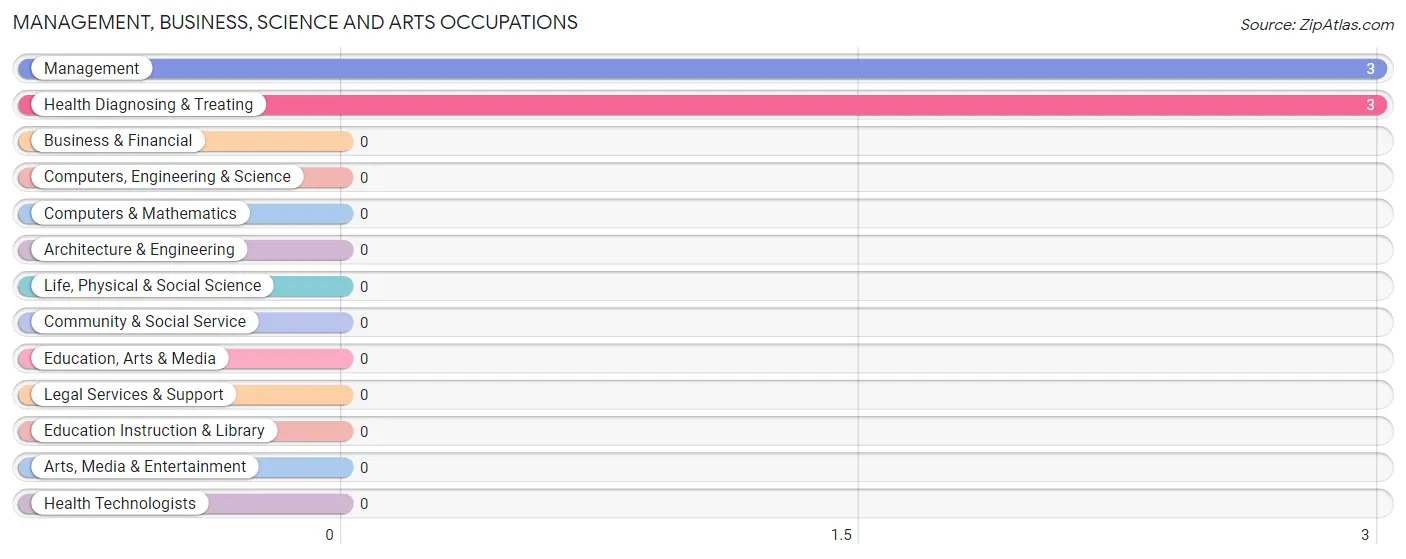
Management, Business, Science and Arts Occupations
The most common Management, Business, Science and Arts occupations in Clawson are Management (3 | 23.1%), and Health Diagnosing & Treating (3 | 23.1%).
Management, Business, Science and Arts Occupations by Sex
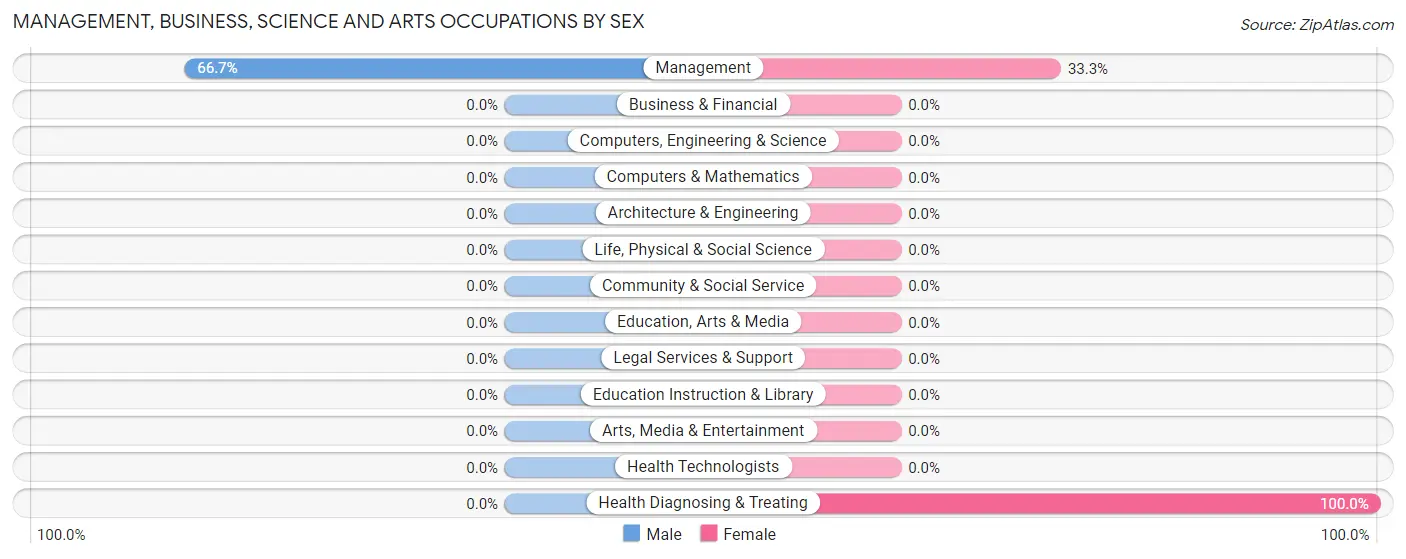
| Occupation | Male | Female |
| Management | 2 (66.7%) | 1 (33.3%) |
| Business & Financial | 0 (0.0%) | 0 (0.0%) |
| Computers, Engineering & Science | 0 (0.0%) | 0 (0.0%) |
| Computers & Mathematics | 0 (0.0%) | 0 (0.0%) |
| Architecture & Engineering | 0 (0.0%) | 0 (0.0%) |
| Life, Physical & Social Science | 0 (0.0%) | 0 (0.0%) |
| Community & Social Service | 0 (0.0%) | 0 (0.0%) |
| Education, Arts & Media | 0 (0.0%) | 0 (0.0%) |
| Legal Services & Support | 0 (0.0%) | 0 (0.0%) |
| Education Instruction & Library | 0 (0.0%) | 0 (0.0%) |
| Arts, Media & Entertainment | 0 (0.0%) | 0 (0.0%) |
| Health Diagnosing & Treating | 0 (0.0%) | 3 (100.0%) |
| Health Technologists | 0 (0.0%) | 0 (0.0%) |
| Total (Category) | 2 (33.3%) | 4 (66.7%) |
| Total (Overall) | 7 (53.8%) | 6 (46.2%) |
Services Occupations
The most common Services occupations in Clawson are , and Cleaning & Maintenance (1 | 7.7%).
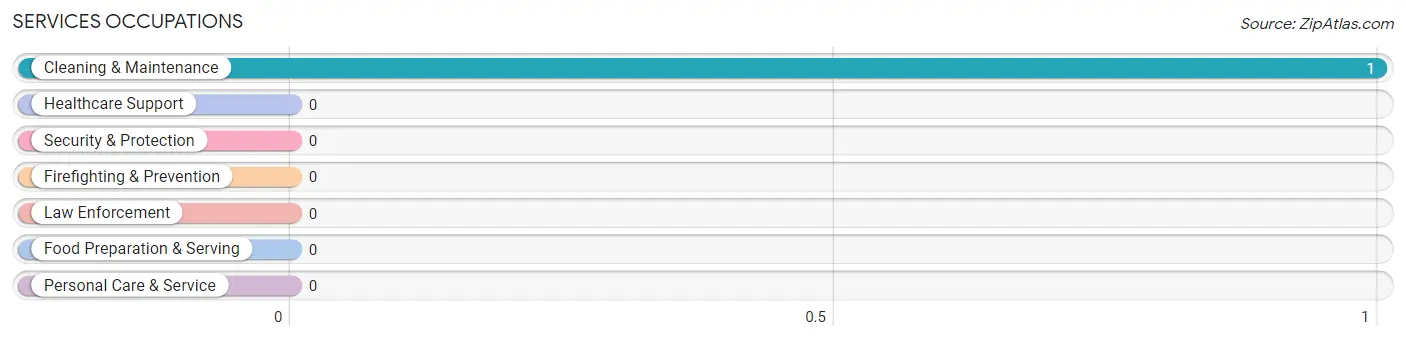
Services Occupations by Sex
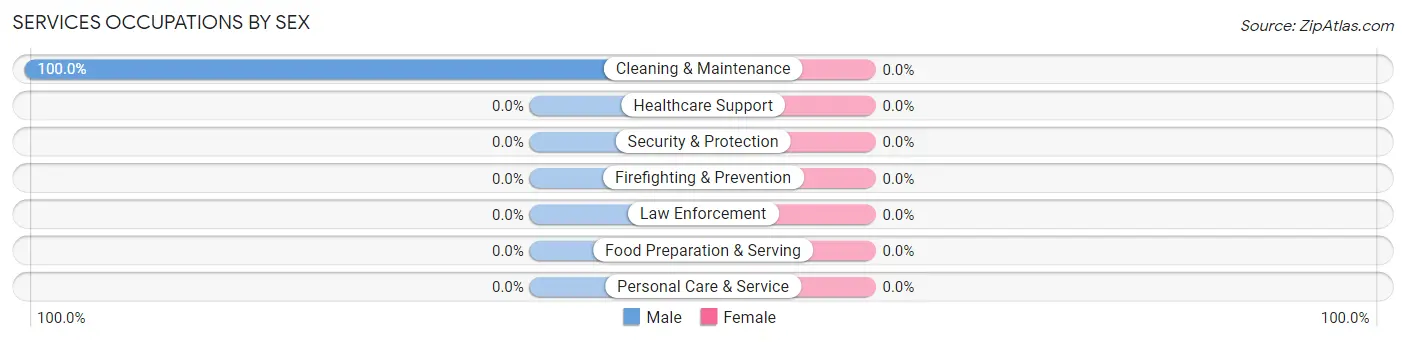
| Occupation | Male | Female |
| Healthcare Support | 0 (0.0%) | 0 (0.0%) |
| Security & Protection | 0 (0.0%) | 0 (0.0%) |
| Firefighting & Prevention | 0 (0.0%) | 0 (0.0%) |
| Law Enforcement | 0 (0.0%) | 0 (0.0%) |
| Food Preparation & Serving | 0 (0.0%) | 0 (0.0%) |
| Cleaning & Maintenance | 1 (100.0%) | 0 (0.0%) |
| Personal Care & Service | 0 (0.0%) | 0 (0.0%) |
| Total (Category) | 1 (100.0%) | 0 (0.0%) |
| Total (Overall) | 7 (53.8%) | 6 (46.2%) |
Sales and Office Occupations
The most common Sales and Office occupations in Clawson are , and Sales & Related (1 | 7.7%).
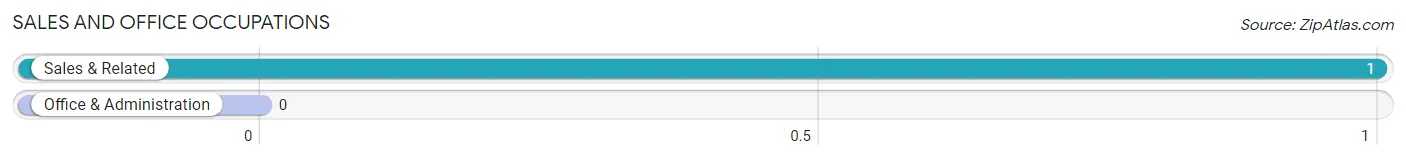
Sales and Office Occupations by Sex
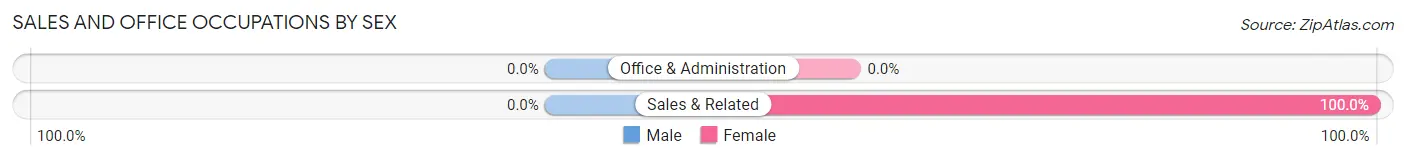
| Occupation | Male | Female |
| Sales & Related | 0 (0.0%) | 1 (100.0%) |
| Office & Administration | 0 (0.0%) | 0 (0.0%) |
| Total (Category) | 0 (0.0%) | 1 (100.0%) |
| Total (Overall) | 7 (53.8%) | 6 (46.2%) |
Natural Resources, Construction and Maintenance Occupations
The most common Natural Resources, Construction and Maintenance occupations in Clawson are Installation, Maintenance & Repair (3 | 23.1%), Farming, Fishing & Forestry (1 | 7.7%), and Construction & Extraction (1 | 7.7%).
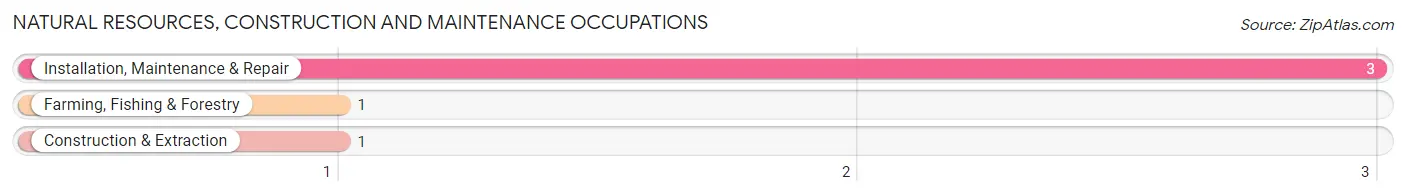
Natural Resources, Construction and Maintenance Occupations by Sex
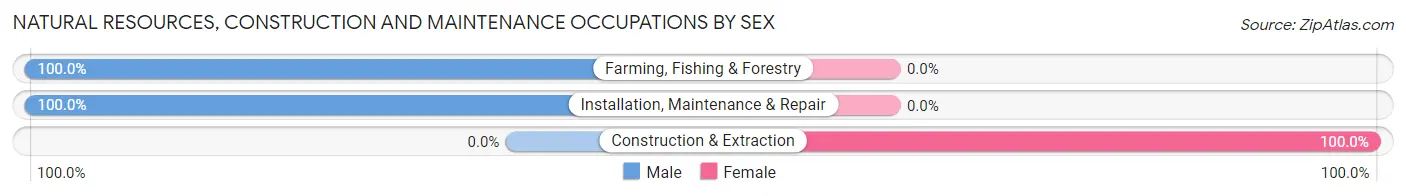
| Occupation | Male | Female |
| Farming, Fishing & Forestry | 1 (100.0%) | 0 (0.0%) |
| Construction & Extraction | 0 (0.0%) | 1 (100.0%) |
| Installation, Maintenance & Repair | 3 (100.0%) | 0 (0.0%) |
| Total (Category) | 4 (80.0%) | 1 (20.0%) |
| Total (Overall) | 7 (53.8%) | 6 (46.2%) |
Production, Transportation and Moving Occupations
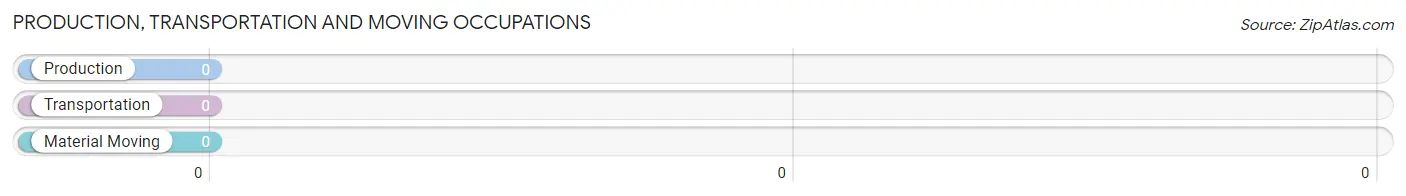
Production, Transportation and Moving Occupations by Sex
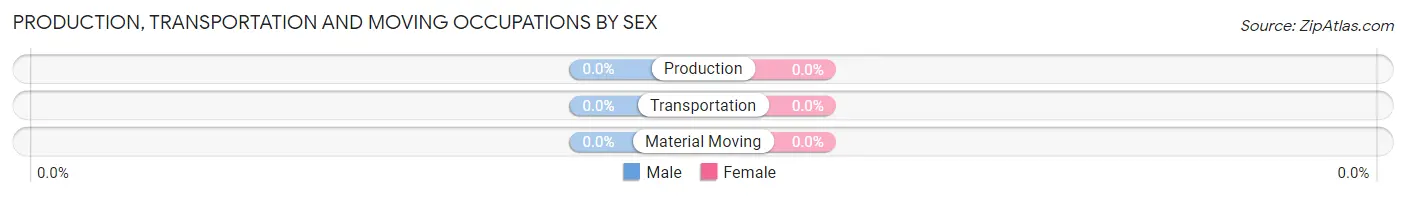
| Occupation | Male | Female |
| Production | 0 (0.0%) | 0 (0.0%) |
| Transportation | 0 (0.0%) | 0 (0.0%) |
| Material Moving | 0 (0.0%) | 0 (0.0%) |
| Total (Category) | 0 (0.0%) | 0 (0.0%) |
| Total (Overall) | 7 (53.8%) | 6 (46.2%) |
Employment Industries by Sex in Clawson
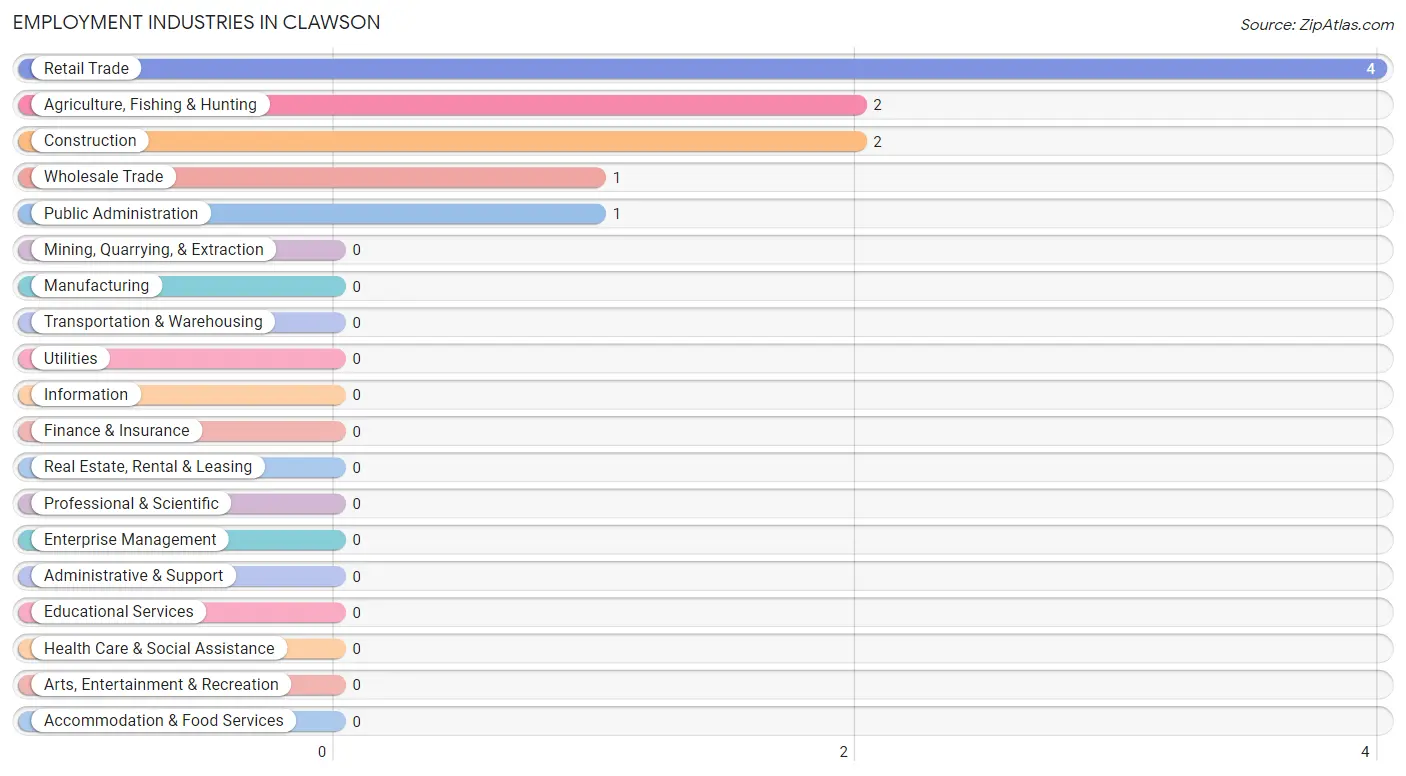
Employment Industries in Clawson
The major employment industries in Clawson include Retail Trade (4 | 30.8%), Agriculture, Fishing & Hunting (2 | 15.4%), Construction (2 | 15.4%), Wholesale Trade (1 | 7.7%), and Public Administration (1 | 7.7%).
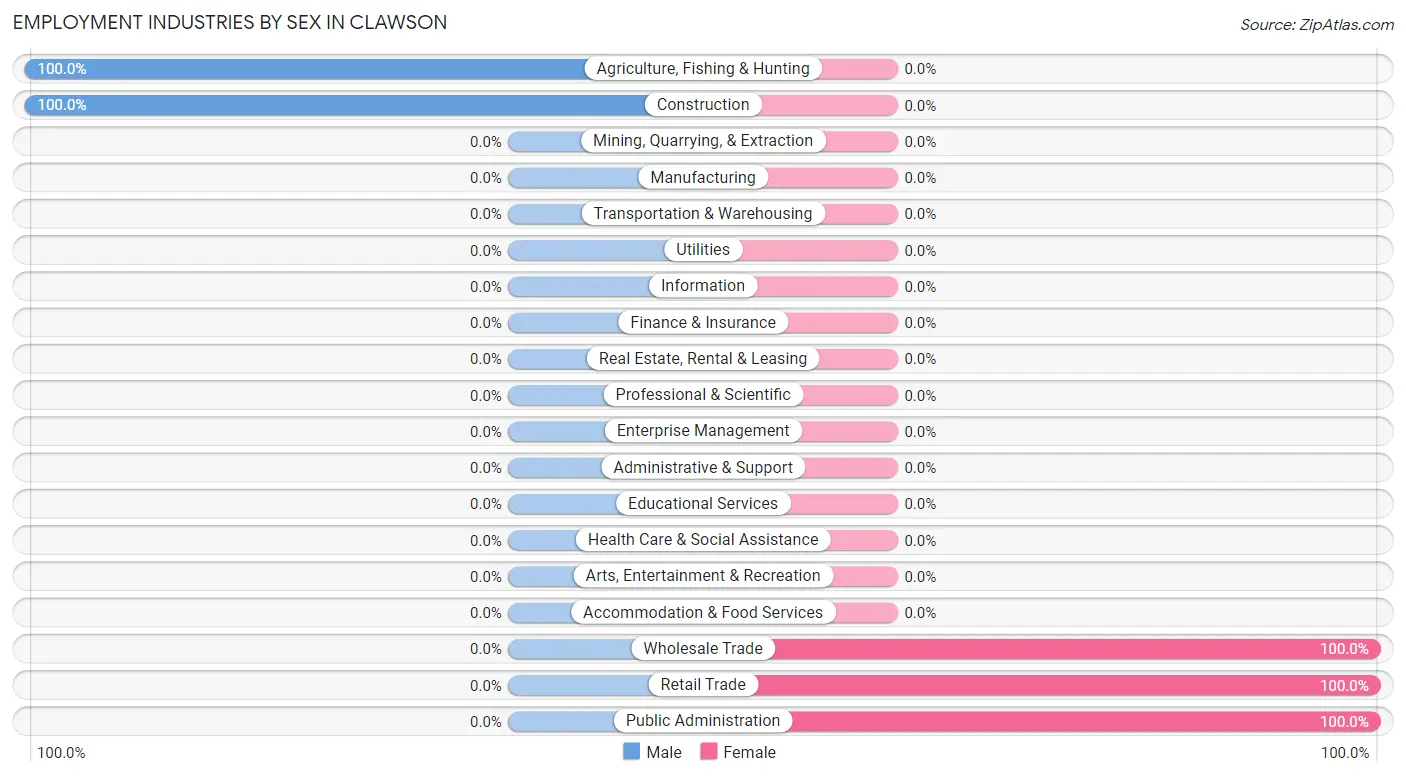
Employment Industries by Sex in Clawson
The Clawson industries that see more men than women are Agriculture, Fishing & Hunting (100.0%), and Construction (100.0%), whereas the industries that tend to have a higher number of women are Wholesale Trade (100.0%), Retail Trade (100.0%), and Public Administration (100.0%).
| Industry | Male | Female |
| Agriculture, Fishing & Hunting | 2 (100.0%) | 0 (0.0%) |
| Mining, Quarrying, & Extraction | 0 (0.0%) | 0 (0.0%) |
| Construction | 2 (100.0%) | 0 (0.0%) |
| Manufacturing | 0 (0.0%) | 0 (0.0%) |
| Wholesale Trade | 0 (0.0%) | 1 (100.0%) |
| Retail Trade | 0 (0.0%) | 4 (100.0%) |
| Transportation & Warehousing | 0 (0.0%) | 0 (0.0%) |
| Utilities | 0 (0.0%) | 0 (0.0%) |
| Information | 0 (0.0%) | 0 (0.0%) |
| Finance & Insurance | 0 (0.0%) | 0 (0.0%) |
| Real Estate, Rental & Leasing | 0 (0.0%) | 0 (0.0%) |
| Professional & Scientific | 0 (0.0%) | 0 (0.0%) |
| Enterprise Management | 0 (0.0%) | 0 (0.0%) |
| Administrative & Support | 0 (0.0%) | 0 (0.0%) |
| Educational Services | 0 (0.0%) | 0 (0.0%) |
| Health Care & Social Assistance | 0 (0.0%) | 0 (0.0%) |
| Arts, Entertainment & Recreation | 0 (0.0%) | 0 (0.0%) |
| Accommodation & Food Services | 0 (0.0%) | 0 (0.0%) |
| Public Administration | 0 (0.0%) | 1 (100.0%) |
| Total | 7 (53.8%) | 6 (46.2%) |
Education in Clawson
School Enrollment in Clawson
| School Level | # Students | % Students |
| Nursery / Preschool | 0 | 0.0% |
| Kindergarten | 0 | 0.0% |
| Elementary School | 0 | 0.0% |
| Middle School | 0 | 0.0% |
| High School | 0 | 0.0% |
| College / Undergraduate | 0 | 0.0% |
| Graduate / Professional | 0 | 0.0% |
| Total | 0 | 0.0% |
School Enrollment by Age by Funding Source in Clawson
| Age Bracket | Public School | Private School |
| 3 to 4 Year Olds | 0 (0.0%) | 0 (0.0%) |
| 5 to 9 Year Old | 0 (0.0%) | 0 (0.0%) |
| 10 to 14 Year Olds | 0 (0.0%) | 0 (0.0%) |
| 15 to 17 Year Olds | 0 (0.0%) | 0 (0.0%) |
| 18 to 19 Year Olds | 0 (0.0%) | 0 (0.0%) |
| 20 to 24 Year Olds | 0 (0.0%) | 0 (0.0%) |
| 25 to 34 Year Olds | 0 (0.0%) | 0 (0.0%) |
| 35 Years and over | 0 (0.0%) | 0 (0.0%) |
| Total | 0 (0.0%) | 0 (0.0%) |
Educational Attainment by Field of Study in Clawson
Science & technology (3 | 33.3%), bio, nature & agricultural (2 | 22.2%), psychology (2 | 22.2%), and liberal arts & history (2 | 22.2%) are the most common fields of study among 9 individuals in Clawson who have obtained a bachelor's degree or higher.
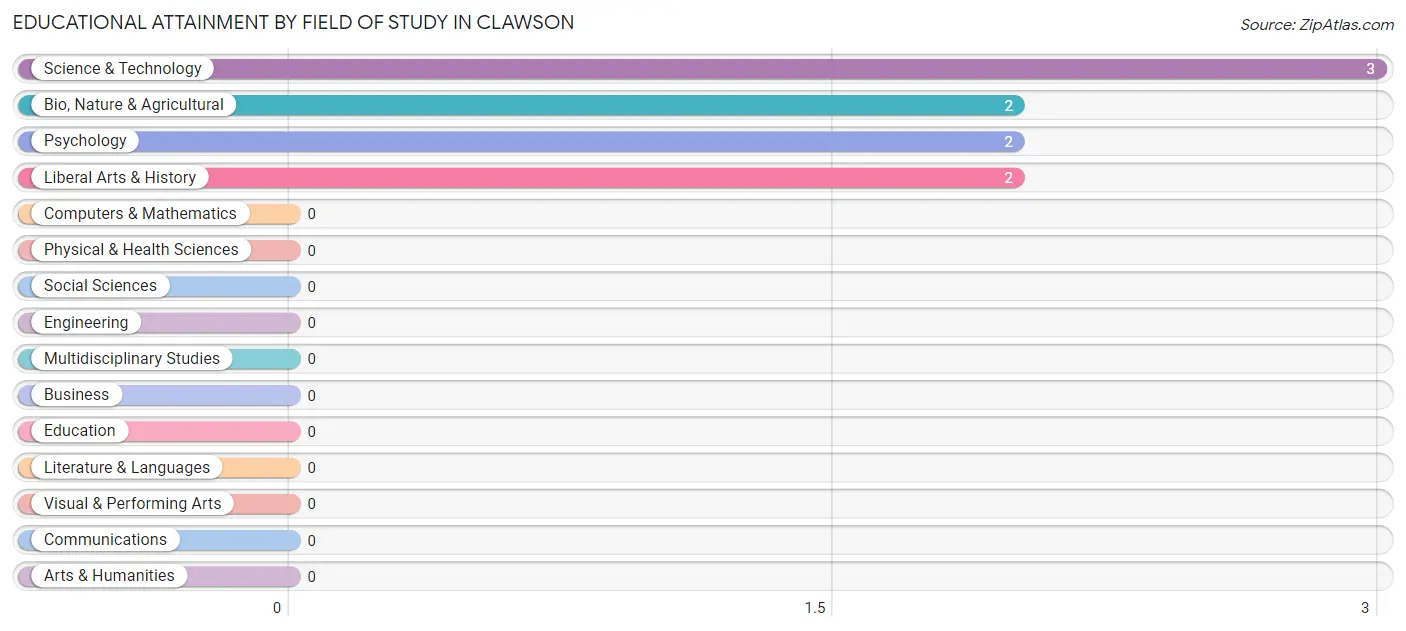
| Field of Study | # Graduates | % Graduates |
| Computers & Mathematics | 0 | 0.0% |
| Bio, Nature & Agricultural | 2 | 22.2% |
| Physical & Health Sciences | 0 | 0.0% |
| Psychology | 2 | 22.2% |
| Social Sciences | 0 | 0.0% |
| Engineering | 0 | 0.0% |
| Multidisciplinary Studies | 0 | 0.0% |
| Science & Technology | 3 | 33.3% |
| Business | 0 | 0.0% |
| Education | 0 | 0.0% |
| Literature & Languages | 0 | 0.0% |
| Liberal Arts & History | 2 | 22.2% |
| Visual & Performing Arts | 0 | 0.0% |
| Communications | 0 | 0.0% |
| Arts & Humanities | 0 | 0.0% |
| Total | 9 | 100.0% |
Transportation & Commute in Clawson
Vehicle Availability by Sex in Clawson
The most prevalent vehicle ownership categories in Clawson are males with 3 vehicles (3, accounting for 60.0%) and females with 3 vehicles (4, making up 50.0%).
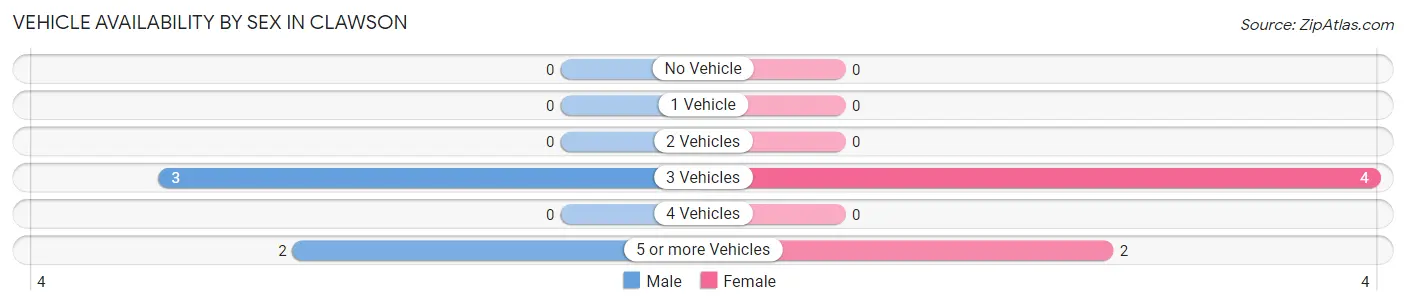
| Vehicles Available | Male | Female |
| No Vehicle | 0 (0.0%) | 0 (0.0%) |
| 1 Vehicle | 0 (0.0%) | 0 (0.0%) |
| 2 Vehicles | 0 (0.0%) | 0 (0.0%) |
| 3 Vehicles | 3 (60.0%) | 4 (66.7%) |
| 4 Vehicles | 0 (0.0%) | 0 (0.0%) |
| 5 or more Vehicles | 2 (40.0%) | 2 (33.3%) |
| Total | 5 (100.0%) | 6 (100.0%) |
Commute Time in Clawson
The most frequently occuring commute durations in Clawson are 5 to 9 minutes (6 commuters, 54.5%), less than 5 minutes (1 commuters, 9.1%), and 15 to 19 minutes (1 commuters, 9.1%).
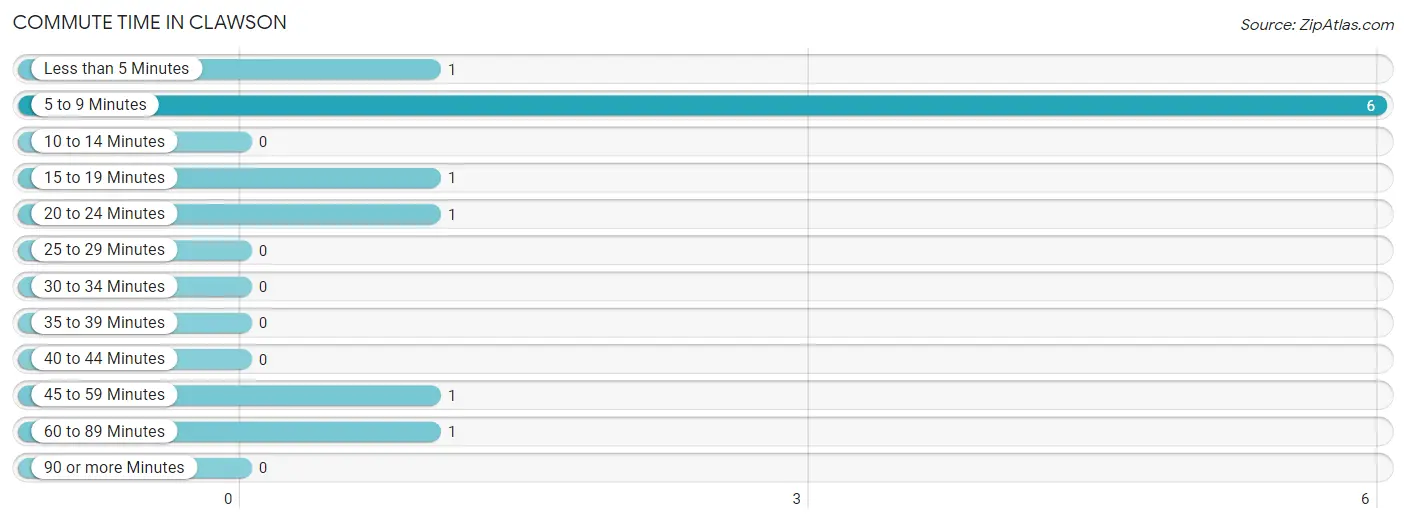
| Commute Time | # Commuters | % Commuters |
| Less than 5 Minutes | 1 | 9.1% |
| 5 to 9 Minutes | 6 | 54.5% |
| 10 to 14 Minutes | 0 | 0.0% |
| 15 to 19 Minutes | 1 | 9.1% |
| 20 to 24 Minutes | 1 | 9.1% |
| 25 to 29 Minutes | 0 | 0.0% |
| 30 to 34 Minutes | 0 | 0.0% |
| 35 to 39 Minutes | 0 | 0.0% |
| 40 to 44 Minutes | 0 | 0.0% |
| 45 to 59 Minutes | 1 | 9.1% |
| 60 to 89 Minutes | 1 | 9.1% |
| 90 or more Minutes | 0 | 0.0% |
Commute Time by Sex in Clawson
The most common commute times in Clawson are 5 to 9 minutes (3 commuters, 60.0%) for males and 5 to 9 minutes (3 commuters, 50.0%) for females.
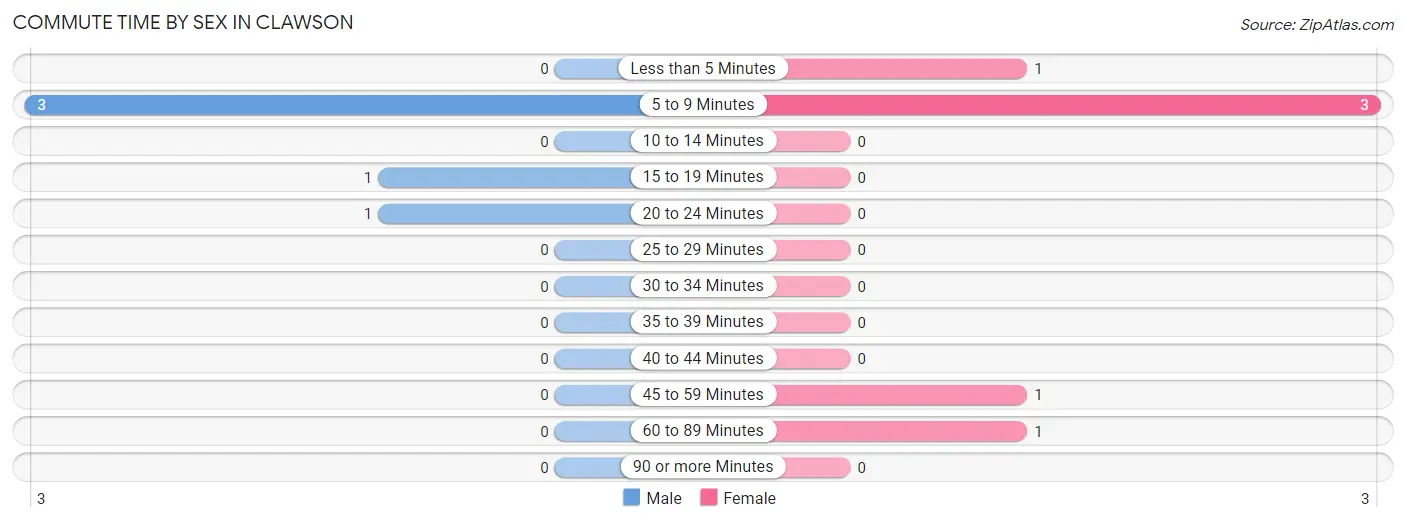
| Commute Time | Male | Female |
| Less than 5 Minutes | 0 (0.0%) | 1 (16.7%) |
| 5 to 9 Minutes | 3 (60.0%) | 3 (50.0%) |
| 10 to 14 Minutes | 0 (0.0%) | 0 (0.0%) |
| 15 to 19 Minutes | 1 (20.0%) | 0 (0.0%) |
| 20 to 24 Minutes | 1 (20.0%) | 0 (0.0%) |
| 25 to 29 Minutes | 0 (0.0%) | 0 (0.0%) |
| 30 to 34 Minutes | 0 (0.0%) | 0 (0.0%) |
| 35 to 39 Minutes | 0 (0.0%) | 0 (0.0%) |
| 40 to 44 Minutes | 0 (0.0%) | 0 (0.0%) |
| 45 to 59 Minutes | 0 (0.0%) | 1 (16.7%) |
| 60 to 89 Minutes | 0 (0.0%) | 1 (16.7%) |
| 90 or more Minutes | 0 (0.0%) | 0 (0.0%) |
Time of Departure to Work by Sex in Clawson
The most frequent times of departure to work in Clawson are 6:30 AM to 6:59 AM (4, 80.0%) for males and 8:00 AM to 8:29 AM (3, 50.0%) for females.
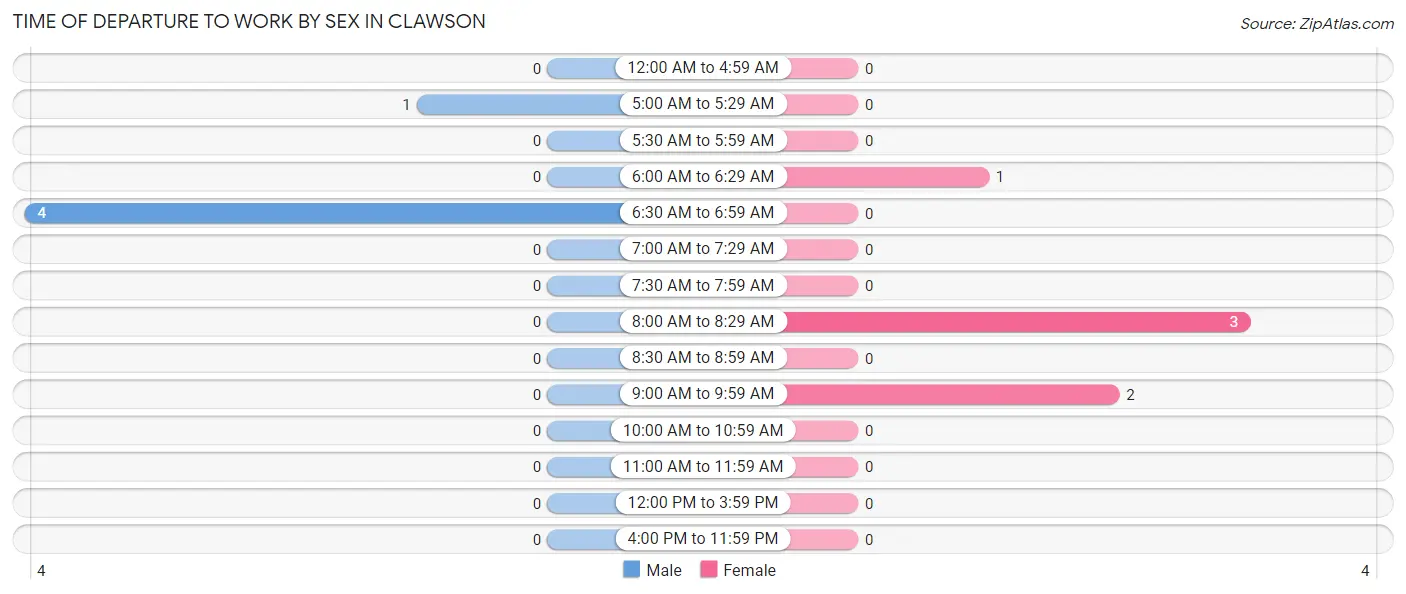
| Time of Departure | Male | Female |
| 12:00 AM to 4:59 AM | 0 (0.0%) | 0 (0.0%) |
| 5:00 AM to 5:29 AM | 1 (20.0%) | 0 (0.0%) |
| 5:30 AM to 5:59 AM | 0 (0.0%) | 0 (0.0%) |
| 6:00 AM to 6:29 AM | 0 (0.0%) | 1 (16.7%) |
| 6:30 AM to 6:59 AM | 4 (80.0%) | 0 (0.0%) |
| 7:00 AM to 7:29 AM | 0 (0.0%) | 0 (0.0%) |
| 7:30 AM to 7:59 AM | 0 (0.0%) | 0 (0.0%) |
| 8:00 AM to 8:29 AM | 0 (0.0%) | 3 (50.0%) |
| 8:30 AM to 8:59 AM | 0 (0.0%) | 0 (0.0%) |
| 9:00 AM to 9:59 AM | 0 (0.0%) | 2 (33.3%) |
| 10:00 AM to 10:59 AM | 0 (0.0%) | 0 (0.0%) |
| 11:00 AM to 11:59 AM | 0 (0.0%) | 0 (0.0%) |
| 12:00 PM to 3:59 PM | 0 (0.0%) | 0 (0.0%) |
| 4:00 PM to 11:59 PM | 0 (0.0%) | 0 (0.0%) |
| Total | 5 (100.0%) | 6 (100.0%) |
Housing Occupancy in Clawson
Occupancy by Ownership in Clawson
Of the total 36 dwellings in Clawson, owner-occupied units account for 29 (80.6%), while renter-occupied units make up 7 (19.4%).
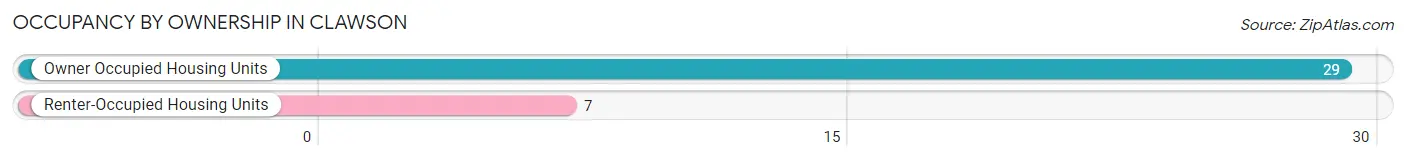
| Occupancy | # Housing Units | % Housing Units |
| Owner Occupied Housing Units | 29 | 80.6% |
| Renter-Occupied Housing Units | 7 | 19.4% |
| Total Occupied Housing Units | 36 | 100.0% |
Occupancy by Household Size in Clawson
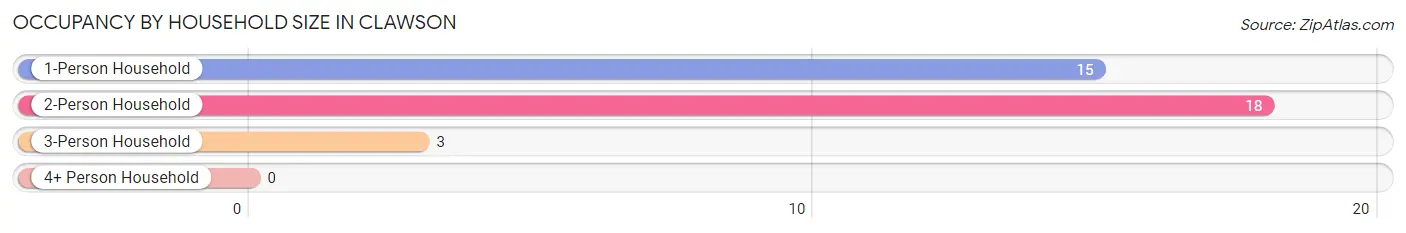
| Household Size | # Housing Units | % Housing Units |
| 1-Person Household | 15 | 41.7% |
| 2-Person Household | 18 | 50.0% |
| 3-Person Household | 3 | 8.3% |
| 4+ Person Household | 0 | 0.0% |
| Total Housing Units | 36 | 100.0% |
Occupancy by Ownership by Household Size in Clawson
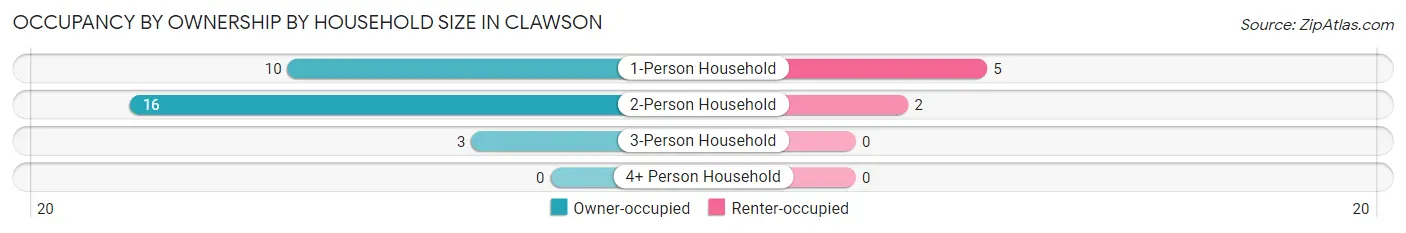
| Household Size | Owner-occupied | Renter-occupied |
| 1-Person Household | 10 (66.7%) | 5 (33.3%) |
| 2-Person Household | 16 (88.9%) | 2 (11.1%) |
| 3-Person Household | 3 (100.0%) | 0 (0.0%) |
| 4+ Person Household | 0 (0.0%) | 0 (0.0%) |
| Total Housing Units | 29 (80.6%) | 7 (19.4%) |
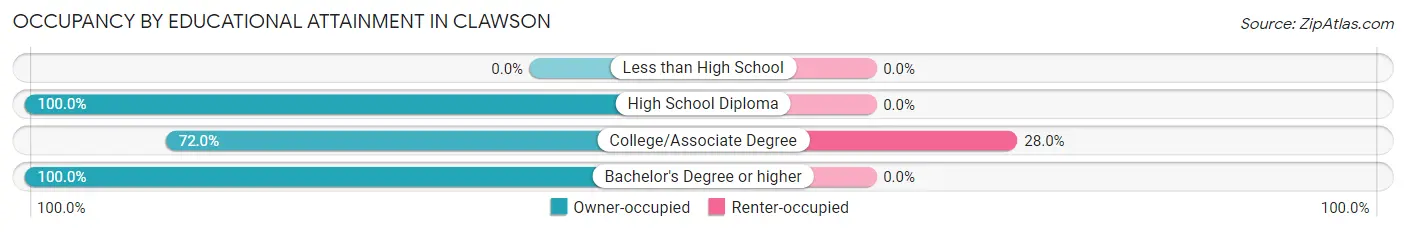
Occupancy by Educational Attainment in Clawson
| Household Size | Owner-occupied | Renter-occupied |
| Less than High School | 0 (0.0%) | 0 (0.0%) |
| High School Diploma | 4 (100.0%) | 0 (0.0%) |
| College/Associate Degree | 18 (72.0%) | 7 (28.0%) |
| Bachelor's Degree or higher | 7 (100.0%) | 0 (0.0%) |
Occupancy by Age of Householder in Clawson
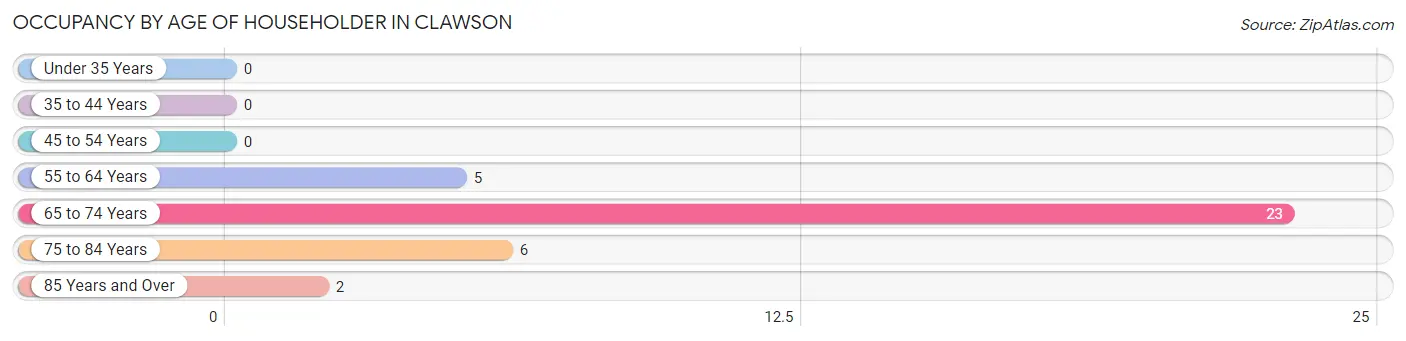
| Age Bracket | # Households | % Households |
| Under 35 Years | 0 | 0.0% |
| 35 to 44 Years | 0 | 0.0% |
| 45 to 54 Years | 0 | 0.0% |
| 55 to 64 Years | 5 | 13.9% |
| 65 to 74 Years | 23 | 63.9% |
| 75 to 84 Years | 6 | 16.7% |
| 85 Years and Over | 2 | 5.6% |
| Total | 36 | 100.0% |
Housing Finances in Clawson
Median Income by Occupancy in Clawson
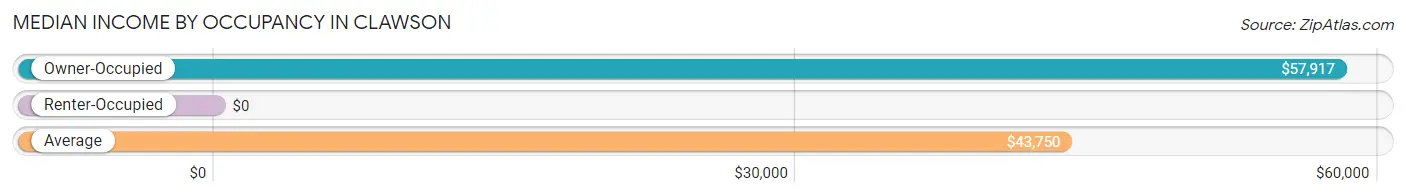
| Occupancy Type | # Households | Median Income |
| Owner-Occupied | 29 (80.6%) | $57,917 |
| Renter-Occupied | 7 (19.4%) | $0 |
| Average | 36 (100.0%) | $43,750 |
Occupancy by Householder Income Bracket in Clawson
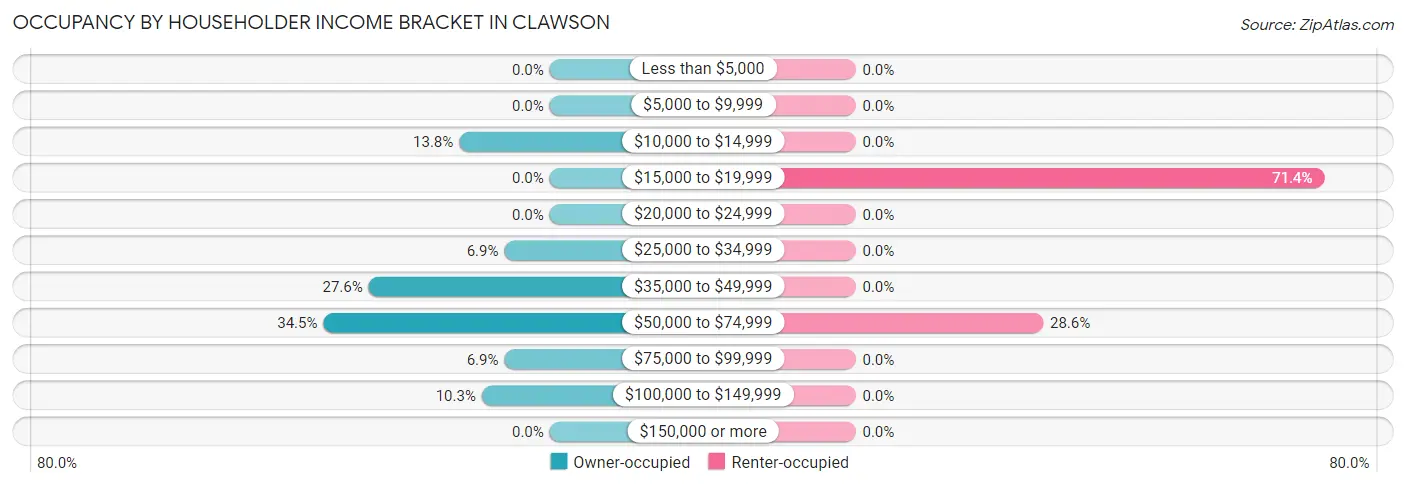
| Income Bracket | Owner-occupied | Renter-occupied |
| Less than $5,000 | 0 (0.0%) | 0 (0.0%) |
| $5,000 to $9,999 | 0 (0.0%) | 0 (0.0%) |
| $10,000 to $14,999 | 4 (13.8%) | 0 (0.0%) |
| $15,000 to $19,999 | 0 (0.0%) | 5 (71.4%) |
| $20,000 to $24,999 | 0 (0.0%) | 0 (0.0%) |
| $25,000 to $34,999 | 2 (6.9%) | 0 (0.0%) |
| $35,000 to $49,999 | 8 (27.6%) | 0 (0.0%) |
| $50,000 to $74,999 | 10 (34.5%) | 2 (28.6%) |
| $75,000 to $99,999 | 2 (6.9%) | 0 (0.0%) |
| $100,000 to $149,999 | 3 (10.3%) | 0 (0.0%) |
| $150,000 or more | 0 (0.0%) | 0 (0.0%) |
| Total | 29 (100.0%) | 7 (100.0%) |
Monthly Housing Cost Tiers in Clawson
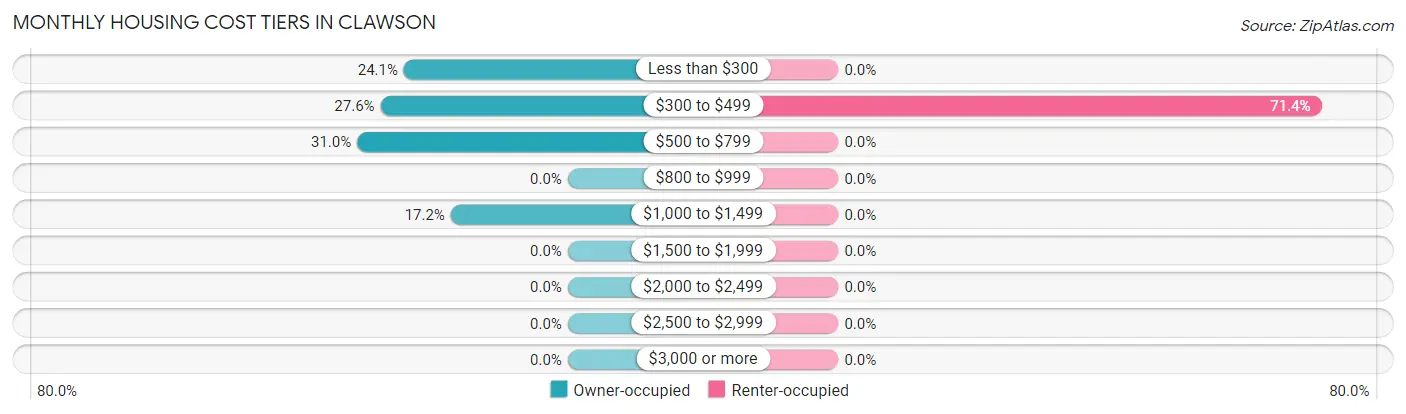
| Monthly Cost | Owner-occupied | Renter-occupied |
| Less than $300 | 7 (24.1%) | 0 (0.0%) |
| $300 to $499 | 8 (27.6%) | 5 (71.4%) |
| $500 to $799 | 9 (31.0%) | 0 (0.0%) |
| $800 to $999 | 0 (0.0%) | 0 (0.0%) |
| $1,000 to $1,499 | 5 (17.2%) | 0 (0.0%) |
| $1,500 to $1,999 | 0 (0.0%) | 0 (0.0%) |
| $2,000 to $2,499 | 0 (0.0%) | 0 (0.0%) |
| $2,500 to $2,999 | 0 (0.0%) | 0 (0.0%) |
| $3,000 or more | 0 (0.0%) | 0 (0.0%) |
| Total | 29 (100.0%) | 7 (100.0%) |
Physical Housing Characteristics in Clawson
Housing Structures in Clawson
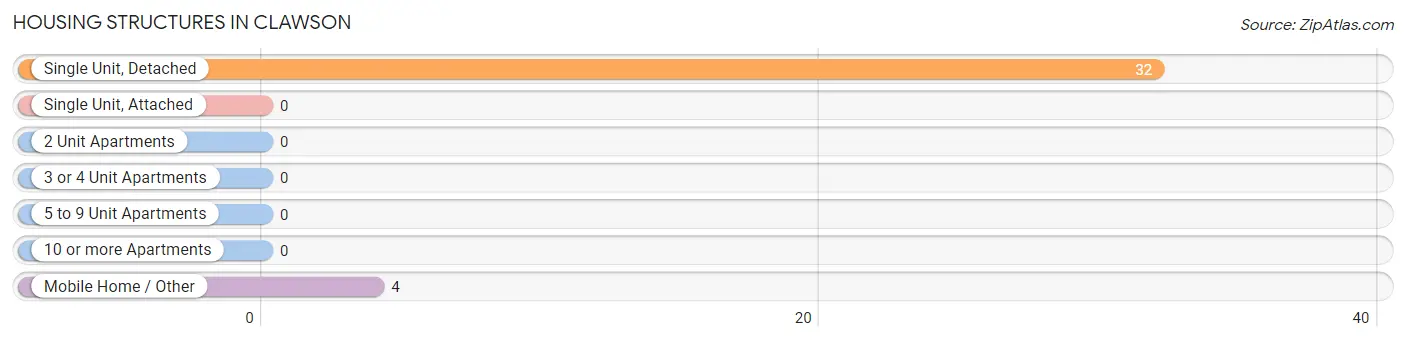
| Structure Type | # Housing Units | % Housing Units |
| Single Unit, Detached | 32 | 88.9% |
| Single Unit, Attached | 0 | 0.0% |
| 2 Unit Apartments | 0 | 0.0% |
| 3 or 4 Unit Apartments | 0 | 0.0% |
| 5 to 9 Unit Apartments | 0 | 0.0% |
| 10 or more Apartments | 0 | 0.0% |
| Mobile Home / Other | 4 | 11.1% |
| Total | 36 | 100.0% |
Housing Structures by Occupancy in Clawson
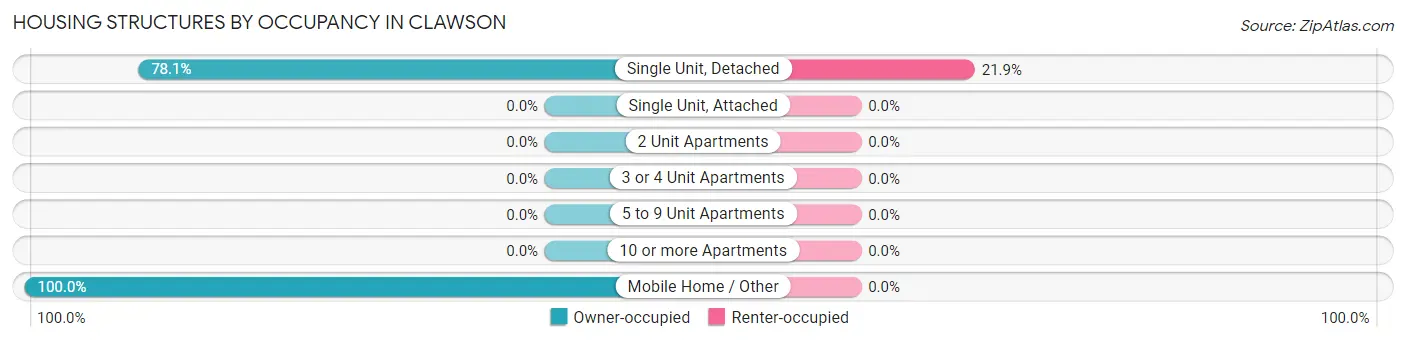
| Structure Type | Owner-occupied | Renter-occupied |
| Single Unit, Detached | 25 (78.1%) | 7 (21.9%) |
| Single Unit, Attached | 0 (0.0%) | 0 (0.0%) |
| 2 Unit Apartments | 0 (0.0%) | 0 (0.0%) |
| 3 or 4 Unit Apartments | 0 (0.0%) | 0 (0.0%) |
| 5 to 9 Unit Apartments | 0 (0.0%) | 0 (0.0%) |
| 10 or more Apartments | 0 (0.0%) | 0 (0.0%) |
| Mobile Home / Other | 4 (100.0%) | 0 (0.0%) |
| Total | 29 (80.6%) | 7 (19.4%) |
Housing Structures by Number of Rooms in Clawson
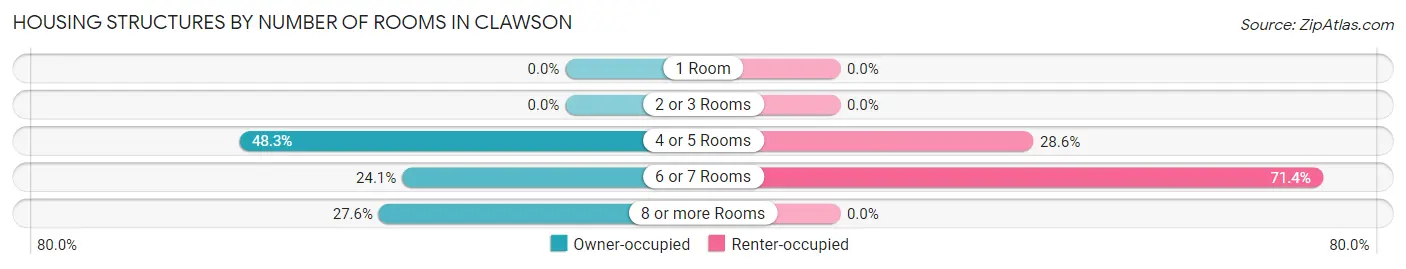
| Number of Rooms | Owner-occupied | Renter-occupied |
| 1 Room | 0 (0.0%) | 0 (0.0%) |
| 2 or 3 Rooms | 0 (0.0%) | 0 (0.0%) |
| 4 or 5 Rooms | 14 (48.3%) | 2 (28.6%) |
| 6 or 7 Rooms | 7 (24.1%) | 5 (71.4%) |
| 8 or more Rooms | 8 (27.6%) | 0 (0.0%) |
| Total | 29 (100.0%) | 7 (100.0%) |
Housing Structure by Heating Type in Clawson
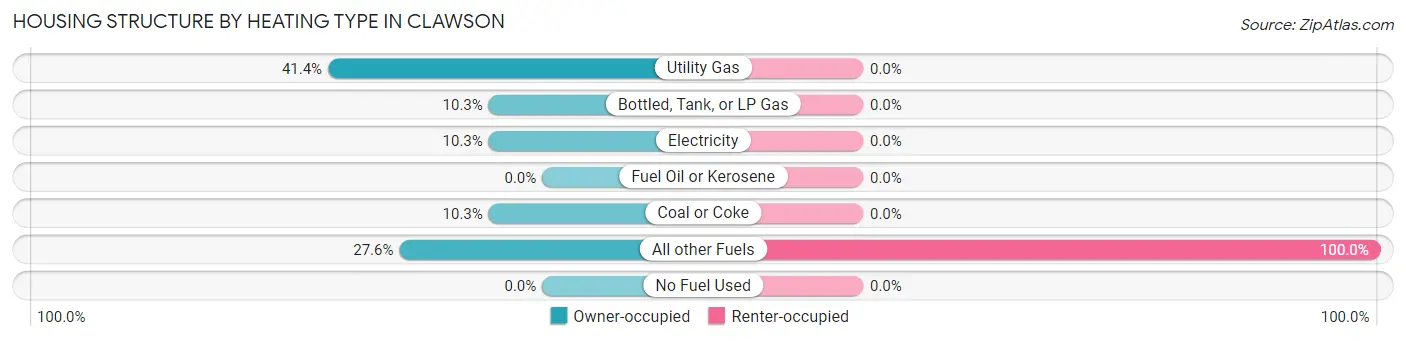
| Heating Type | Owner-occupied | Renter-occupied |
| Utility Gas | 12 (41.4%) | 0 (0.0%) |
| Bottled, Tank, or LP Gas | 3 (10.3%) | 0 (0.0%) |
| Electricity | 3 (10.3%) | 0 (0.0%) |
| Fuel Oil or Kerosene | 0 (0.0%) | 0 (0.0%) |
| Coal or Coke | 3 (10.3%) | 0 (0.0%) |
| All other Fuels | 8 (27.6%) | 7 (100.0%) |
| No Fuel Used | 0 (0.0%) | 0 (0.0%) |
| Total | 29 (100.0%) | 7 (100.0%) |
Household Vehicle Usage in Clawson
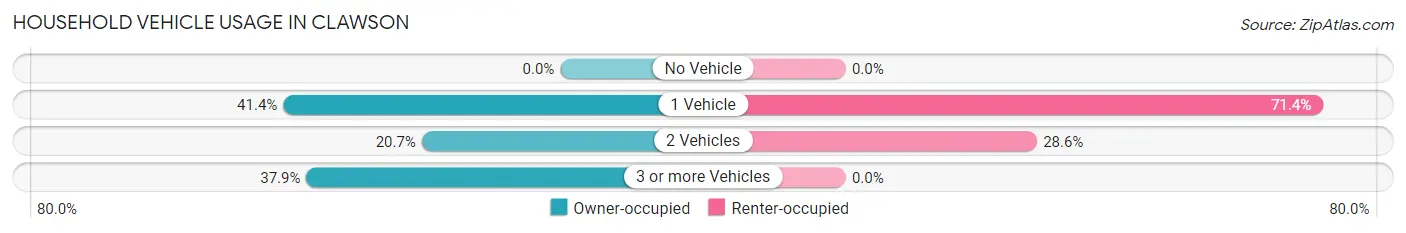
| Vehicles per Household | Owner-occupied | Renter-occupied |
| No Vehicle | 0 (0.0%) | 0 (0.0%) |
| 1 Vehicle | 12 (41.4%) | 5 (71.4%) |
| 2 Vehicles | 6 (20.7%) | 2 (28.6%) |
| 3 or more Vehicles | 11 (37.9%) | 0 (0.0%) |
| Total | 29 (100.0%) | 7 (100.0%) |
Real Estate & Mortgages in Clawson
Real Estate and Mortgage Overview in Clawson
| Characteristic | Without Mortgage | With Mortgage |
| Housing Units | 19 | 10 |
| Median Property Value | $170,800 | $179,200 |
| Median Household Income | $61,563 | $0 |
| Monthly Housing Costs | $342 | $0 |
| Real Estate Taxes | $925 | $0 |
Property Value by Mortgage Status in Clawson
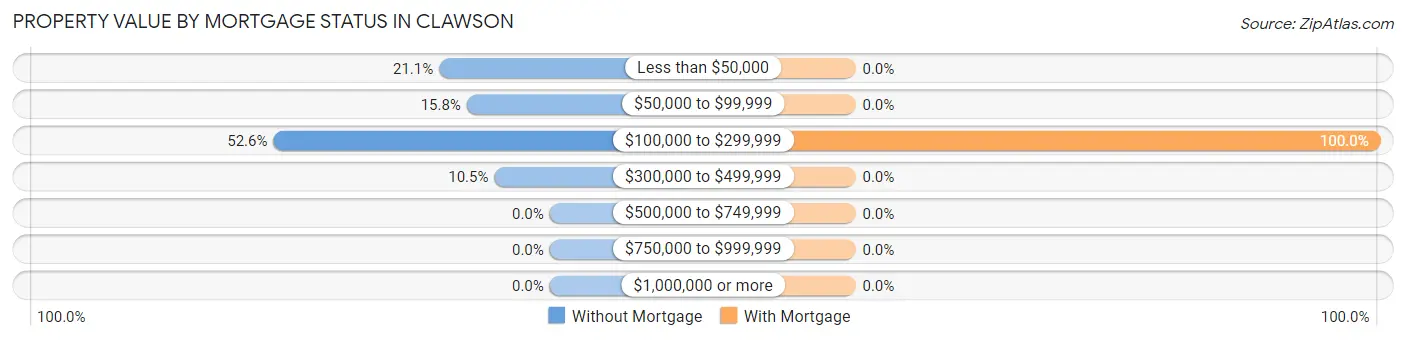
| Property Value | Without Mortgage | With Mortgage |
| Less than $50,000 | 4 (21.0%) | 0 (0.0%) |
| $50,000 to $99,999 | 3 (15.8%) | 0 (0.0%) |
| $100,000 to $299,999 | 10 (52.6%) | 10 (100.0%) |
| $300,000 to $499,999 | 2 (10.5%) | 0 (0.0%) |
| $500,000 to $749,999 | 0 (0.0%) | 0 (0.0%) |
| $750,000 to $999,999 | 0 (0.0%) | 0 (0.0%) |
| $1,000,000 or more | 0 (0.0%) | 0 (0.0%) |
| Total | 19 (100.0%) | 10 (100.0%) |
Household Income by Mortgage Status in Clawson
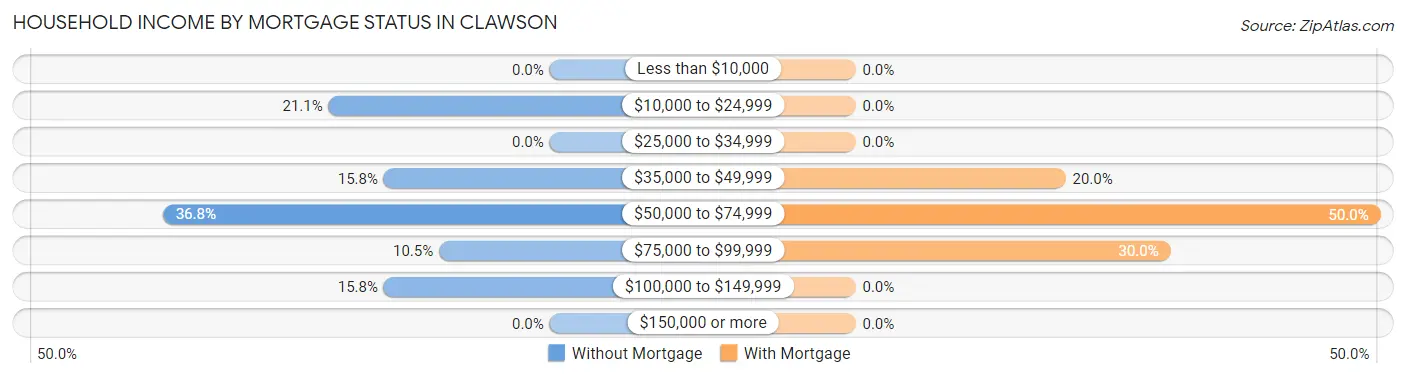
| Household Income | Without Mortgage | With Mortgage |
| Less than $10,000 | 0 (0.0%) | 0 (0.0%) |
| $10,000 to $24,999 | 4 (21.0%) | 0 (0.0%) |
| $25,000 to $34,999 | 0 (0.0%) | 0 (0.0%) |
| $35,000 to $49,999 | 3 (15.8%) | 2 (20.0%) |
| $50,000 to $74,999 | 7 (36.8%) | 5 (50.0%) |
| $75,000 to $99,999 | 2 (10.5%) | 3 (30.0%) |
| $100,000 to $149,999 | 3 (15.8%) | 0 (0.0%) |
| $150,000 or more | 0 (0.0%) | 0 (0.0%) |
| Total | 19 (100.0%) | 10 (100.0%) |
Property Value to Household Income Ratio in Clawson
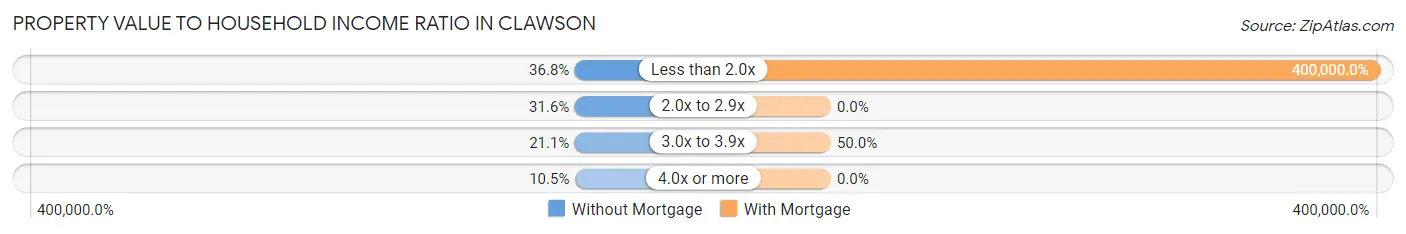
| Value-to-Income Ratio | Without Mortgage | With Mortgage |
| Less than 2.0x | 7 (36.8%) | 40,000 (400,000.0%) |
| 2.0x to 2.9x | 6 (31.6%) | 0 (0.0%) |
| 3.0x to 3.9x | 4 (21.0%) | 5 (50.0%) |
| 4.0x or more | 2 (10.5%) | 0 (0.0%) |
| Total | 19 (100.0%) | 10 (100.0%) |
Real Estate Taxes by Mortgage Status in Clawson
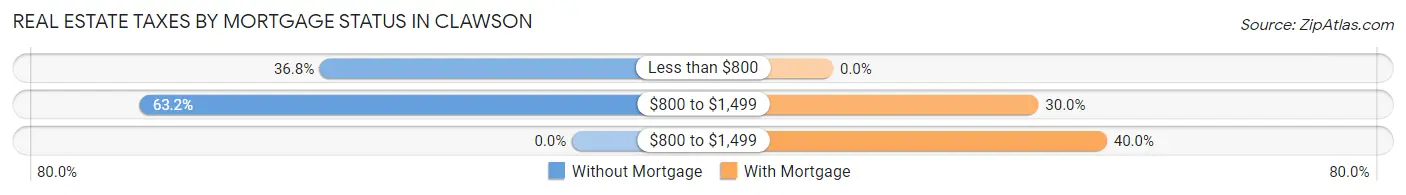
| Property Taxes | Without Mortgage | With Mortgage |
| Less than $800 | 7 (36.8%) | 0 (0.0%) |
| $800 to $1,499 | 12 (63.2%) | 3 (30.0%) |
| $800 to $1,499 | 0 (0.0%) | 4 (40.0%) |
| Total | 19 (100.0%) | 10 (100.0%) |
Health & Disability in Clawson
Health Insurance Coverage by Age in Clawson
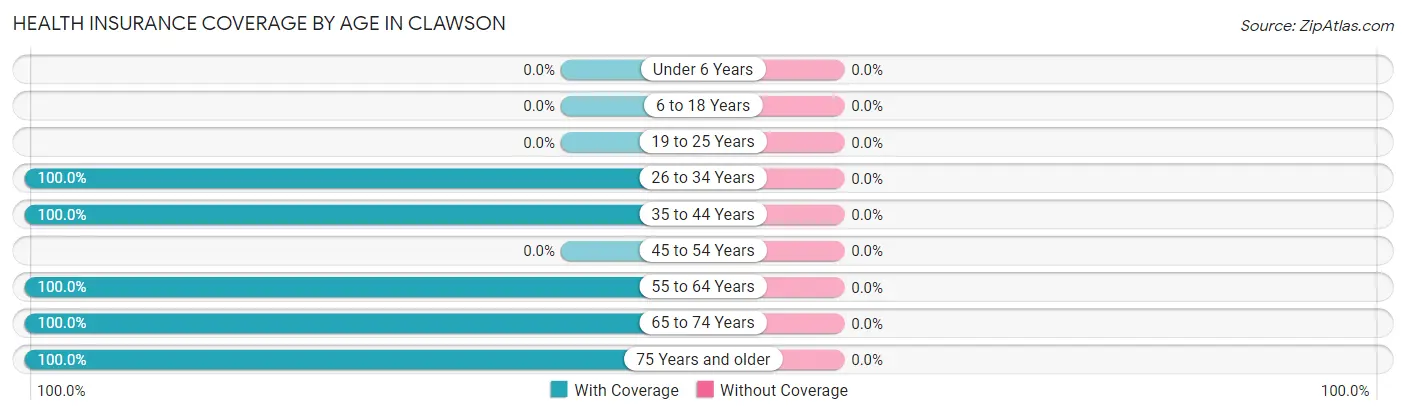
| Age Bracket | With Coverage | Without Coverage |
| Under 6 Years | 0 (0.0%) | 0 (0.0%) |
| 6 to 18 Years | 0 (0.0%) | 0 (0.0%) |
| 19 to 25 Years | 0 (0.0%) | 0 (0.0%) |
| 26 to 34 Years | 5 (100.0%) | 0 (0.0%) |
| 35 to 44 Years | 2 (100.0%) | 0 (0.0%) |
| 45 to 54 Years | 0 (0.0%) | 0 (0.0%) |
| 55 to 64 Years | 10 (100.0%) | 0 (0.0%) |
| 65 to 74 Years | 30 (100.0%) | 0 (0.0%) |
| 75 Years and older | 14 (100.0%) | 0 (0.0%) |
| Total | 61 (100.0%) | 0 (0.0%) |
Health Insurance Coverage by Citizenship Status in Clawson
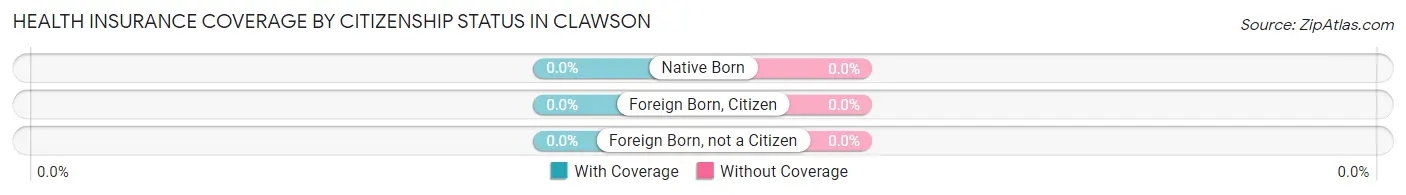
| Citizenship Status | With Coverage | Without Coverage |
| Native Born | 0 (0.0%) | 0 (0.0%) |
| Foreign Born, Citizen | 0 (0.0%) | 0 (0.0%) |
| Foreign Born, not a Citizen | 0 (0.0%) | 0 (0.0%) |
Health Insurance Coverage by Household Income in Clawson
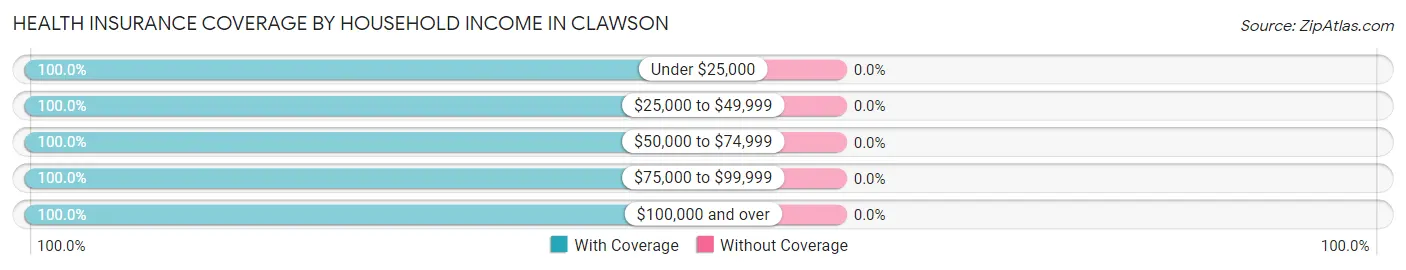
| Household Income | With Coverage | Without Coverage |
| Under $25,000 | 9 (100.0%) | 0 (0.0%) |
| $25,000 to $49,999 | 13 (100.0%) | 0 (0.0%) |
| $50,000 to $74,999 | 29 (100.0%) | 0 (0.0%) |
| $75,000 to $99,999 | 4 (100.0%) | 0 (0.0%) |
| $100,000 and over | 6 (100.0%) | 0 (0.0%) |
Public vs Private Health Insurance Coverage by Age in Clawson
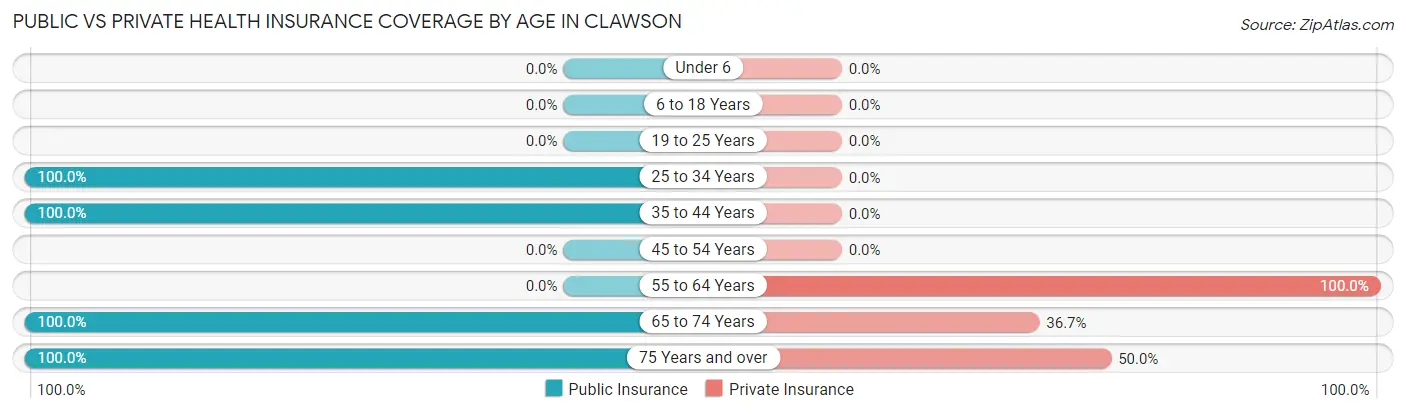
| Age Bracket | Public Insurance | Private Insurance |
| Under 6 | 0 (0.0%) | 0 (0.0%) |
| 6 to 18 Years | 0 (0.0%) | 0 (0.0%) |
| 19 to 25 Years | 0 (0.0%) | 0 (0.0%) |
| 25 to 34 Years | 5 (100.0%) | 0 (0.0%) |
| 35 to 44 Years | 2 (100.0%) | 0 (0.0%) |
| 45 to 54 Years | 0 (0.0%) | 0 (0.0%) |
| 55 to 64 Years | 0 (0.0%) | 10 (100.0%) |
| 65 to 74 Years | 30 (100.0%) | 11 (36.7%) |
| 75 Years and over | 14 (100.0%) | 7 (50.0%) |
| Total | 51 (83.6%) | 28 (45.9%) |
Disability Status by Sex by Age in Clawson
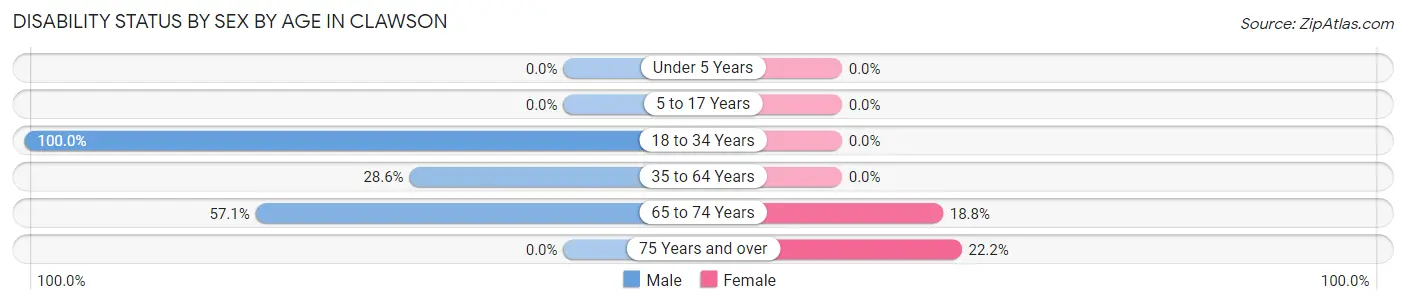
| Age Bracket | Male | Female |
| Under 5 Years | 0 (0.0%) | 0 (0.0%) |
| 5 to 17 Years | 0 (0.0%) | 0 (0.0%) |
| 18 to 34 Years | 5 (100.0%) | 0 (0.0%) |
| 35 to 64 Years | 2 (28.6%) | 0 (0.0%) |
| 65 to 74 Years | 8 (57.1%) | 3 (18.8%) |
| 75 Years and over | 0 (0.0%) | 2 (22.2%) |
Disability Class by Sex by Age in Clawson
Disability Class: Hearing Difficulty
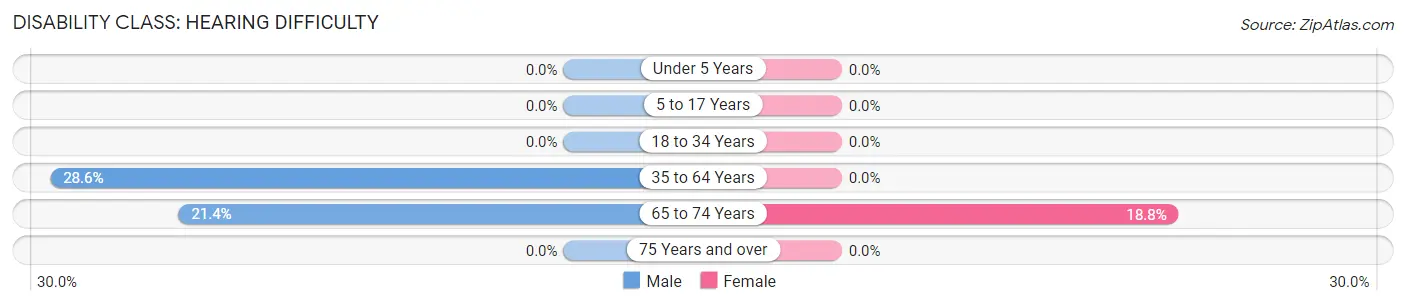
| Age Bracket | Male | Female |
| Under 5 Years | 0 (0.0%) | 0 (0.0%) |
| 5 to 17 Years | 0 (0.0%) | 0 (0.0%) |
| 18 to 34 Years | 0 (0.0%) | 0 (0.0%) |
| 35 to 64 Years | 2 (28.6%) | 0 (0.0%) |
| 65 to 74 Years | 3 (21.4%) | 3 (18.8%) |
| 75 Years and over | 0 (0.0%) | 0 (0.0%) |
Disability Class: Vision Difficulty
| Age Bracket | Male | Female |
| Under 5 Years | 0 (0.0%) | 0 (0.0%) |
| 5 to 17 Years | 0 (0.0%) | 0 (0.0%) |
| 18 to 34 Years | 0 (0.0%) | 0 (0.0%) |
| 35 to 64 Years | 0 (0.0%) | 0 (0.0%) |
| 65 to 74 Years | 0 (0.0%) | 0 (0.0%) |
| 75 Years and over | 0 (0.0%) | 0 (0.0%) |
Disability Class: Cognitive Difficulty
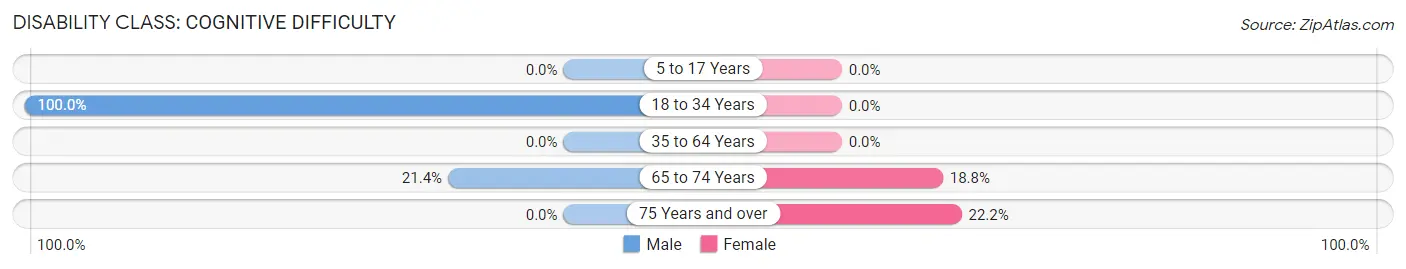
| Age Bracket | Male | Female |
| 5 to 17 Years | 0 (0.0%) | 0 (0.0%) |
| 18 to 34 Years | 5 (100.0%) | 0 (0.0%) |
| 35 to 64 Years | 0 (0.0%) | 0 (0.0%) |
| 65 to 74 Years | 3 (21.4%) | 3 (18.8%) |
| 75 Years and over | 0 (0.0%) | 2 (22.2%) |
Disability Class: Ambulatory Difficulty
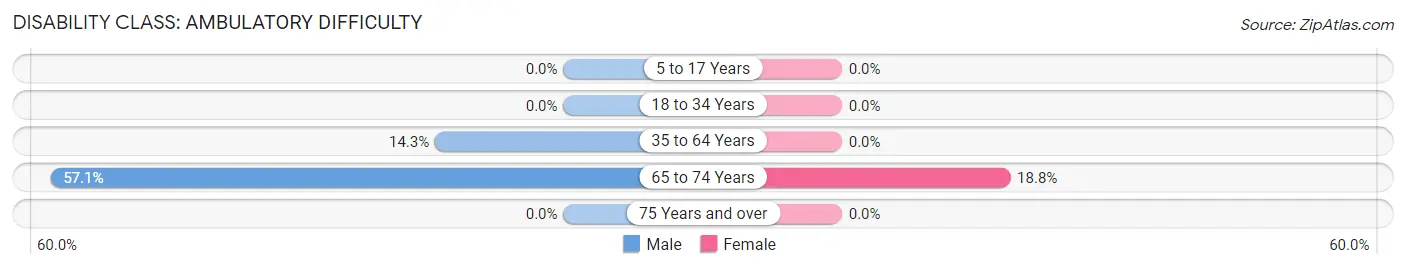
| Age Bracket | Male | Female |
| 5 to 17 Years | 0 (0.0%) | 0 (0.0%) |
| 18 to 34 Years | 0 (0.0%) | 0 (0.0%) |
| 35 to 64 Years | 1 (14.3%) | 0 (0.0%) |
| 65 to 74 Years | 8 (57.1%) | 3 (18.8%) |
| 75 Years and over | 0 (0.0%) | 0 (0.0%) |
Disability Class: Self-Care Difficulty
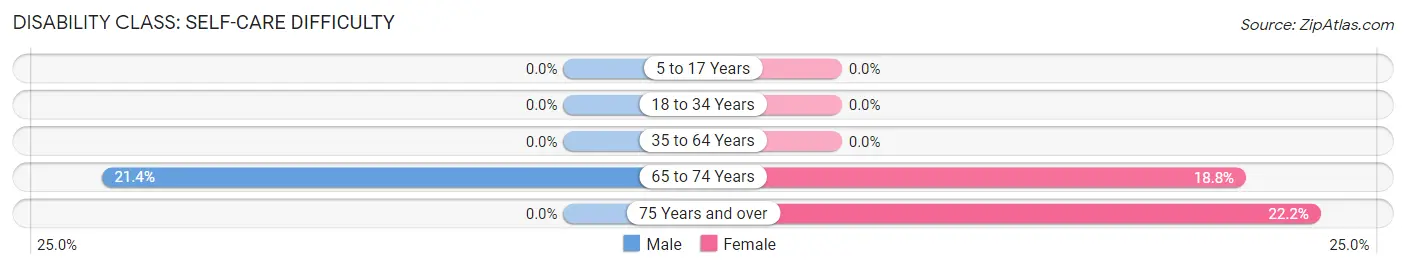
| Age Bracket | Male | Female |
| 5 to 17 Years | 0 (0.0%) | 0 (0.0%) |
| 18 to 34 Years | 0 (0.0%) | 0 (0.0%) |
| 35 to 64 Years | 0 (0.0%) | 0 (0.0%) |
| 65 to 74 Years | 3 (21.4%) | 3 (18.8%) |
| 75 Years and over | 0 (0.0%) | 2 (22.2%) |
Technology Access in Clawson
Computing Device Access in Clawson
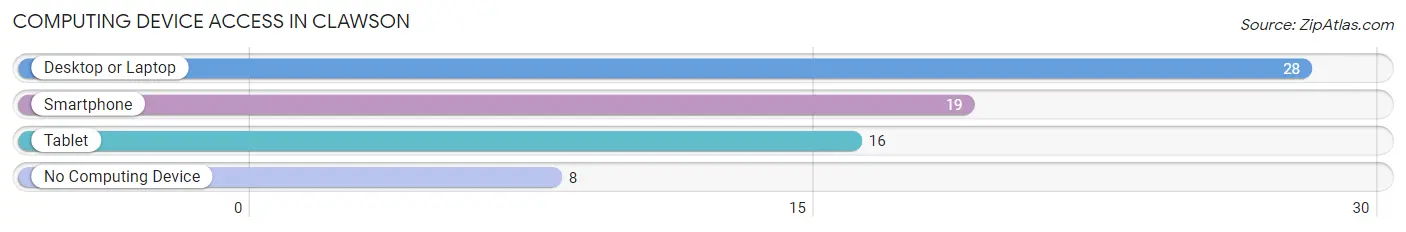
| Device Type | # Households | % Households |
| Desktop or Laptop | 28 | 77.8% |
| Smartphone | 19 | 52.8% |
| Tablet | 16 | 44.4% |
| No Computing Device | 8 | 22.2% |
| Total | 36 | 100.0% |
Internet Access in Clawson
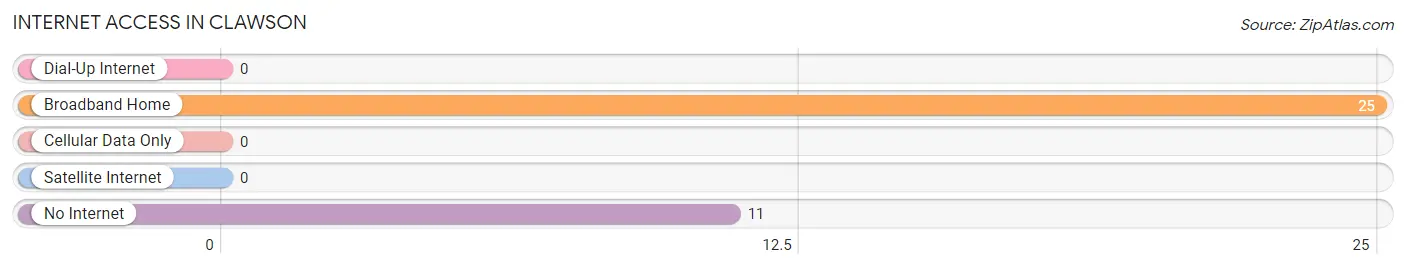
| Internet Type | # Households | % Households |
| Dial-Up Internet | 0 | 0.0% |
| Broadband Home | 25 | 69.4% |
| Cellular Data Only | 0 | 0.0% |
| Satellite Internet | 0 | 0.0% |
| No Internet | 11 | 30.6% |
| Total | 36 | 100.0% |
Clawson Summary
Clawson, Utah is a small town located in Emery County, Utah. It is situated in the San Rafael Swell, a large geological formation in the southeastern part of the state. The town was founded in 1883 by a group of Mormon settlers and was named after one of the settlers, John Clawson. The town has a population of approximately 200 people and is located at an elevation of 5,400 feet.
Geography
Clawson is located in the San Rafael Swell, a large geological formation in the southeastern part of the state. The town is situated in a valley surrounded by high desert hills and mountains. The area is known for its rugged terrain and spectacular views. The town is located at an elevation of 5,400 feet and is approximately 30 miles from the nearest major city, Price.
Economy
The economy of Clawson is largely based on agriculture and ranching. The town is home to several farms and ranches, which produce a variety of crops and livestock. The town also has a small retail sector, with a few stores and restaurants. The town is also home to a few small businesses, such as a gas station and a post office.
Demographics
As of the 2010 census, the population of Clawson was 200 people. The racial makeup of the town was 97.5% White, 0.5% Native American, 0.5% Asian, and 1.5% from two or more races. The median age of the population was 44.5 years. The median household income was $37,500 and the median family income was $41,250.
History
Clawson was founded in 1883 by a group of Mormon settlers. The town was named after one of the settlers, John Clawson. The town was originally a farming and ranching community, and the settlers built a small church and school. The town grew slowly over the years, and by the early 1900s, it had a population of around 200 people.
In the early 1900s, the town was a popular stop for travelers on the Denver and Rio Grande Western Railroad. The railroad provided a vital link to the outside world and helped the town to grow and prosper. The town also had a post office, a bank, and several stores.
In the 1950s, the town began to decline as the railroad stopped running and the population began to move away. The town has remained small and relatively unchanged since then. Today, Clawson is a quiet, rural town with a population of around 200 people.
Common Questions
What is Per Capita Income in Clawson?
Per Capita income in Clawson is $27,716.
What is the Median Family Income in Clawson?
Median Family Income in Clawson is $60,938.
What is the Median Household income in Clawson?
Median Household Income in Clawson is $43,750.
What is Inequality or Gini Index in Clawson?
Inequality or Gini Index in Clawson is 0.31.
What is the Total Population of Clawson?
Total Population of Clawson is 61.
What is the Total Male Population of Clawson?
Total Male Population of Clawson is 31.
What is the Total Female Population of Clawson?
Total Female Population of Clawson is 30.
What is the Ratio of Males per 100 Females in Clawson?
There are 103.33 Males per 100 Females in Clawson.
What is the Ratio of Females per 100 Males in Clawson?
There are 96.77 Females per 100 Males in Clawson.
What is the Median Population Age in Clawson?
Median Population Age in Clawson is 67.9 Years.
What is the Average Family Size in Clawson
Average Family Size in Clawson is 2.2 People.
What is the Average Household Size in Clawson
Average Household Size in Clawson is 1.7 People.
How Large is the Labor Force in Clawson?
There are 13 People in the Labor Forcein in Clawson.
What is the Percentage of People in the Labor Force in Clawson?
21.3% of People are in the Labor Force in Clawson.