Altamont, UT Map & Demographics
Altamont Map
Altamont Overview
$20,352
PER CAPITA INCOME
$92,273
AVG FAMILY INCOME
$91,250
AVG HOUSEHOLD INCOME
$10,200
FAMILY INCOME DEFICIT
0.29
INEQUALITY / GINI INDEX
434
TOTAL POPULATION
184
MALE POPULATION
250
FEMALE POPULATION
73.60
MALES / 100 FEMALES
135.87
FEMALES / 100 MALES
23.5
MEDIAN AGE
5.7
AVG FAMILY SIZE
4.6
AVG HOUSEHOLD SIZE
166
LABOR FORCE [ PEOPLE ]
60.4%
PERCENT IN LABOR FORCE
5.4%
UNEMPLOYMENT RATE
Altamont Zip Codes
Altamont Area Codes
Income in Altamont
Income Overview in Altamont
Per Capita Income in Altamont is $20,352, while median incomes of families and households are $92,273 and $91,250 respectively.
| Characteristic | Number | Measure |
| Per Capita Income | 434 | $20,352 |
| Median Family Income | 72 | $92,273 |
| Mean Family Income | 72 | $95,518 |
| Median Household Income | 95 | $91,250 |
| Mean Household Income | 95 | $88,827 |
| Income Deficit | 72 | $10,200 |
| Wage / Income Gap (%) | 434 | 0.00% |
| Wage / Income Gap ($) | 434 | 100.00¢ per $1 |
| Gini / Inequality Index | 434 | 0.29 |
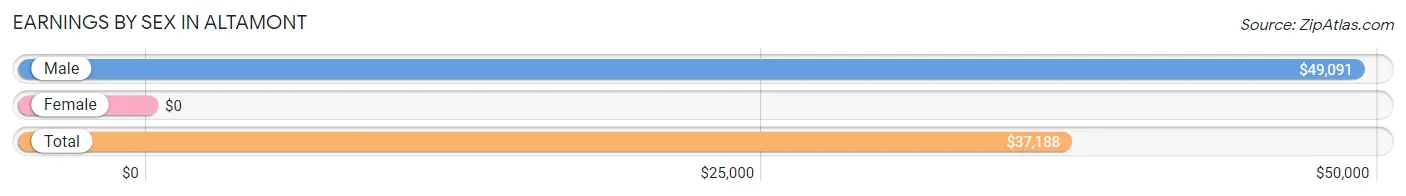
Earnings by Sex in Altamont
| Sex | Number | Average Earnings |
| Male | 100 (53.5%) | $49,091 |
| Female | 87 (46.5%) | $0 |
| Total | 187 (100.0%) | $37,188 |
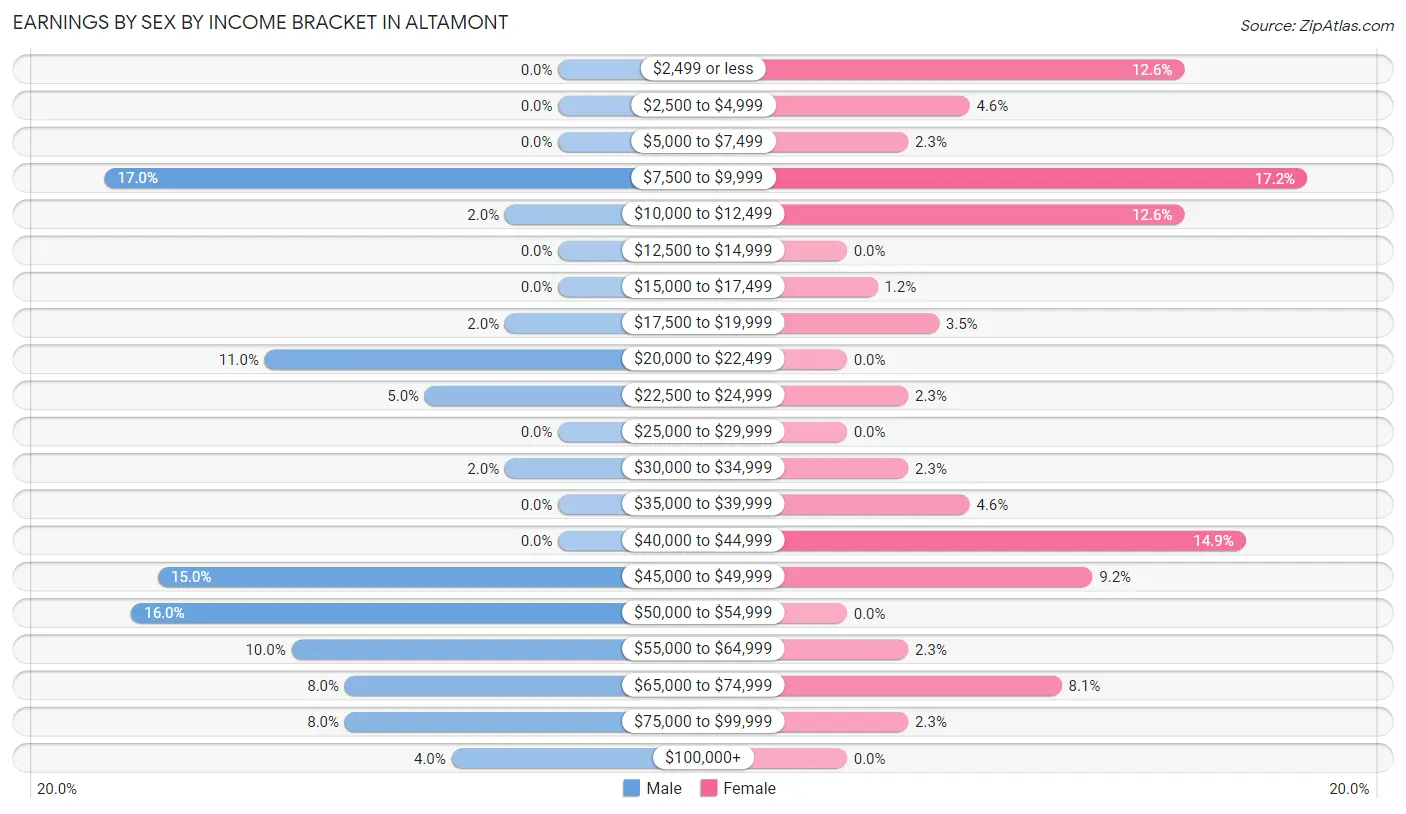
Earnings by Sex by Income Bracket in Altamont
The most common earnings brackets in Altamont are $7,500 to $9,999 for men (17 | 17.0%) and $7,500 to $9,999 for women (15 | 17.2%).
| Income | Male | Female |
| $2,499 or less | 0 (0.0%) | 11 (12.6%) |
| $2,500 to $4,999 | 0 (0.0%) | 4 (4.6%) |
| $5,000 to $7,499 | 0 (0.0%) | 2 (2.3%) |
| $7,500 to $9,999 | 17 (17.0%) | 15 (17.2%) |
| $10,000 to $12,499 | 2 (2.0%) | 11 (12.6%) |
| $12,500 to $14,999 | 0 (0.0%) | 0 (0.0%) |
| $15,000 to $17,499 | 0 (0.0%) | 1 (1.1%) |
| $17,500 to $19,999 | 2 (2.0%) | 3 (3.5%) |
| $20,000 to $22,499 | 11 (11.0%) | 0 (0.0%) |
| $22,500 to $24,999 | 5 (5.0%) | 2 (2.3%) |
| $25,000 to $29,999 | 0 (0.0%) | 0 (0.0%) |
| $30,000 to $34,999 | 2 (2.0%) | 2 (2.3%) |
| $35,000 to $39,999 | 0 (0.0%) | 4 (4.6%) |
| $40,000 to $44,999 | 0 (0.0%) | 13 (14.9%) |
| $45,000 to $49,999 | 15 (15.0%) | 8 (9.2%) |
| $50,000 to $54,999 | 16 (16.0%) | 0 (0.0%) |
| $55,000 to $64,999 | 10 (10.0%) | 2 (2.3%) |
| $65,000 to $74,999 | 8 (8.0%) | 7 (8.1%) |
| $75,000 to $99,999 | 8 (8.0%) | 2 (2.3%) |
| $100,000+ | 4 (4.0%) | 0 (0.0%) |
| Total | 100 (100.0%) | 87 (100.0%) |
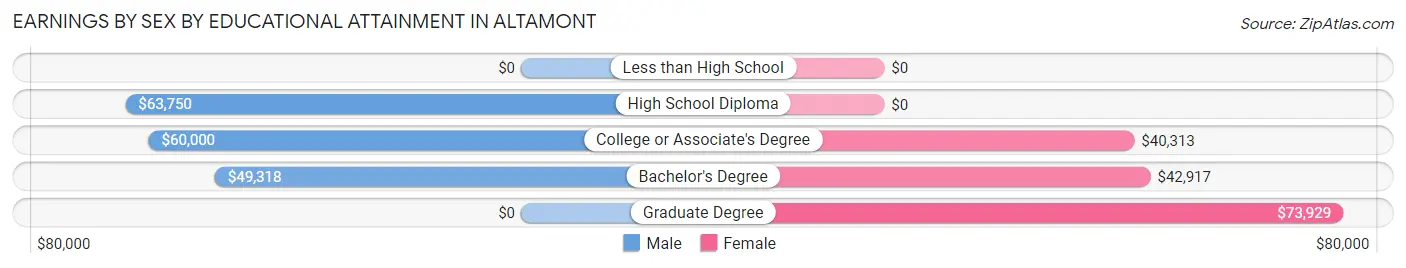
Earnings by Sex by Educational Attainment in Altamont
Average earnings in Altamont are $51,328 for men and $40,250 for women, a difference of 21.6%. Men with an educational attainment of high school diploma enjoy the highest average annual earnings of $63,750, while those with bachelor's degree education earn the least with $49,318. Women with an educational attainment of graduate degree earn the most with the average annual earnings of $73,929, while those with college or associate's degree education have the smallest earnings of $40,313.
| Educational Attainment | Male Income | Female Income |
| Less than High School | - | - |
| High School Diploma | $63,750 | $0 |
| College or Associate's Degree | $60,000 | $40,313 |
| Bachelor's Degree | $49,318 | $42,917 |
| Graduate Degree | - | - |
| Total | $51,328 | $40,250 |
Family Income in Altamont
Family Income Brackets in Altamont
According to the Altamont family income data, there are 22 families falling into the $100,000 to $149,999 income range, which is the most common income bracket and makes up 30.6% of all families. Conversely, the $10,000 to $14,999 income bracket is the least frequent group with only 1 families (1.4%) belonging to this category.
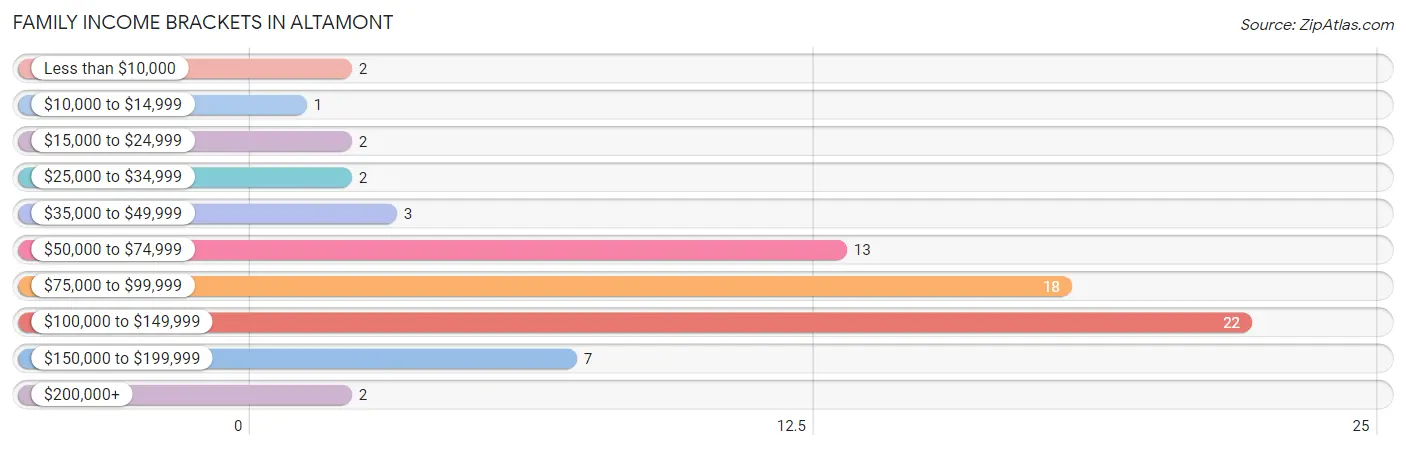
| Income Bracket | # Families | % Families |
| Less than $10,000 | 2 | 2.8% |
| $10,000 to $14,999 | 1 | 1.4% |
| $15,000 to $24,999 | 2 | 2.8% |
| $25,000 to $34,999 | 2 | 2.8% |
| $35,000 to $49,999 | 3 | 4.2% |
| $50,000 to $74,999 | 13 | 18.1% |
| $75,000 to $99,999 | 18 | 25.0% |
| $100,000 to $149,999 | 22 | 30.6% |
| $150,000 to $199,999 | 7 | 9.7% |
| $200,000+ | 2 | 2.8% |
Family Income by Famaliy Size in Altamont
4-person families (4 | 5.6%) account for the highest median family income in Altamont with $110,000 per family, while 2-person families (18 | 25.0%) have the highest median income of $45,625 per family member.
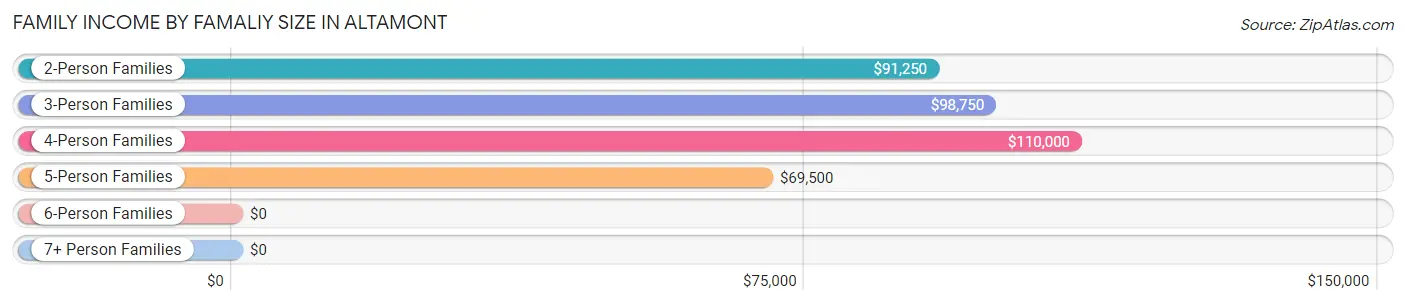
| Income Bracket | # Families | Median Income |
| 2-Person Families | 18 (25.0%) | $91,250 |
| 3-Person Families | 9 (12.5%) | $98,750 |
| 4-Person Families | 4 (5.6%) | $110,000 |
| 5-Person Families | 12 (16.7%) | $69,500 |
| 6-Person Families | 17 (23.6%) | $0 |
| 7+ Person Families | 12 (16.7%) | $0 |
| Total | 72 (100.0%) | $92,273 |
Family Income by Number of Earners in Altamont
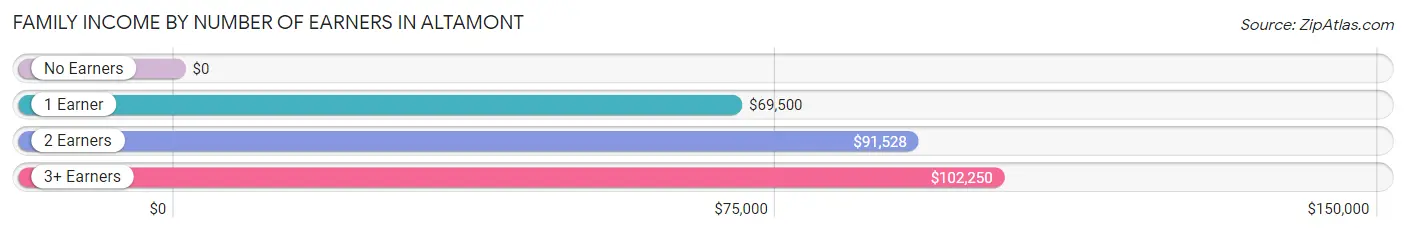
| Number of Earners | # Families | Median Income |
| No Earners | 5 (6.9%) | $0 |
| 1 Earner | 14 (19.4%) | $69,500 |
| 2 Earners | 33 (45.8%) | $91,528 |
| 3+ Earners | 20 (27.8%) | $102,250 |
| Total | 72 (100.0%) | $92,273 |
Household Income in Altamont
Household Income Brackets in Altamont
With 27 households falling in the category, the $100,000 to $149,999 income range is the most frequent in Altamont, accounting for 28.4% of all households. In contrast, only 2 households (2.1%) fall into the $10,000 to $14,999 income bracket, making it the least populous group.
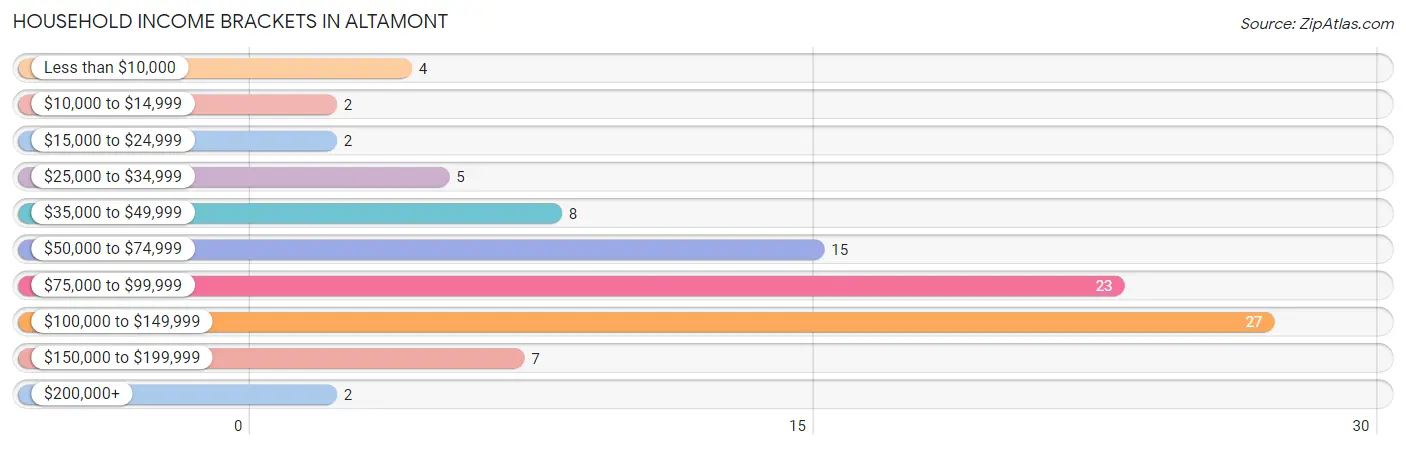
| Income Bracket | # Households | % Households |
| Less than $10,000 | 4 | 4.2% |
| $10,000 to $14,999 | 2 | 2.1% |
| $15,000 to $24,999 | 2 | 2.1% |
| $25,000 to $34,999 | 5 | 5.3% |
| $35,000 to $49,999 | 8 | 8.4% |
| $50,000 to $74,999 | 15 | 15.8% |
| $75,000 to $99,999 | 23 | 24.2% |
| $100,000 to $149,999 | 27 | 28.4% |
| $150,000 to $199,999 | 7 | 7.4% |
| $200,000+ | 2 | 2.1% |
Household Income by Householder Age in Altamont
The median household income in Altamont is $91,250, with the highest median household income of $93,750 found in the 45 to 64 years age bracket for the primary householder. A total of 36 households (37.9%) fall into this category. Meanwhile, the 15 to 24 years age bracket for the primary householder has the lowest median household income of $0, with 2 households (2.1%) in this group.
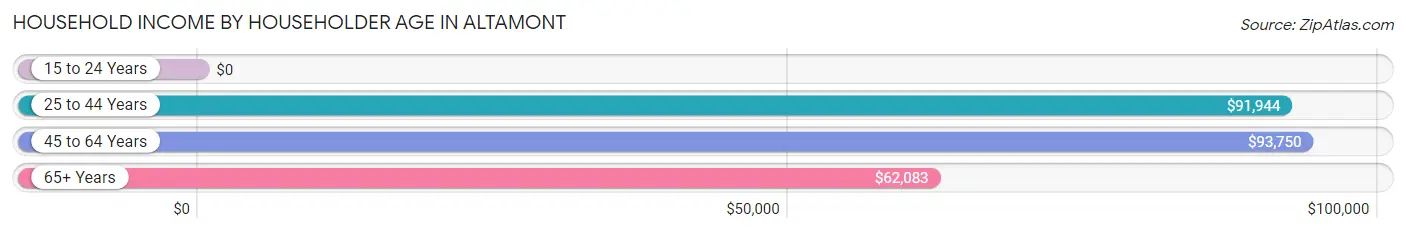
| Income Bracket | # Households | Median Income |
| 15 to 24 Years | 2 (2.1%) | $0 |
| 25 to 44 Years | 36 (37.9%) | $91,944 |
| 45 to 64 Years | 36 (37.9%) | $93,750 |
| 65+ Years | 21 (22.1%) | $62,083 |
| Total | 95 (100.0%) | $91,250 |
Poverty in Altamont
Income Below Poverty by Sex and Age in Altamont
With 6.5% poverty level for males and 3.2% for females among the residents of Altamont, 45 to 54 year old males and 65 to 74 year old females are the most vulnerable to poverty, with 5 males (22.7%) and 2 females (25.0%) in their respective age groups living below the poverty level.
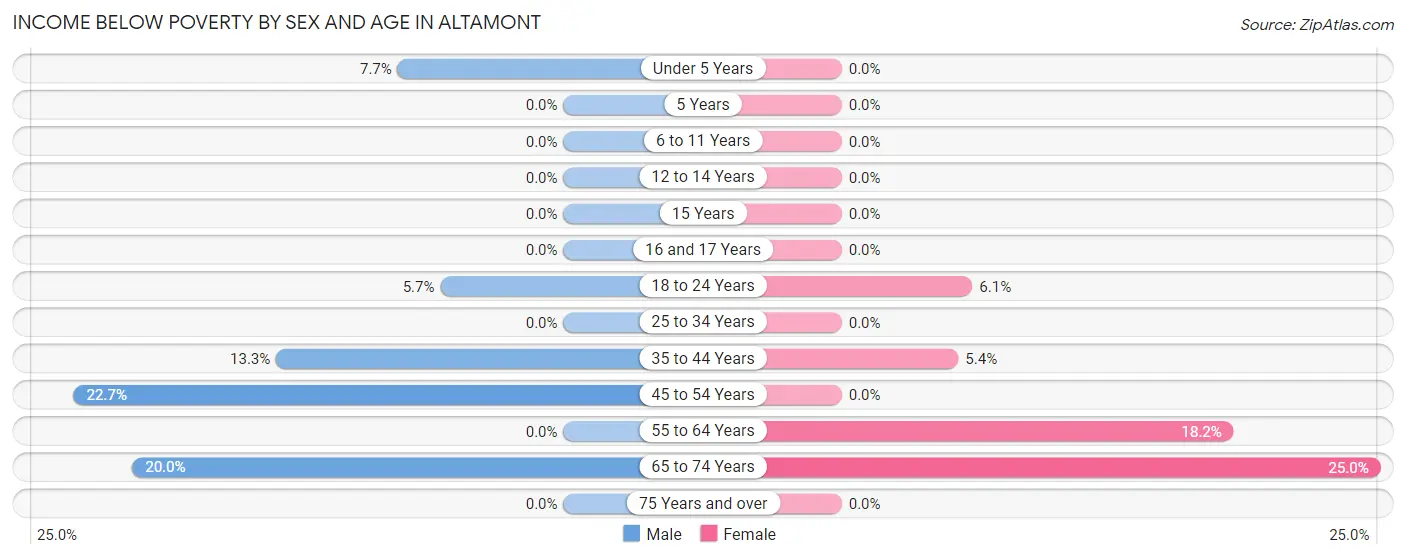
| Age Bracket | Male | Female |
| Under 5 Years | 2 (7.7%) | 0 (0.0%) |
| 5 Years | 0 (0.0%) | 0 (0.0%) |
| 6 to 11 Years | 0 (0.0%) | 0 (0.0%) |
| 12 to 14 Years | 0 (0.0%) | 0 (0.0%) |
| 15 Years | 0 (0.0%) | 0 (0.0%) |
| 16 and 17 Years | 0 (0.0%) | 0 (0.0%) |
| 18 to 24 Years | 2 (5.7%) | 2 (6.1%) |
| 25 to 34 Years | 0 (0.0%) | 0 (0.0%) |
| 35 to 44 Years | 2 (13.3%) | 2 (5.4%) |
| 45 to 54 Years | 5 (22.7%) | 0 (0.0%) |
| 55 to 64 Years | 0 (0.0%) | 2 (18.2%) |
| 65 to 74 Years | 1 (20.0%) | 2 (25.0%) |
| 75 Years and over | 0 (0.0%) | 0 (0.0%) |
| Total | 12 (6.5%) | 8 (3.2%) |
Income Above Poverty by Sex and Age in Altamont
According to the poverty statistics in Altamont, males aged 5 years and females aged under 5 years are the age groups that are most secure financially, with 100.0% of males and 100.0% of females in these age groups living above the poverty line.
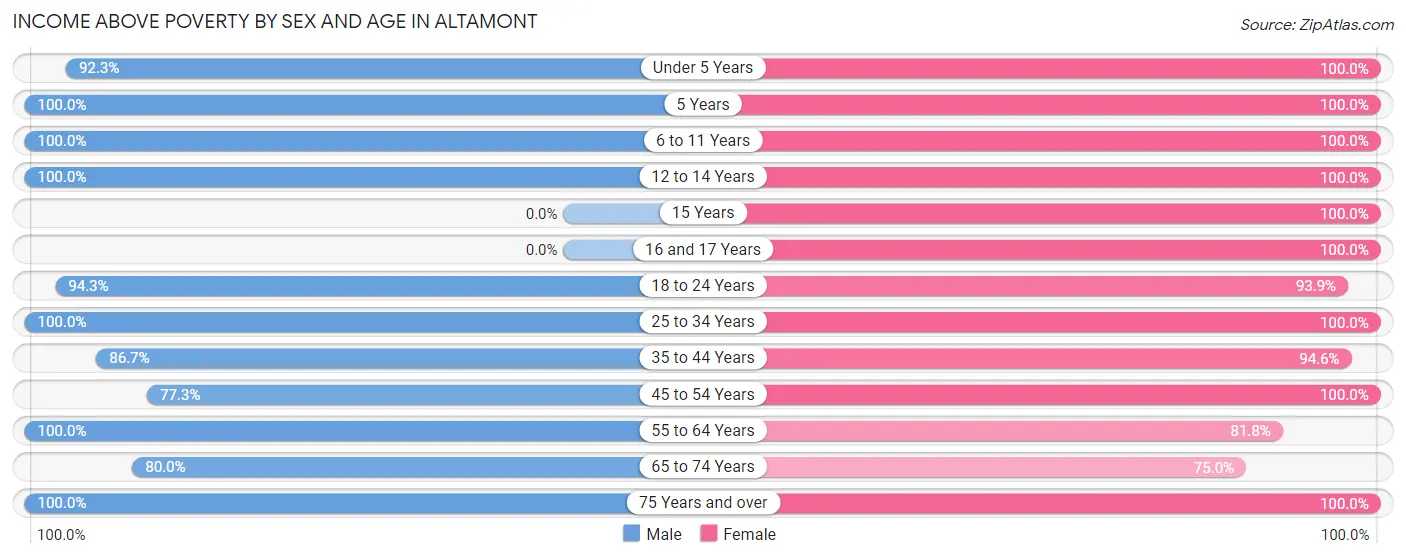
| Age Bracket | Male | Female |
| Under 5 Years | 24 (92.3%) | 23 (100.0%) |
| 5 Years | 7 (100.0%) | 22 (100.0%) |
| 6 to 11 Years | 20 (100.0%) | 36 (100.0%) |
| 12 to 14 Years | 4 (100.0%) | 7 (100.0%) |
| 15 Years | 0 (0.0%) | 14 (100.0%) |
| 16 and 17 Years | 0 (0.0%) | 9 (100.0%) |
| 18 to 24 Years | 33 (94.3%) | 31 (93.9%) |
| 25 to 34 Years | 36 (100.0%) | 19 (100.0%) |
| 35 to 44 Years | 13 (86.7%) | 35 (94.6%) |
| 45 to 54 Years | 17 (77.3%) | 18 (100.0%) |
| 55 to 64 Years | 12 (100.0%) | 9 (81.8%) |
| 65 to 74 Years | 4 (80.0%) | 6 (75.0%) |
| 75 Years and over | 2 (100.0%) | 13 (100.0%) |
| Total | 172 (93.5%) | 242 (96.8%) |
Income Below Poverty Among Married-Couple Families in Altamont
The poverty statistics for married-couple families in Altamont show that 7.6% or 5 of the total 66 families live below the poverty line. Families with no children have the highest poverty rate of 15.8%, comprising of 3 families. On the other hand, families with 3 or 4 children have the lowest poverty rate of 0.0%, which includes 0 families.
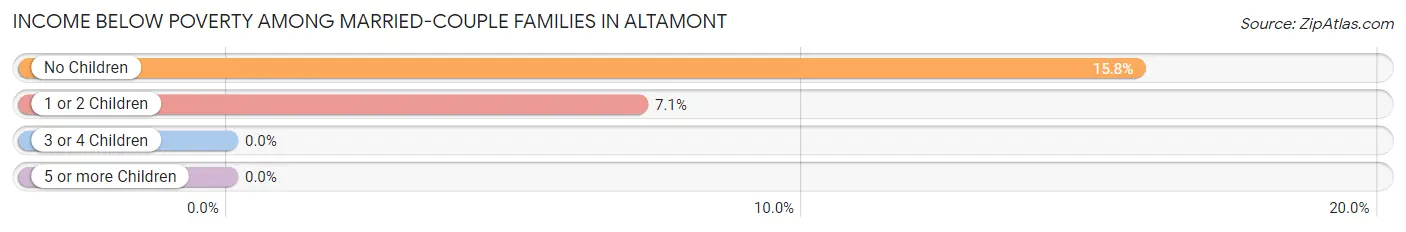
| Children | Above Poverty | Below Poverty |
| No Children | 16 (84.2%) | 3 (15.8%) |
| 1 or 2 Children | 26 (92.9%) | 2 (7.1%) |
| 3 or 4 Children | 17 (100.0%) | 0 (0.0%) |
| 5 or more Children | 2 (100.0%) | 0 (0.0%) |
| Total | 61 (92.4%) | 5 (7.6%) |
Income Below Poverty Among Single-Parent Households in Altamont
| Children | Single Father | Single Mother |
| No Children | 0 (0.0%) | 0 (0.0%) |
| 1 or 2 Children | 0 (0.0%) | 0 (0.0%) |
| 3 or 4 Children | 0 (0.0%) | 0 (0.0%) |
| 5 or more Children | 0 (0.0%) | 0 (0.0%) |
| Total | 0 (0.0%) | 0 (0.0%) |
Income Below Poverty Among Married-Couple vs Single-Parent Households in Altamont
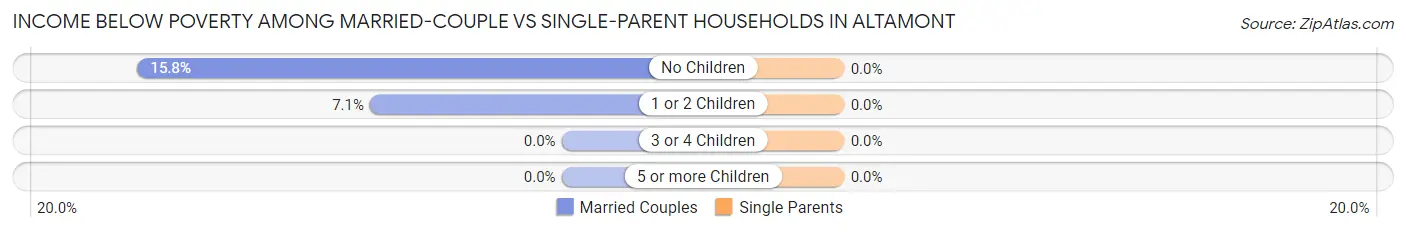
| Children | Married-Couple Families | Single-Parent Households |
| No Children | 3 (15.8%) | 0 (0.0%) |
| 1 or 2 Children | 2 (7.1%) | 0 (0.0%) |
| 3 or 4 Children | 0 (0.0%) | 0 (0.0%) |
| 5 or more Children | 0 (0.0%) | 0 (0.0%) |
| Total | 5 (7.6%) | 0 (0.0%) |
Race in Altamont
The most populous races in Altamont are White / Caucasian (424 | 97.7%), Black / African American (10 | 2.3%), and Hispanic or Latino (9 | 2.1%).
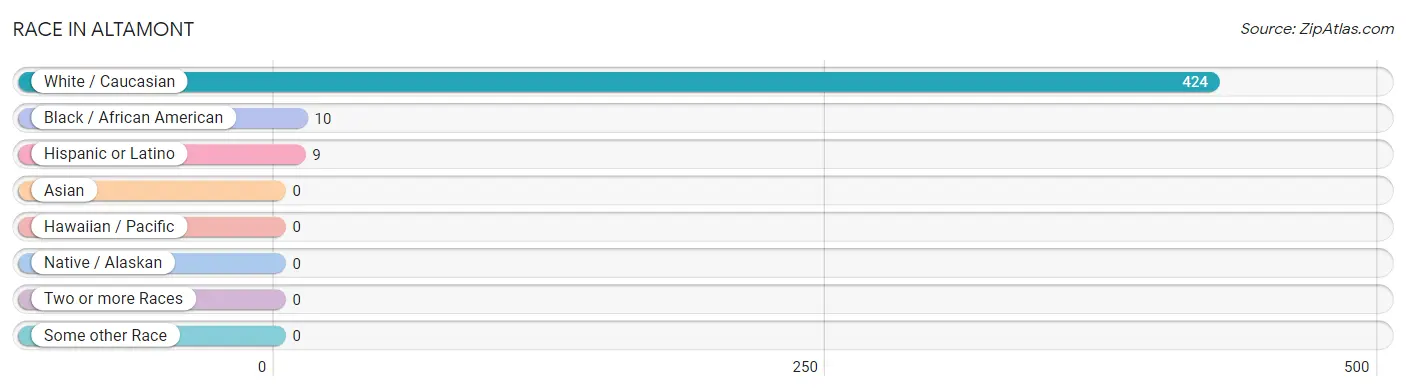
| Race | # Population | % Population |
| Asian | 0 | 0.0% |
| Black / African American | 10 | 2.3% |
| Hawaiian / Pacific | 0 | 0.0% |
| Hispanic or Latino | 9 | 2.1% |
| Native / Alaskan | 0 | 0.0% |
| White / Caucasian | 424 | 97.7% |
| Two or more Races | 0 | 0.0% |
| Some other Race | 0 | 0.0% |
| Total | 434 | 100.0% |
Ancestry in Altamont
The most populous ancestries reported in Altamont are English (333 | 76.7%), Irish (48 | 11.1%), Dutch (35 | 8.1%), Scandinavian (33 | 7.6%), and Danish (31 | 7.1%), together accounting for 110.6% of all Altamont residents.
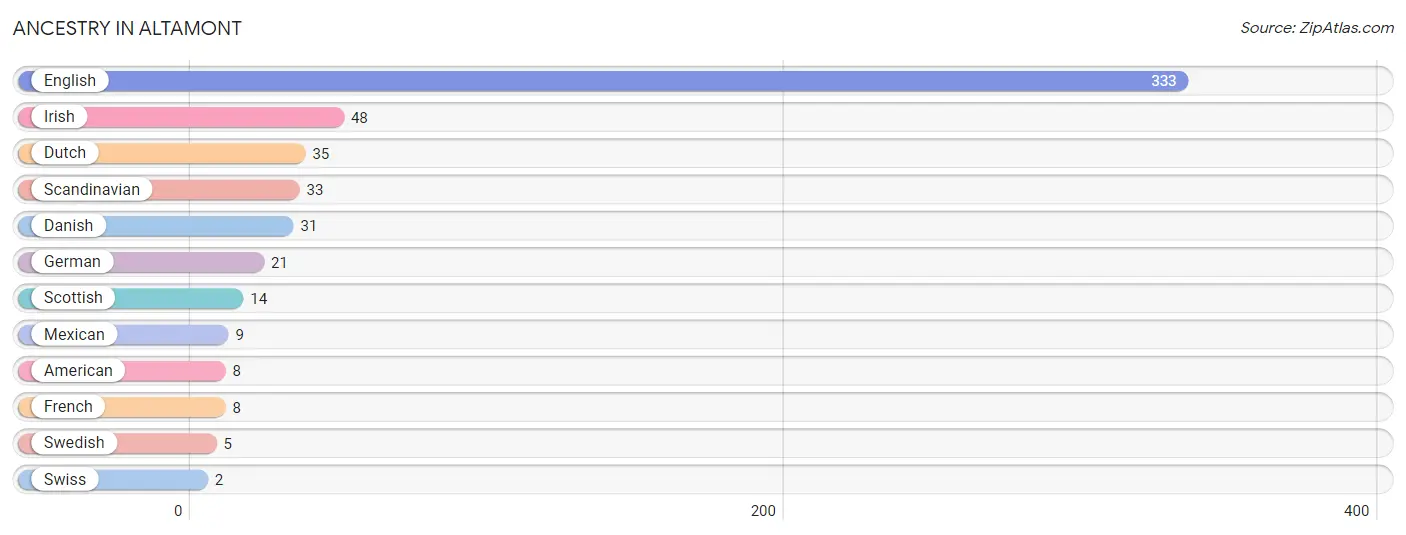
| Ancestry | # Population | % Population |
| American | 8 | 1.8% |
| Danish | 31 | 7.1% |
| Dutch | 35 | 8.1% |
| English | 333 | 76.7% |
| French | 8 | 1.8% |
| German | 21 | 4.8% |
| Irish | 48 | 11.1% |
| Mexican | 9 | 2.1% |
| Scandinavian | 33 | 7.6% |
| Scottish | 14 | 3.2% |
| Swedish | 5 | 1.1% |
| Swiss | 2 | 0.5% | View All 12 Rows |
Immigrants in Altamont
The most numerous immigrant groups reported in Altamont came from , and Canada (2 | 0.5%), together accounting for 0.5% of all Altamont residents.

| Immigration Origin | # Population | % Population |
| Canada | 2 | 0.5% | View All 1 Rows |
Sex and Age in Altamont
Sex and Age in Altamont
The most populous age groups in Altamont are Under 5 Years (26 | 14.1%) for men and 5 to 9 Years (54 | 21.6%) for women.
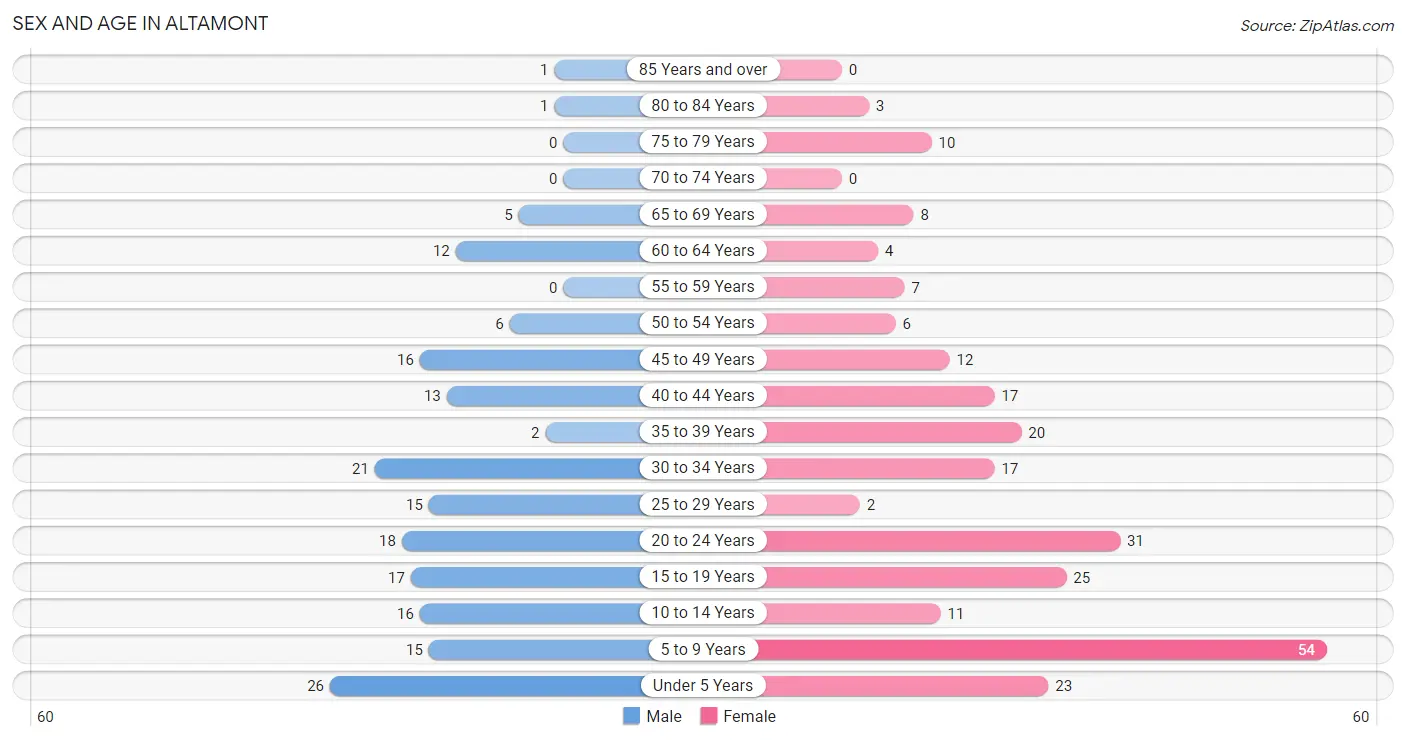
| Age Bracket | Male | Female |
| Under 5 Years | 26 (14.1%) | 23 (9.2%) |
| 5 to 9 Years | 15 (8.2%) | 54 (21.6%) |
| 10 to 14 Years | 16 (8.7%) | 11 (4.4%) |
| 15 to 19 Years | 17 (9.2%) | 25 (10.0%) |
| 20 to 24 Years | 18 (9.8%) | 31 (12.4%) |
| 25 to 29 Years | 15 (8.2%) | 2 (0.8%) |
| 30 to 34 Years | 21 (11.4%) | 17 (6.8%) |
| 35 to 39 Years | 2 (1.1%) | 20 (8.0%) |
| 40 to 44 Years | 13 (7.1%) | 17 (6.8%) |
| 45 to 49 Years | 16 (8.7%) | 12 (4.8%) |
| 50 to 54 Years | 6 (3.3%) | 6 (2.4%) |
| 55 to 59 Years | 0 (0.0%) | 7 (2.8%) |
| 60 to 64 Years | 12 (6.5%) | 4 (1.6%) |
| 65 to 69 Years | 5 (2.7%) | 8 (3.2%) |
| 70 to 74 Years | 0 (0.0%) | 0 (0.0%) |
| 75 to 79 Years | 0 (0.0%) | 10 (4.0%) |
| 80 to 84 Years | 1 (0.5%) | 3 (1.2%) |
| 85 Years and over | 1 (0.5%) | 0 (0.0%) |
| Total | 184 (100.0%) | 250 (100.0%) |
Families and Households in Altamont
Median Family Size in Altamont
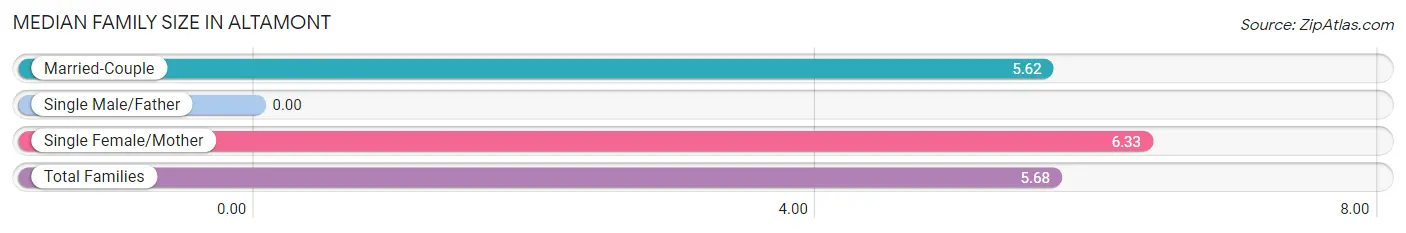
| Family Type | # Families | Family Size |
| Married-Couple | 66 (91.7%) | 5.62 |
| Single Male/Father | 0 (0.0%) | - |
| Single Female/Mother | 6 (8.3%) | 6.33 |
| Total Families | 72 (100.0%) | 5.68 |
Median Household Size in Altamont
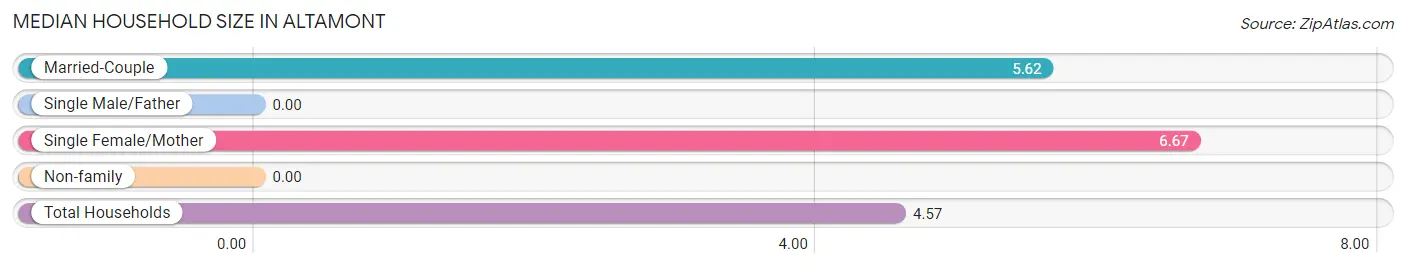
| Household Type | # Households | Household Size |
| Married-Couple | 66 (69.5%) | 5.62 |
| Single Male/Father | 0 (0.0%) | - |
| Single Female/Mother | 6 (6.3%) | 6.67 |
| Non-family | 23 (24.2%) | - |
| Total Households | 95 (100.0%) | 4.57 |
Household Size by Marriage Status in Altamont
Out of a total of 95 households in Altamont, 72 (75.8%) are family households, while 23 (24.2%) are nonfamily households. The most numerous type of family households are 2-person households, comprising 18, and the most common type of nonfamily households are 1-person households, comprising 23.
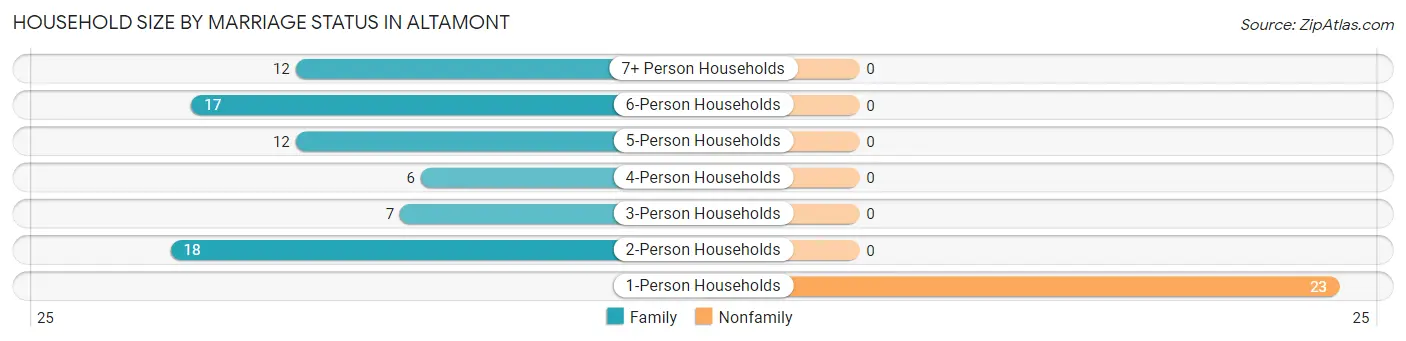
| Household Size | Family Households | Nonfamily Households |
| 1-Person Households | - | 23 (24.2%) |
| 2-Person Households | 18 (19.0%) | 0 (0.0%) |
| 3-Person Households | 7 (7.4%) | 0 (0.0%) |
| 4-Person Households | 6 (6.3%) | 0 (0.0%) |
| 5-Person Households | 12 (12.6%) | 0 (0.0%) |
| 6-Person Households | 17 (17.9%) | 0 (0.0%) |
| 7+ Person Households | 12 (12.6%) | 0 (0.0%) |
| Total | 72 (75.8%) | 23 (24.2%) |
Female Fertility in Altamont
Fertility by Age in Altamont
Average fertility rate in Altamont is 79.0 births per 1,000 women. Women in the age bracket of 20 to 34 years have the highest fertility rate with 200.0 births per 1,000 women. Women in the age bracket of 20 to 34 years acount for 100.0% of all women with births.
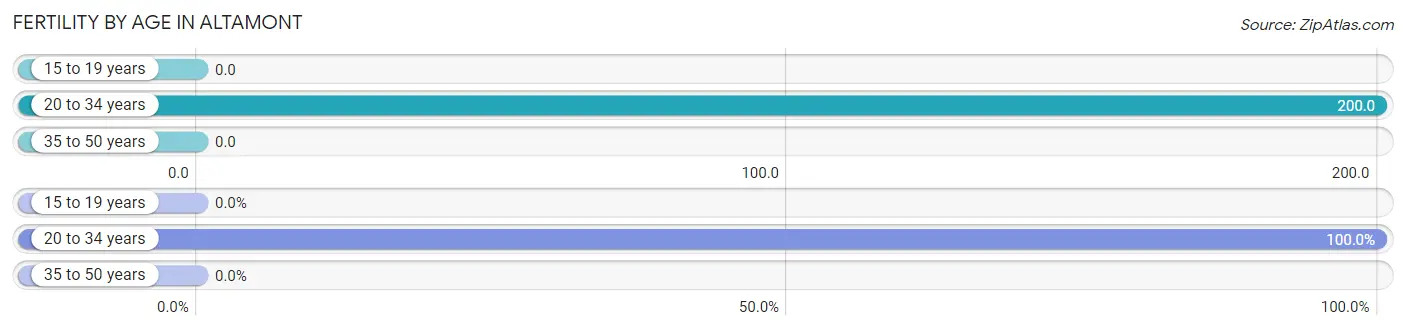
| Age Bracket | Women with Births | Births / 1,000 Women |
| 15 to 19 years | 0 (0.0%) | 0.0 |
| 20 to 34 years | 10 (100.0%) | 200.0 |
| 35 to 50 years | 0 (0.0%) | 0.0 |
| Total | 10 (100.0%) | 79.0 |
Fertility by Age by Marriage Status in Altamont
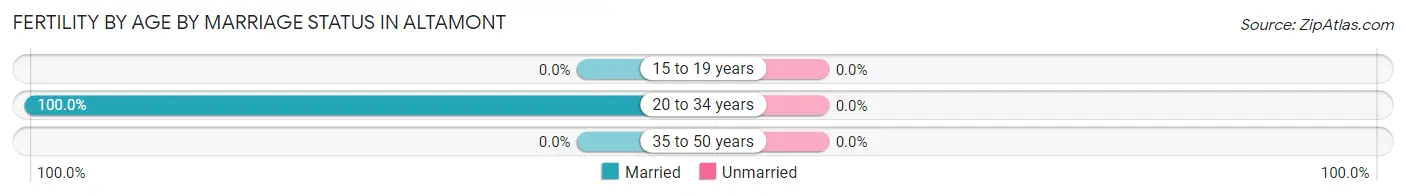
| Age Bracket | Married | Unmarried |
| 15 to 19 years | 0 (0.0%) | 0 (0.0%) |
| 20 to 34 years | 10 (100.0%) | 0 (0.0%) |
| 35 to 50 years | 0 (0.0%) | 0 (0.0%) |
| Total | 10 (100.0%) | 0 (0.0%) |
Fertility by Education in Altamont
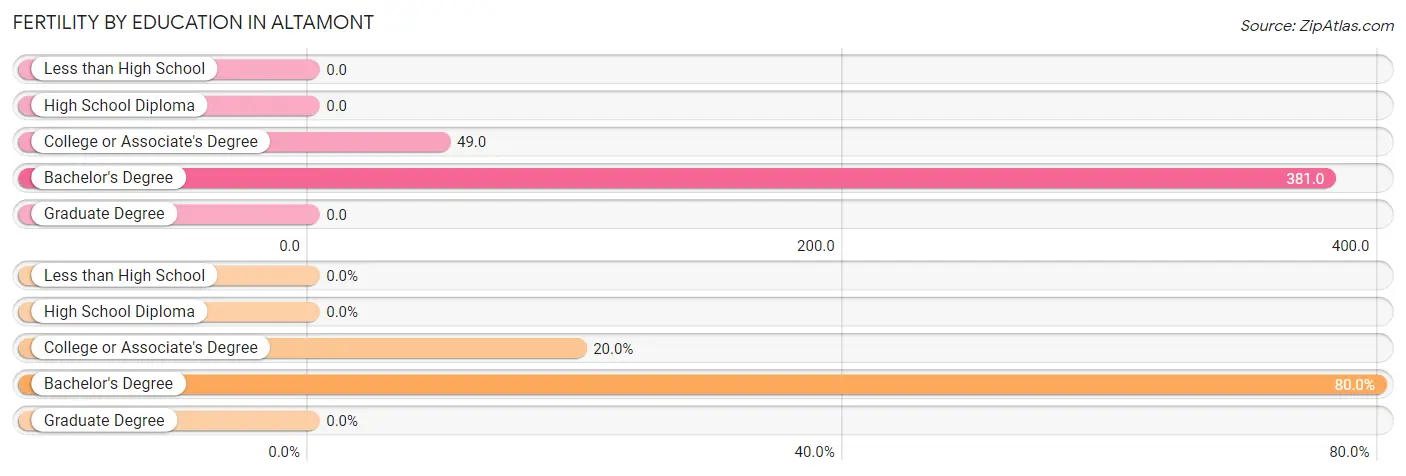
| Educational Attainment | Women with Births | Births / 1,000 Women |
| Less than High School | 0 (0.0%) | 0.0 |
| High School Diploma | 0 (0.0%) | 0.0 |
| College or Associate's Degree | 2 (20.0%) | 49.0 |
| Bachelor's Degree | 8 (80.0%) | 381.0 |
| Graduate Degree | 0 (0.0%) | 0.0 |
| Total | 10 (100.0%) | 79.0 |
Fertility by Education by Marriage Status in Altamont
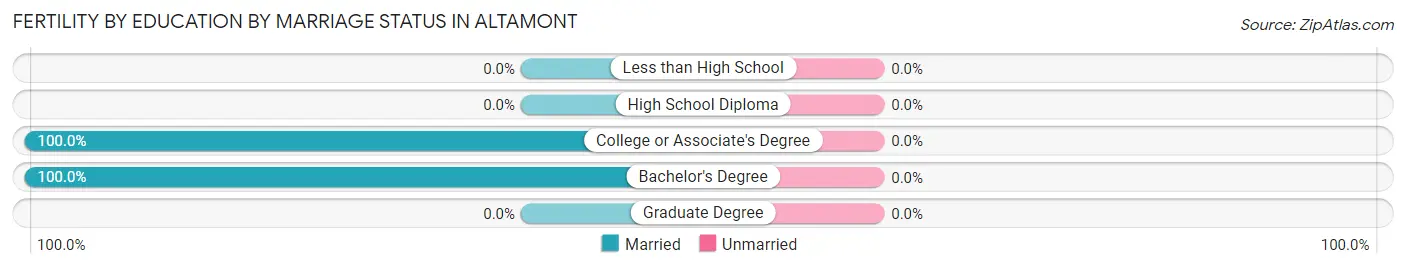
| Educational Attainment | Married | Unmarried |
| Less than High School | 0 (0.0%) | 0 (0.0%) |
| High School Diploma | 0 (0.0%) | 0 (0.0%) |
| College or Associate's Degree | 2 (100.0%) | 0 (0.0%) |
| Bachelor's Degree | 8 (100.0%) | 0 (0.0%) |
| Graduate Degree | 0 (0.0%) | 0 (0.0%) |
| Total | 10 (100.0%) | 0 (0.0%) |
Employment Characteristics in Altamont
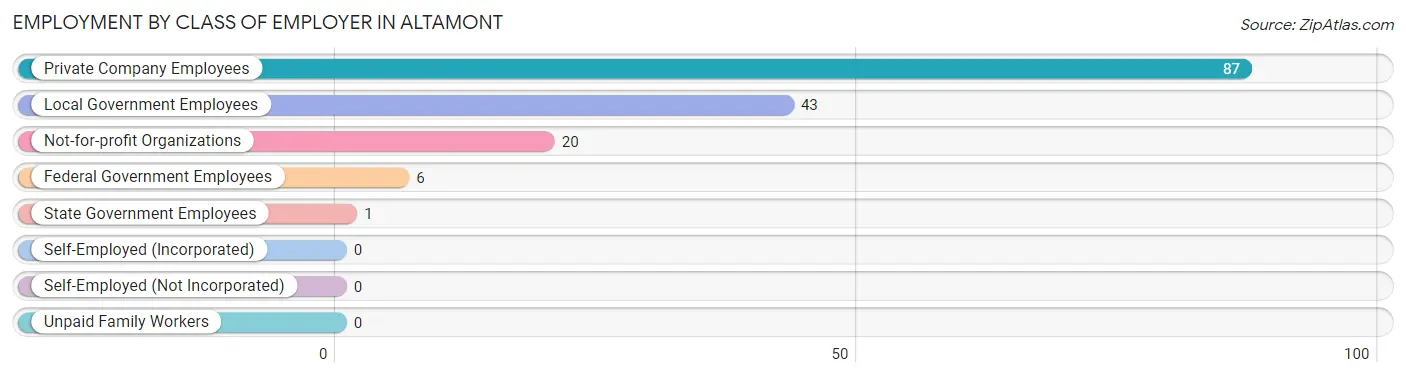
Employment by Class of Employer in Altamont
Among the 157 employed individuals in Altamont, private company employees (87 | 55.4%), local government employees (43 | 27.4%), and not-for-profit organizations (20 | 12.7%) make up the most common classes of employment.
| Employer Class | # Employees | % Employees |
| Private Company Employees | 87 | 55.4% |
| Self-Employed (Incorporated) | 0 | 0.0% |
| Self-Employed (Not Incorporated) | 0 | 0.0% |
| Not-for-profit Organizations | 20 | 12.7% |
| Local Government Employees | 43 | 27.4% |
| State Government Employees | 1 | 0.6% |
| Federal Government Employees | 6 | 3.8% |
| Unpaid Family Workers | 0 | 0.0% |
| Total | 157 | 100.0% |
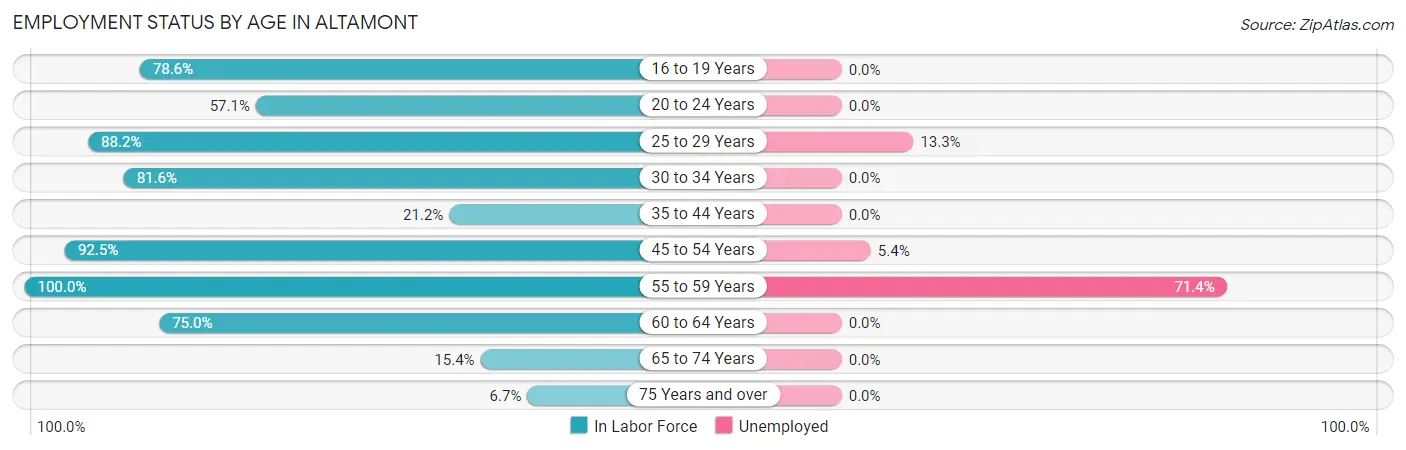
Employment Status by Age in Altamont
According to the labor force statistics for Altamont, out of the total population over 16 years of age (275), 60.4% or 166 individuals are in the labor force, with 5.4% or 9 of them unemployed. The age group with the highest labor force participation rate is 55 to 59 years, with 100.0% or 7 individuals in the labor force. Within the labor force, the 55 to 59 years age range has the highest percentage of unemployed individuals, with 71.4% or 5 of them being unemployed.
| Age Bracket | In Labor Force | Unemployed |
| 16 to 19 Years | 22 (78.6%) | 0 (0.0%) |
| 20 to 24 Years | 28 (57.1%) | 0 (0.0%) |
| 25 to 29 Years | 15 (88.2%) | 2 (13.3%) |
| 30 to 34 Years | 31 (81.6%) | 0 (0.0%) |
| 35 to 44 Years | 11 (21.2%) | 0 (0.0%) |
| 45 to 54 Years | 37 (92.5%) | 2 (5.4%) |
| 55 to 59 Years | 7 (100.0%) | 5 (71.4%) |
| 60 to 64 Years | 12 (75.0%) | 0 (0.0%) |
| 65 to 74 Years | 2 (15.4%) | 0 (0.0%) |
| 75 Years and over | 1 (6.7%) | 0 (0.0%) |
| Total | 166 (60.4%) | 9 (5.4%) |
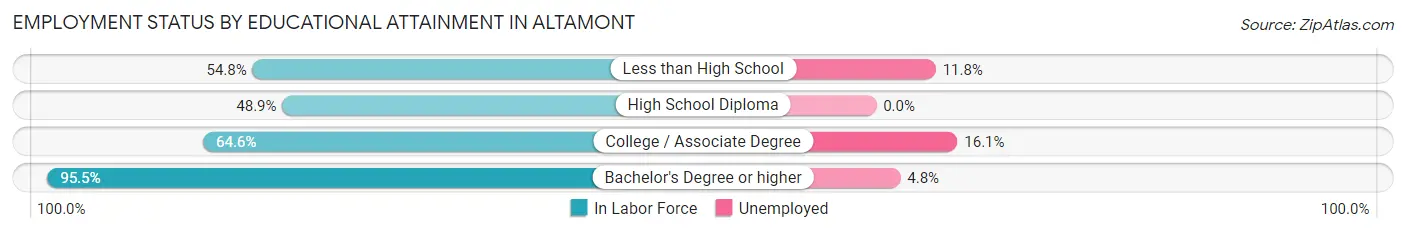
Employment Status by Educational Attainment in Altamont
According to labor force statistics for Altamont, 66.5% of individuals (113) out of the total population between 25 and 64 years of age (170) are in the labor force, with 8.0% or 9 of them being unemployed. The group with the highest labor force participation rate are those with the educational attainment of bachelor's degree or higher, with 95.5% or 42 individuals in the labor force. Within the labor force, individuals with college / associate degree education have the highest percentage of unemployment, with 16.1% or 5 of them being unemployed.
| Educational Attainment | In Labor Force | Unemployed |
| Less than High School | 17 (54.8%) | 4 (11.8%) |
| High School Diploma | 23 (48.9%) | 0 (0.0%) |
| College / Associate Degree | 31 (64.6%) | 8 (16.1%) |
| Bachelor's Degree or higher | 42 (95.5%) | 2 (4.8%) |
| Total | 113 (66.5%) | 14 (8.0%) |
Employment Occupations by Sex in Altamont
Management, Business, Science and Arts Occupations
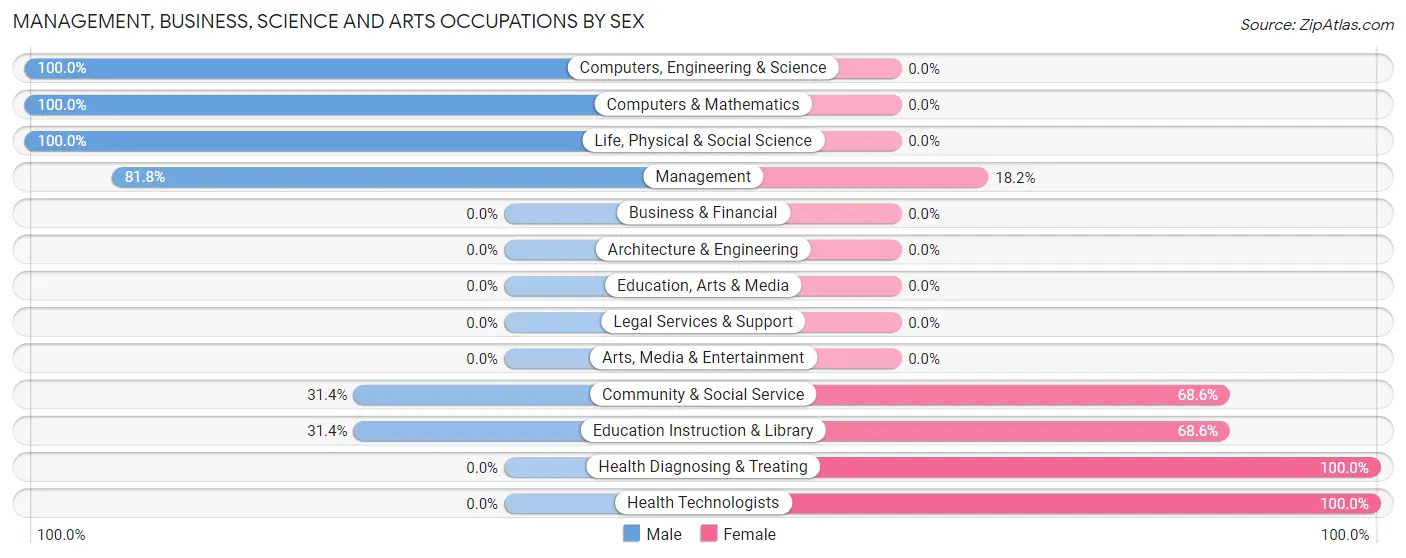
The most common Management, Business, Science and Arts occupations in Altamont are Community & Social Service (35 | 22.3%), Education Instruction & Library (35 | 22.3%), Management (11 | 7.0%), Health Diagnosing & Treating (11 | 7.0%), and Health Technologists (9 | 5.7%).
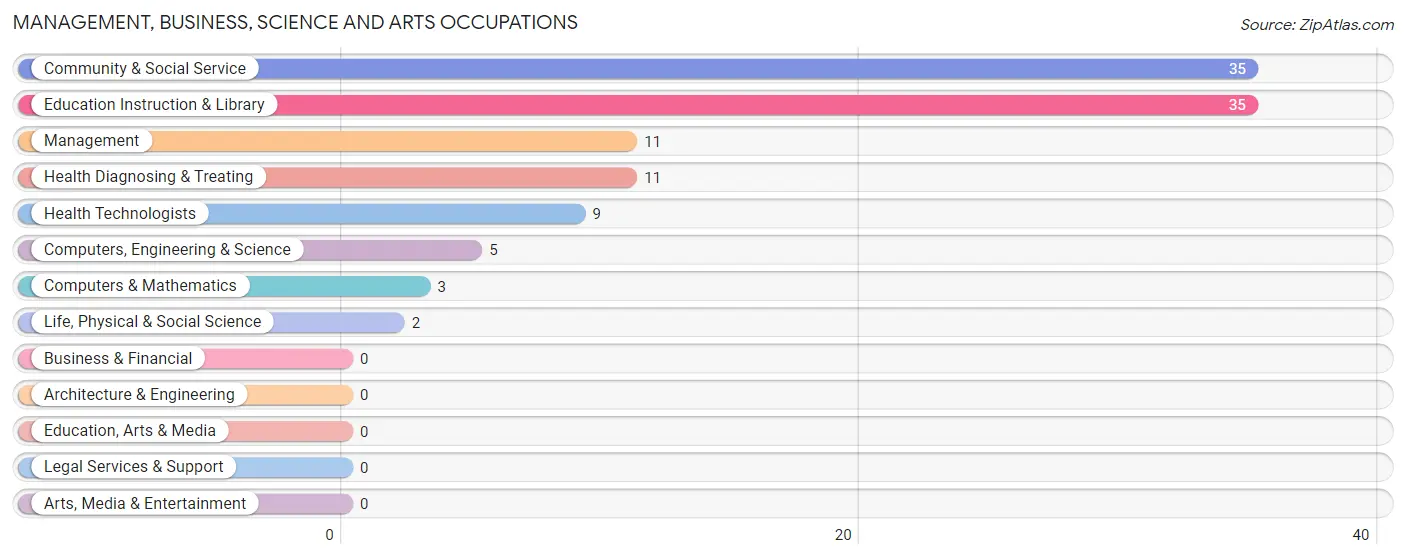
Management, Business, Science and Arts Occupations by Sex
Within the Management, Business, Science and Arts occupations in Altamont, the most male-oriented occupations are Computers, Engineering & Science (100.0%), Computers & Mathematics (100.0%), and Life, Physical & Social Science (100.0%), while the most female-oriented occupations are Health Diagnosing & Treating (100.0%), Health Technologists (100.0%), and Community & Social Service (68.6%).
| Occupation | Male | Female |
| Management | 9 (81.8%) | 2 (18.2%) |
| Business & Financial | 0 (0.0%) | 0 (0.0%) |
| Computers, Engineering & Science | 5 (100.0%) | 0 (0.0%) |
| Computers & Mathematics | 3 (100.0%) | 0 (0.0%) |
| Architecture & Engineering | 0 (0.0%) | 0 (0.0%) |
| Life, Physical & Social Science | 2 (100.0%) | 0 (0.0%) |
| Community & Social Service | 11 (31.4%) | 24 (68.6%) |
| Education, Arts & Media | 0 (0.0%) | 0 (0.0%) |
| Legal Services & Support | 0 (0.0%) | 0 (0.0%) |
| Education Instruction & Library | 11 (31.4%) | 24 (68.6%) |
| Arts, Media & Entertainment | 0 (0.0%) | 0 (0.0%) |
| Health Diagnosing & Treating | 0 (0.0%) | 11 (100.0%) |
| Health Technologists | 0 (0.0%) | 9 (100.0%) |
| Total (Category) | 25 (40.3%) | 37 (59.7%) |
| Total (Overall) | 96 (61.2%) | 61 (38.9%) |
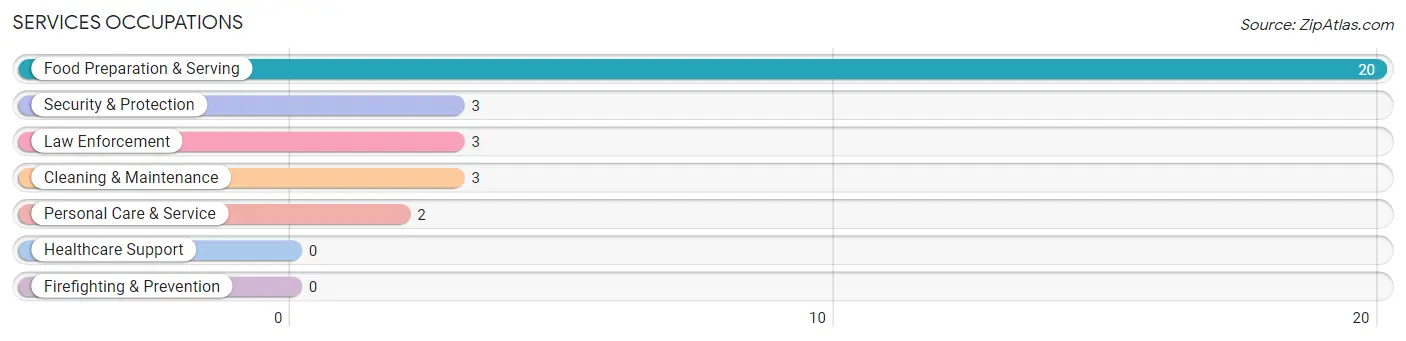
Services Occupations
The most common Services occupations in Altamont are Food Preparation & Serving (20 | 12.7%), Security & Protection (3 | 1.9%), Law Enforcement (3 | 1.9%), Cleaning & Maintenance (3 | 1.9%), and Personal Care & Service (2 | 1.3%).
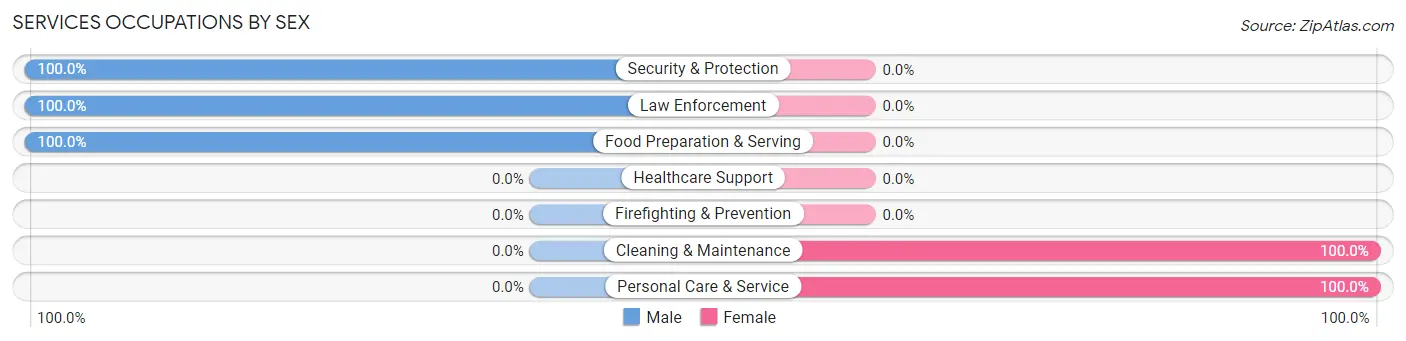
Services Occupations by Sex
Within the Services occupations in Altamont, the most male-oriented occupations are Security & Protection (100.0%), Law Enforcement (100.0%), and Food Preparation & Serving (100.0%), while the most female-oriented occupations are Cleaning & Maintenance (100.0%), and Personal Care & Service (100.0%).
| Occupation | Male | Female |
| Healthcare Support | 0 (0.0%) | 0 (0.0%) |
| Security & Protection | 3 (100.0%) | 0 (0.0%) |
| Firefighting & Prevention | 0 (0.0%) | 0 (0.0%) |
| Law Enforcement | 3 (100.0%) | 0 (0.0%) |
| Food Preparation & Serving | 20 (100.0%) | 0 (0.0%) |
| Cleaning & Maintenance | 0 (0.0%) | 3 (100.0%) |
| Personal Care & Service | 0 (0.0%) | 2 (100.0%) |
| Total (Category) | 23 (82.1%) | 5 (17.9%) |
| Total (Overall) | 96 (61.2%) | 61 (38.9%) |
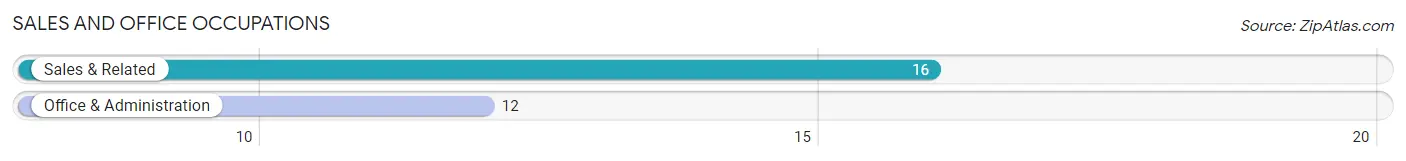
Sales and Office Occupations
The most common Sales and Office occupations in Altamont are Sales & Related (16 | 10.2%), and Office & Administration (12 | 7.6%).
Sales and Office Occupations by Sex
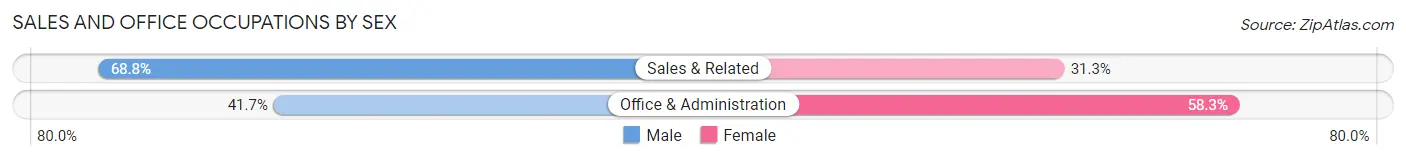
| Occupation | Male | Female |
| Sales & Related | 11 (68.8%) | 5 (31.2%) |
| Office & Administration | 5 (41.7%) | 7 (58.3%) |
| Total (Category) | 16 (57.1%) | 12 (42.9%) |
| Total (Overall) | 96 (61.2%) | 61 (38.9%) |
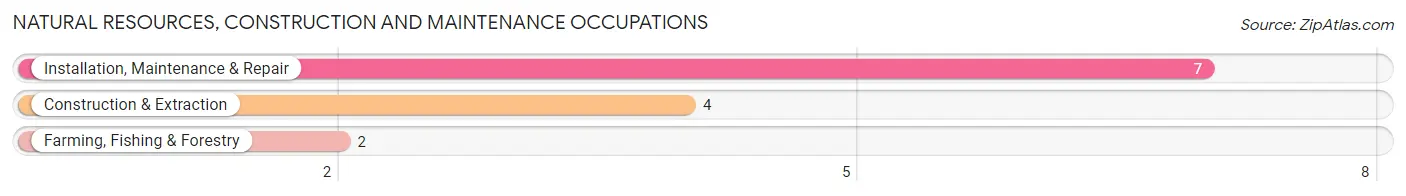
Natural Resources, Construction and Maintenance Occupations
The most common Natural Resources, Construction and Maintenance occupations in Altamont are Installation, Maintenance & Repair (7 | 4.5%), Construction & Extraction (4 | 2.5%), and Farming, Fishing & Forestry (2 | 1.3%).
Natural Resources, Construction and Maintenance Occupations by Sex
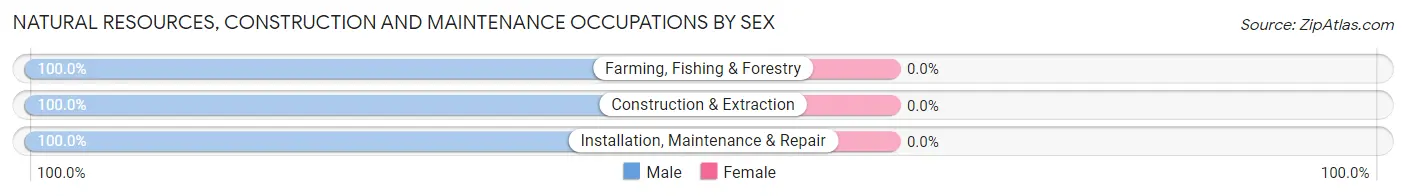
| Occupation | Male | Female |
| Farming, Fishing & Forestry | 2 (100.0%) | 0 (0.0%) |
| Construction & Extraction | 4 (100.0%) | 0 (0.0%) |
| Installation, Maintenance & Repair | 7 (100.0%) | 0 (0.0%) |
| Total (Category) | 13 (100.0%) | 0 (0.0%) |
| Total (Overall) | 96 (61.2%) | 61 (38.9%) |
Production, Transportation and Moving Occupations
The most common Production, Transportation and Moving occupations in Altamont are Transportation (13 | 8.3%), Production (11 | 7.0%), and Material Moving (2 | 1.3%).
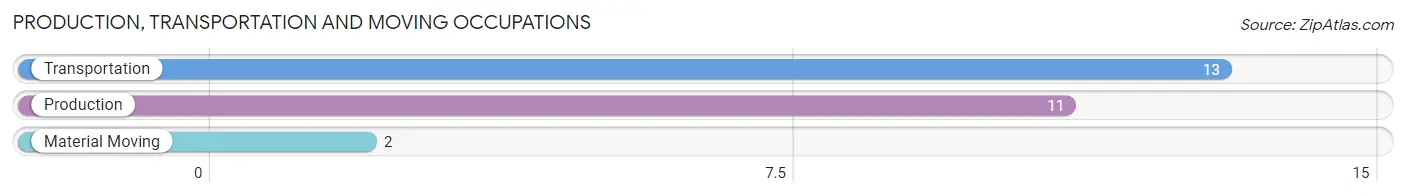
Production, Transportation and Moving Occupations by Sex
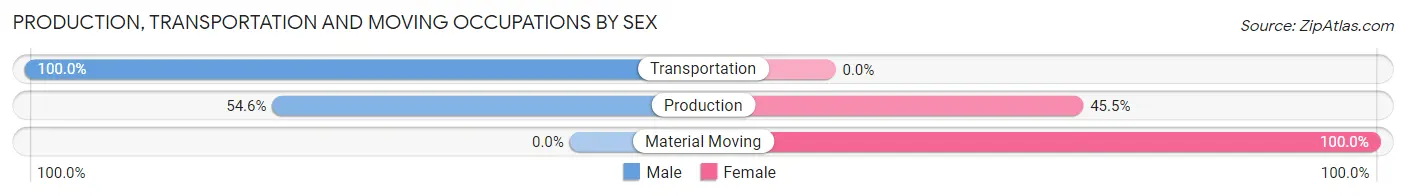
| Occupation | Male | Female |
| Production | 6 (54.5%) | 5 (45.5%) |
| Transportation | 13 (100.0%) | 0 (0.0%) |
| Material Moving | 0 (0.0%) | 2 (100.0%) |
| Total (Category) | 19 (73.1%) | 7 (26.9%) |
| Total (Overall) | 96 (61.2%) | 61 (38.9%) |
Employment Industries by Sex in Altamont
Employment Industries in Altamont
The major employment industries in Altamont include Educational Services (48 | 30.6%), Retail Trade (35 | 22.3%), Mining, Quarrying, & Extraction (15 | 9.6%), Transportation & Warehousing (10 | 6.4%), and Information (8 | 5.1%).

Employment Industries by Sex in Altamont
The Altamont industries that see more men than women are Agriculture, Fishing & Hunting (100.0%), Mining, Quarrying, & Extraction (100.0%), and Construction (100.0%), whereas the industries that tend to have a higher number of women are Health Care & Social Assistance (100.0%), Educational Services (75.0%), and Accommodation & Food Services (62.5%).
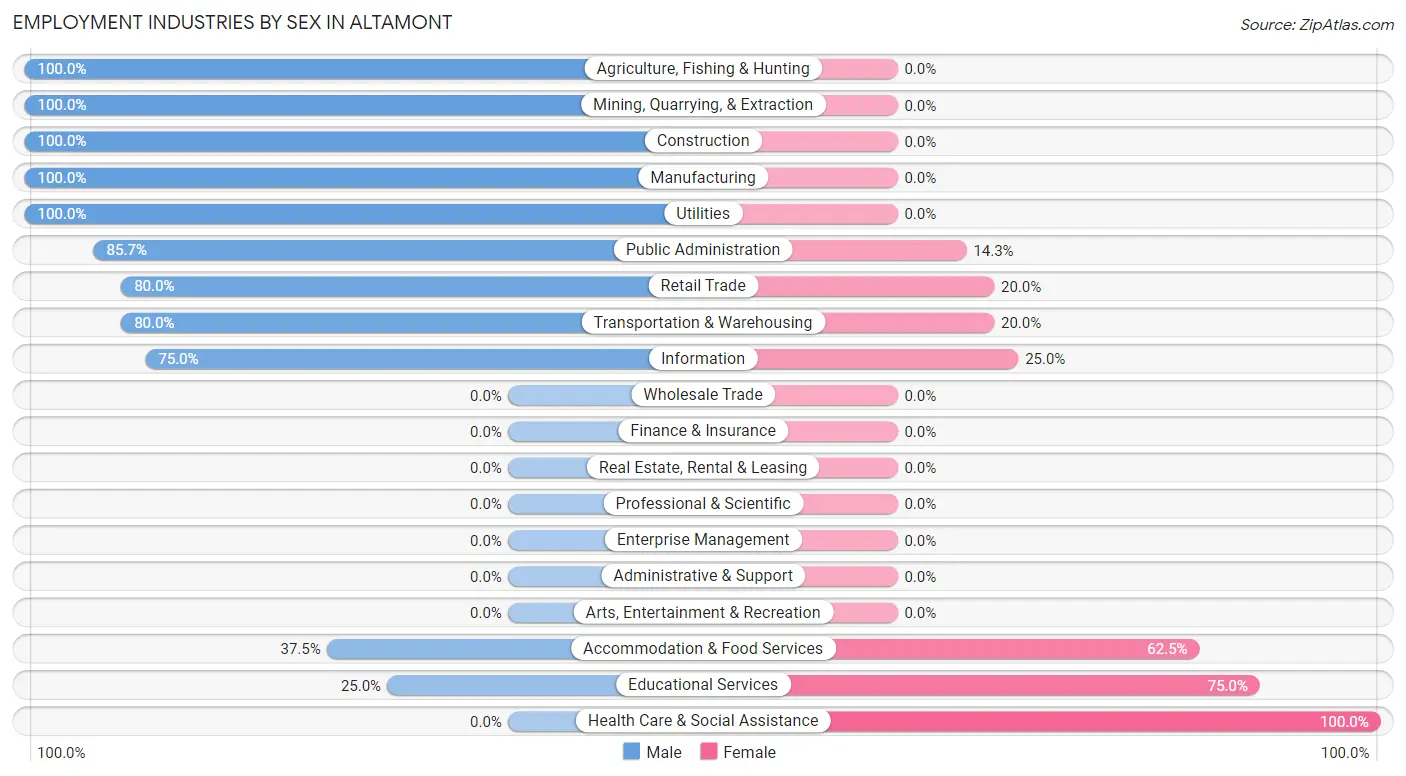
| Industry | Male | Female |
| Agriculture, Fishing & Hunting | 4 (100.0%) | 0 (0.0%) |
| Mining, Quarrying, & Extraction | 15 (100.0%) | 0 (0.0%) |
| Construction | 5 (100.0%) | 0 (0.0%) |
| Manufacturing | 4 (100.0%) | 0 (0.0%) |
| Wholesale Trade | 0 (0.0%) | 0 (0.0%) |
| Retail Trade | 28 (80.0%) | 7 (20.0%) |
| Transportation & Warehousing | 8 (80.0%) | 2 (20.0%) |
| Utilities | 2 (100.0%) | 0 (0.0%) |
| Information | 6 (75.0%) | 2 (25.0%) |
| Finance & Insurance | 0 (0.0%) | 0 (0.0%) |
| Real Estate, Rental & Leasing | 0 (0.0%) | 0 (0.0%) |
| Professional & Scientific | 0 (0.0%) | 0 (0.0%) |
| Enterprise Management | 0 (0.0%) | 0 (0.0%) |
| Administrative & Support | 0 (0.0%) | 0 (0.0%) |
| Educational Services | 12 (25.0%) | 36 (75.0%) |
| Health Care & Social Assistance | 0 (0.0%) | 8 (100.0%) |
| Arts, Entertainment & Recreation | 0 (0.0%) | 0 (0.0%) |
| Accommodation & Food Services | 3 (37.5%) | 5 (62.5%) |
| Public Administration | 6 (85.7%) | 1 (14.3%) |
| Total | 96 (61.2%) | 61 (38.9%) |
Education in Altamont
School Enrollment in Altamont
The most common levels of schooling among the 144 students in Altamont are elementary school (47 | 32.6%), high school (40 | 27.8%), and kindergarten (20 | 13.9%).
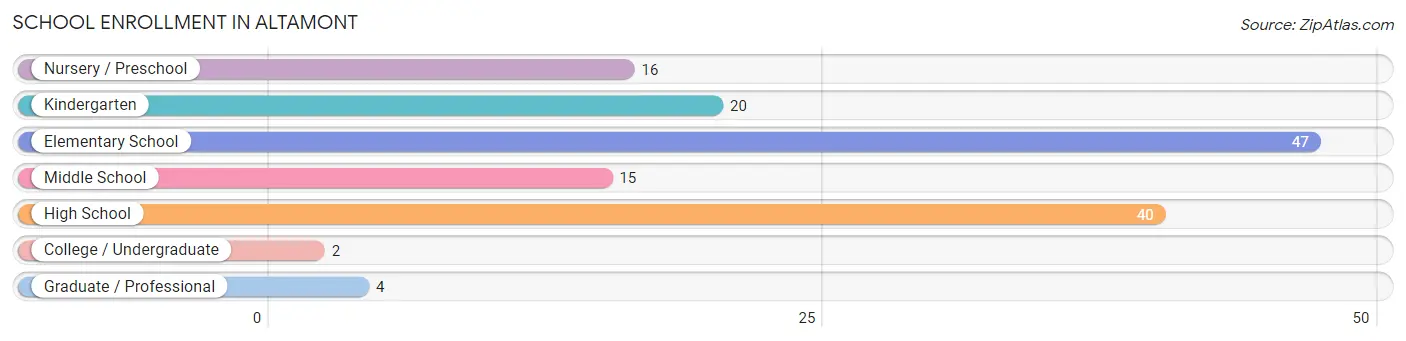
| School Level | # Students | % Students |
| Nursery / Preschool | 16 | 11.1% |
| Kindergarten | 20 | 13.9% |
| Elementary School | 47 | 32.6% |
| Middle School | 15 | 10.4% |
| High School | 40 | 27.8% |
| College / Undergraduate | 2 | 1.4% |
| Graduate / Professional | 4 | 2.8% |
| Total | 144 | 100.0% |
School Enrollment by Age by Funding Source in Altamont
Out of a total of 144 students who are enrolled in schools in Altamont, 4 (2.8%) attend a private institution, while the remaining 140 (97.2%) are enrolled in public schools. The age group of 3 to 4 year olds has the highest likelihood of being enrolled in private schools, with 2 (100.0% in the age bracket) enrolled. Conversely, the age group of 5 to 9 year old has the lowest likelihood of being enrolled in a private school, with 69 (100.0% in the age bracket) attending a public institution.
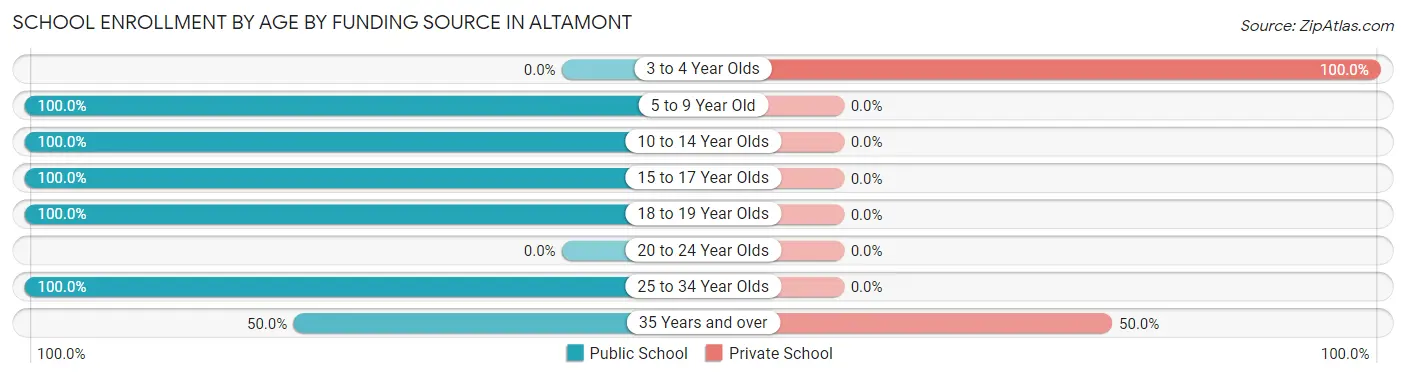
| Age Bracket | Public School | Private School |
| 3 to 4 Year Olds | 0 (0.0%) | 2 (100.0%) |
| 5 to 9 Year Old | 69 (100.0%) | 0 (0.0%) |
| 10 to 14 Year Olds | 27 (100.0%) | 0 (0.0%) |
| 15 to 17 Year Olds | 23 (100.0%) | 0 (0.0%) |
| 18 to 19 Year Olds | 17 (100.0%) | 0 (0.0%) |
| 20 to 24 Year Olds | 0 (0.0%) | 0 (0.0%) |
| 25 to 34 Year Olds | 2 (100.0%) | 0 (0.0%) |
| 35 Years and over | 2 (50.0%) | 2 (50.0%) |
| Total | 140 (97.2%) | 4 (2.8%) |
Educational Attainment by Field of Study in Altamont
Education (25 | 51.0%), science & technology (7 | 14.3%), business (7 | 14.3%), computers & mathematics (3 | 6.1%), and literature & languages (3 | 6.1%) are the most common fields of study among 49 individuals in Altamont who have obtained a bachelor's degree or higher.
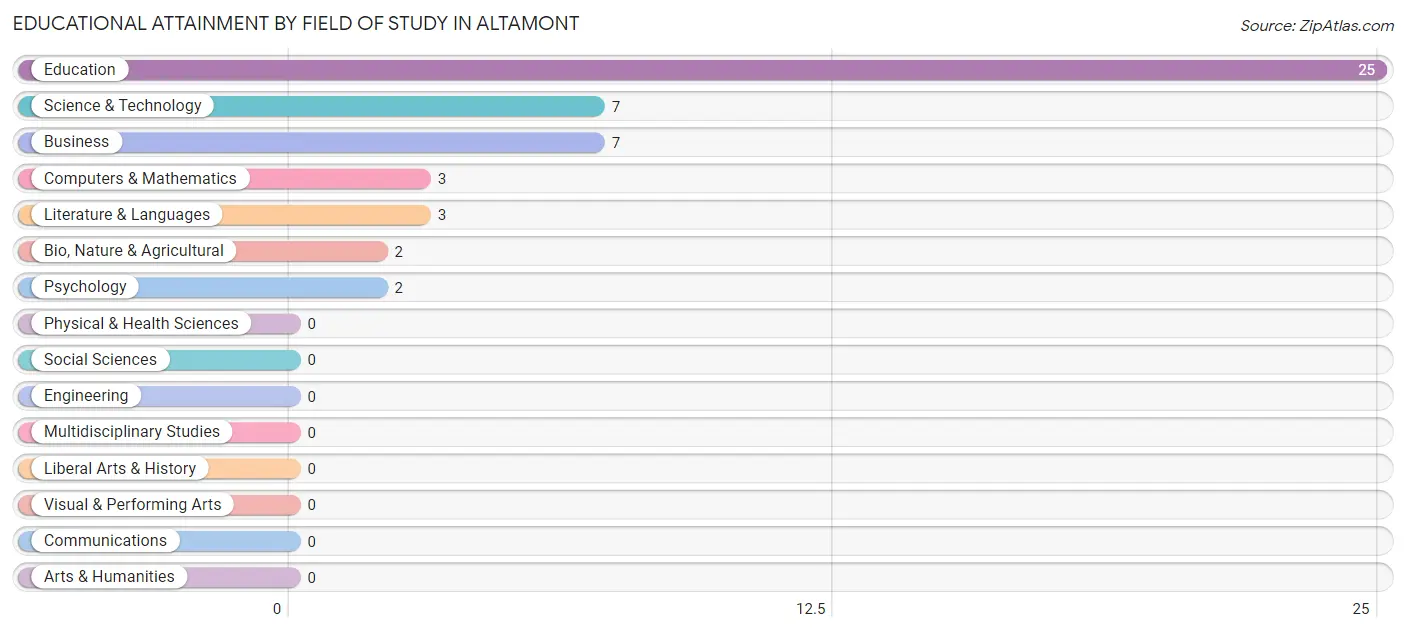
| Field of Study | # Graduates | % Graduates |
| Computers & Mathematics | 3 | 6.1% |
| Bio, Nature & Agricultural | 2 | 4.1% |
| Physical & Health Sciences | 0 | 0.0% |
| Psychology | 2 | 4.1% |
| Social Sciences | 0 | 0.0% |
| Engineering | 0 | 0.0% |
| Multidisciplinary Studies | 0 | 0.0% |
| Science & Technology | 7 | 14.3% |
| Business | 7 | 14.3% |
| Education | 25 | 51.0% |
| Literature & Languages | 3 | 6.1% |
| Liberal Arts & History | 0 | 0.0% |
| Visual & Performing Arts | 0 | 0.0% |
| Communications | 0 | 0.0% |
| Arts & Humanities | 0 | 0.0% |
| Total | 49 | 100.0% |
Transportation & Commute in Altamont
Vehicle Availability by Sex in Altamont
The most prevalent vehicle ownership categories in Altamont are males with 5 or more vehicles (46, accounting for 47.9%) and females with 5 or more vehicles (0, making up 75.4%).
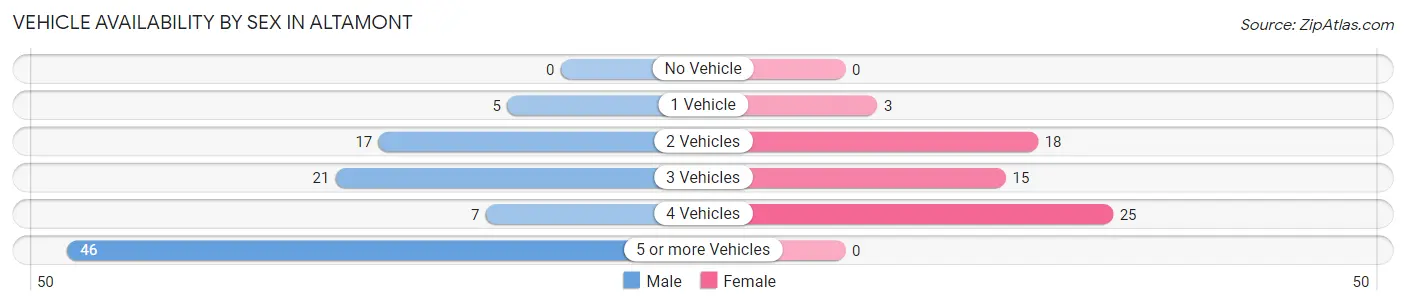
| Vehicles Available | Male | Female |
| No Vehicle | 0 (0.0%) | 0 (0.0%) |
| 1 Vehicle | 5 (5.2%) | 3 (4.9%) |
| 2 Vehicles | 17 (17.7%) | 18 (29.5%) |
| 3 Vehicles | 21 (21.9%) | 15 (24.6%) |
| 4 Vehicles | 7 (7.3%) | 25 (41.0%) |
| 5 or more Vehicles | 46 (47.9%) | 0 (0.0%) |
| Total | 96 (100.0%) | 61 (100.0%) |
Commute Time in Altamont
The most frequently occuring commute durations in Altamont are less than 5 minutes (53 commuters, 33.8%), 25 to 29 minutes (22 commuters, 14.0%), and 30 to 34 minutes (19 commuters, 12.1%).
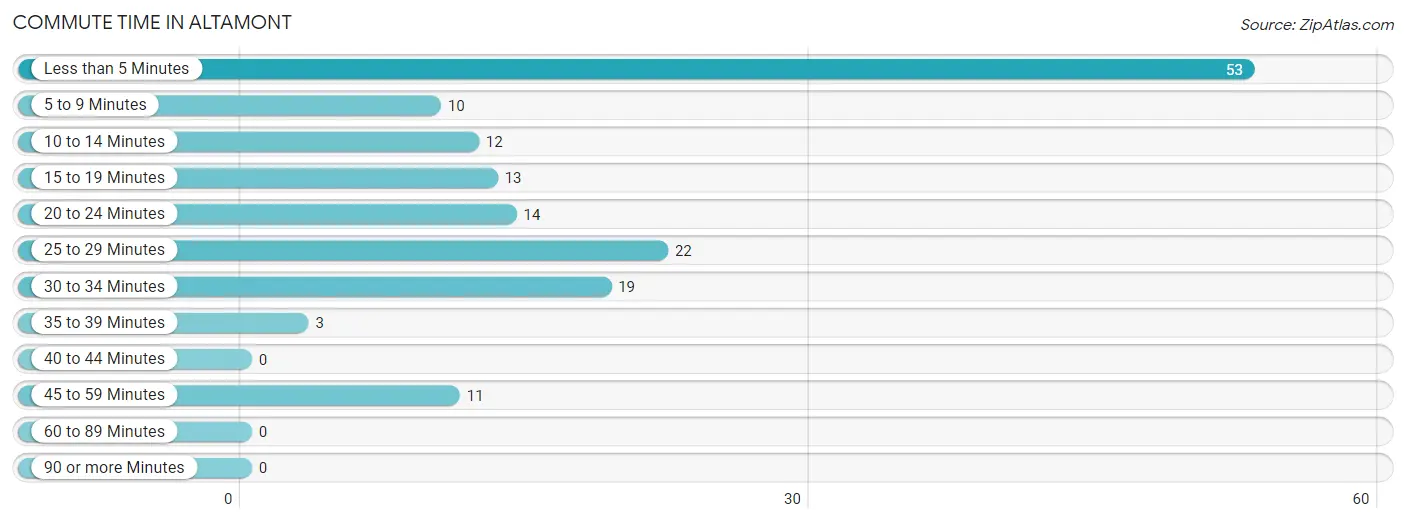
| Commute Time | # Commuters | % Commuters |
| Less than 5 Minutes | 53 | 33.8% |
| 5 to 9 Minutes | 10 | 6.4% |
| 10 to 14 Minutes | 12 | 7.6% |
| 15 to 19 Minutes | 13 | 8.3% |
| 20 to 24 Minutes | 14 | 8.9% |
| 25 to 29 Minutes | 22 | 14.0% |
| 30 to 34 Minutes | 19 | 12.1% |
| 35 to 39 Minutes | 3 | 1.9% |
| 40 to 44 Minutes | 0 | 0.0% |
| 45 to 59 Minutes | 11 | 7.0% |
| 60 to 89 Minutes | 0 | 0.0% |
| 90 or more Minutes | 0 | 0.0% |
Commute Time by Sex in Altamont
The most common commute times in Altamont are less than 5 minutes (35 commuters, 36.5%) for males and less than 5 minutes (18 commuters, 29.5%) for females.
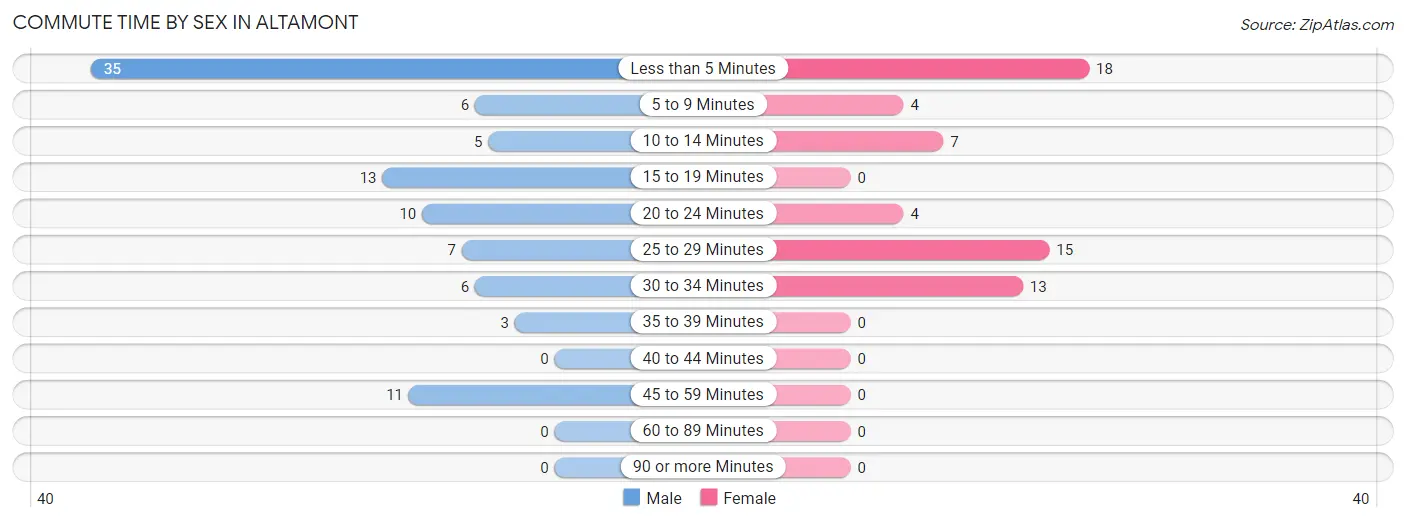
| Commute Time | Male | Female |
| Less than 5 Minutes | 35 (36.5%) | 18 (29.5%) |
| 5 to 9 Minutes | 6 (6.2%) | 4 (6.6%) |
| 10 to 14 Minutes | 5 (5.2%) | 7 (11.5%) |
| 15 to 19 Minutes | 13 (13.5%) | 0 (0.0%) |
| 20 to 24 Minutes | 10 (10.4%) | 4 (6.6%) |
| 25 to 29 Minutes | 7 (7.3%) | 15 (24.6%) |
| 30 to 34 Minutes | 6 (6.2%) | 13 (21.3%) |
| 35 to 39 Minutes | 3 (3.1%) | 0 (0.0%) |
| 40 to 44 Minutes | 0 (0.0%) | 0 (0.0%) |
| 45 to 59 Minutes | 11 (11.5%) | 0 (0.0%) |
| 60 to 89 Minutes | 0 (0.0%) | 0 (0.0%) |
| 90 or more Minutes | 0 (0.0%) | 0 (0.0%) |
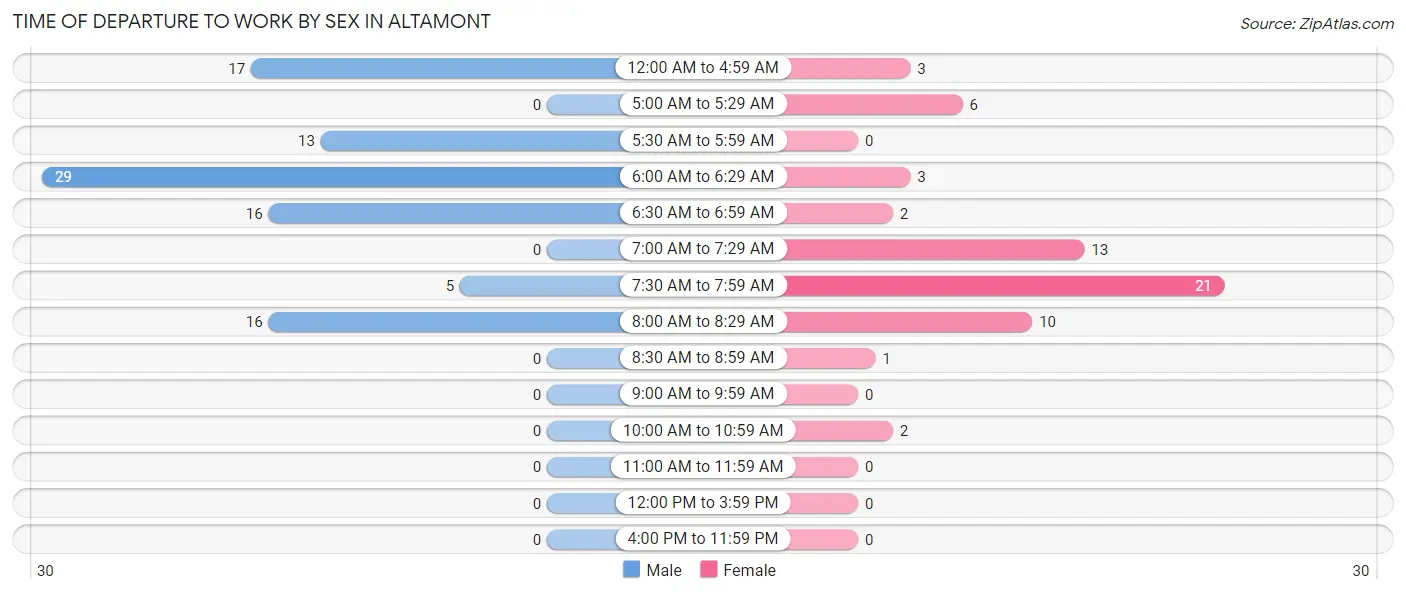
Time of Departure to Work by Sex in Altamont
The most frequent times of departure to work in Altamont are 6:00 AM to 6:29 AM (29, 30.2%) for males and 7:30 AM to 7:59 AM (21, 34.4%) for females.
| Time of Departure | Male | Female |
| 12:00 AM to 4:59 AM | 17 (17.7%) | 3 (4.9%) |
| 5:00 AM to 5:29 AM | 0 (0.0%) | 6 (9.8%) |
| 5:30 AM to 5:59 AM | 13 (13.5%) | 0 (0.0%) |
| 6:00 AM to 6:29 AM | 29 (30.2%) | 3 (4.9%) |
| 6:30 AM to 6:59 AM | 16 (16.7%) | 2 (3.3%) |
| 7:00 AM to 7:29 AM | 0 (0.0%) | 13 (21.3%) |
| 7:30 AM to 7:59 AM | 5 (5.2%) | 21 (34.4%) |
| 8:00 AM to 8:29 AM | 16 (16.7%) | 10 (16.4%) |
| 8:30 AM to 8:59 AM | 0 (0.0%) | 1 (1.6%) |
| 9:00 AM to 9:59 AM | 0 (0.0%) | 0 (0.0%) |
| 10:00 AM to 10:59 AM | 0 (0.0%) | 2 (3.3%) |
| 11:00 AM to 11:59 AM | 0 (0.0%) | 0 (0.0%) |
| 12:00 PM to 3:59 PM | 0 (0.0%) | 0 (0.0%) |
| 4:00 PM to 11:59 PM | 0 (0.0%) | 0 (0.0%) |
| Total | 96 (100.0%) | 61 (100.0%) |
Housing Occupancy in Altamont
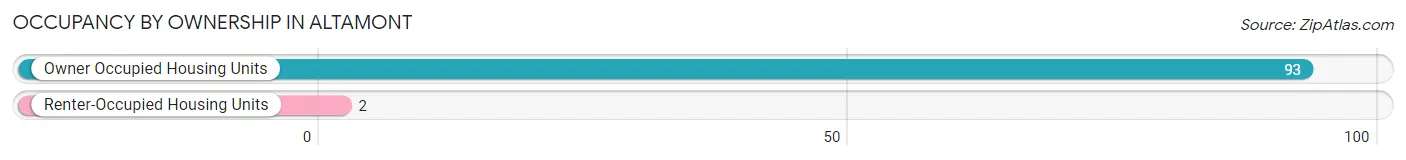
Occupancy by Ownership in Altamont
Of the total 95 dwellings in Altamont, owner-occupied units account for 93 (97.9%), while renter-occupied units make up 2 (2.1%).
| Occupancy | # Housing Units | % Housing Units |
| Owner Occupied Housing Units | 93 | 97.9% |
| Renter-Occupied Housing Units | 2 | 2.1% |
| Total Occupied Housing Units | 95 | 100.0% |
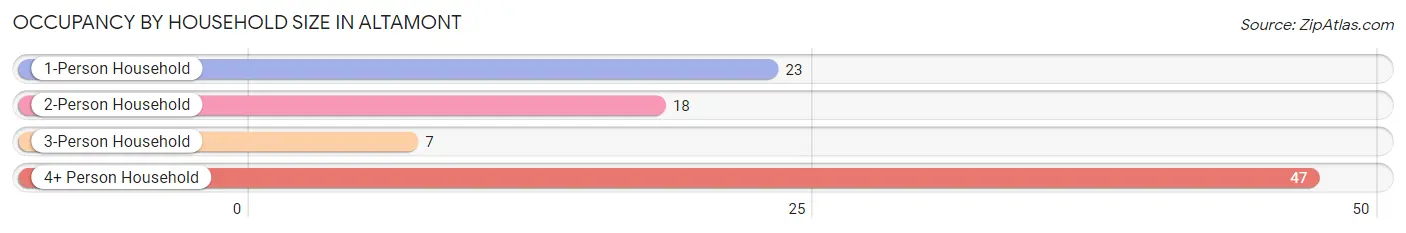
Occupancy by Household Size in Altamont
| Household Size | # Housing Units | % Housing Units |
| 1-Person Household | 23 | 24.2% |
| 2-Person Household | 18 | 19.0% |
| 3-Person Household | 7 | 7.4% |
| 4+ Person Household | 47 | 49.5% |
| Total Housing Units | 95 | 100.0% |
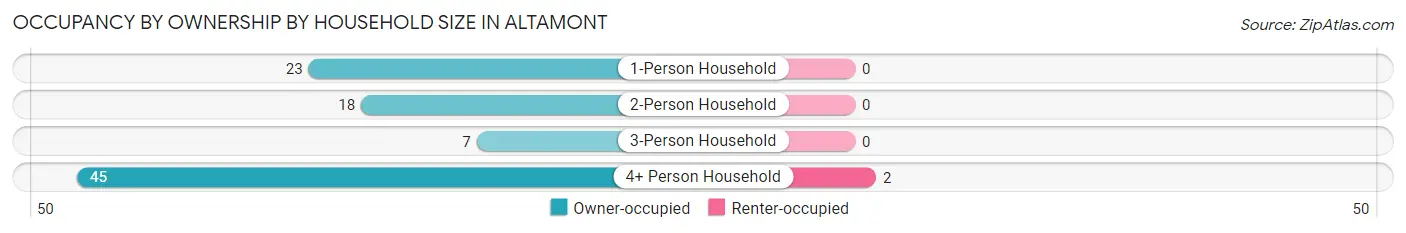
Occupancy by Ownership by Household Size in Altamont
| Household Size | Owner-occupied | Renter-occupied |
| 1-Person Household | 23 (100.0%) | 0 (0.0%) |
| 2-Person Household | 18 (100.0%) | 0 (0.0%) |
| 3-Person Household | 7 (100.0%) | 0 (0.0%) |
| 4+ Person Household | 45 (95.7%) | 2 (4.3%) |
| Total Housing Units | 93 (97.9%) | 2 (2.1%) |
Occupancy by Educational Attainment in Altamont
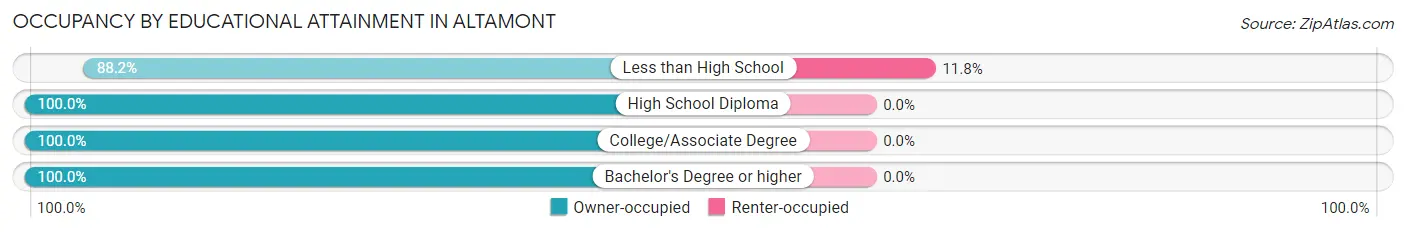
| Household Size | Owner-occupied | Renter-occupied |
| Less than High School | 15 (88.2%) | 2 (11.8%) |
| High School Diploma | 22 (100.0%) | 0 (0.0%) |
| College/Associate Degree | 27 (100.0%) | 0 (0.0%) |
| Bachelor's Degree or higher | 29 (100.0%) | 0 (0.0%) |
Occupancy by Age of Householder in Altamont
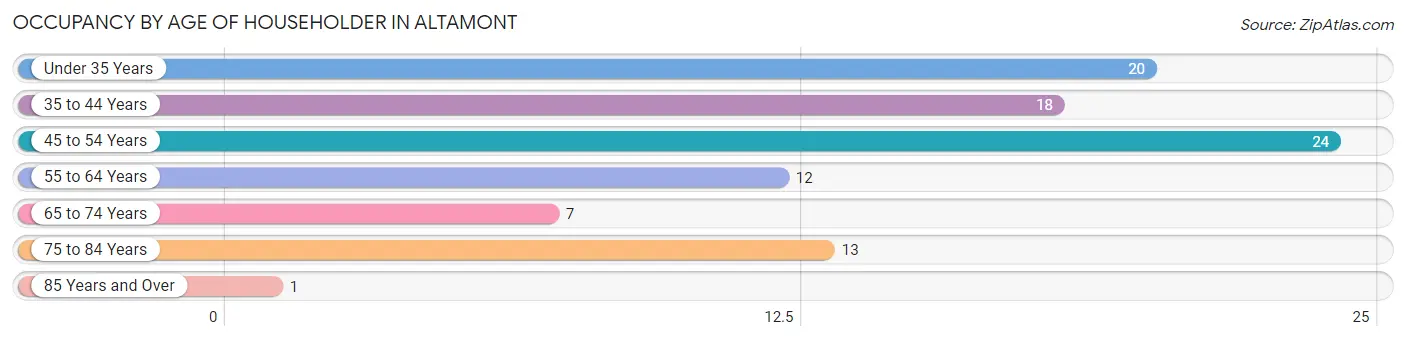
| Age Bracket | # Households | % Households |
| Under 35 Years | 20 | 21.0% |
| 35 to 44 Years | 18 | 19.0% |
| 45 to 54 Years | 24 | 25.3% |
| 55 to 64 Years | 12 | 12.6% |
| 65 to 74 Years | 7 | 7.4% |
| 75 to 84 Years | 13 | 13.7% |
| 85 Years and Over | 1 | 1.1% |
| Total | 95 | 100.0% |
Housing Finances in Altamont
Median Income by Occupancy in Altamont
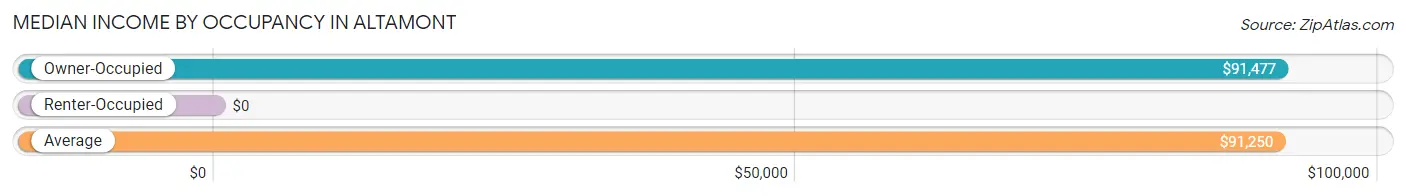
| Occupancy Type | # Households | Median Income |
| Owner-Occupied | 93 (97.9%) | $91,477 |
| Renter-Occupied | 2 (2.1%) | $0 |
| Average | 95 (100.0%) | $91,250 |
Occupancy by Householder Income Bracket in Altamont
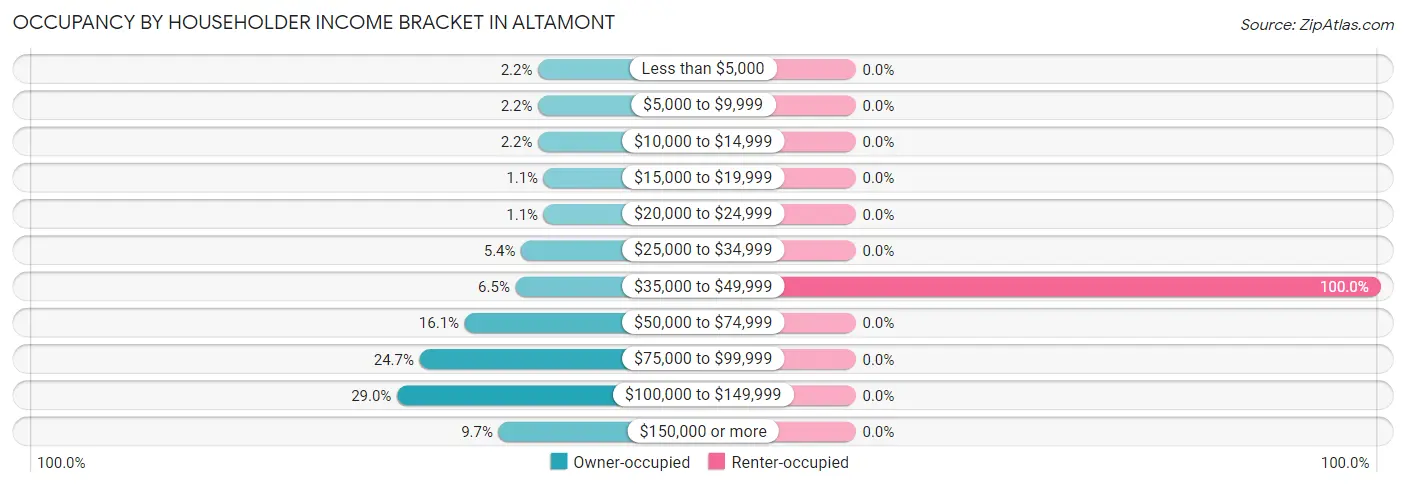
| Income Bracket | Owner-occupied | Renter-occupied |
| Less than $5,000 | 2 (2.1%) | 0 (0.0%) |
| $5,000 to $9,999 | 2 (2.1%) | 0 (0.0%) |
| $10,000 to $14,999 | 2 (2.1%) | 0 (0.0%) |
| $15,000 to $19,999 | 1 (1.1%) | 0 (0.0%) |
| $20,000 to $24,999 | 1 (1.1%) | 0 (0.0%) |
| $25,000 to $34,999 | 5 (5.4%) | 0 (0.0%) |
| $35,000 to $49,999 | 6 (6.5%) | 2 (100.0%) |
| $50,000 to $74,999 | 15 (16.1%) | 0 (0.0%) |
| $75,000 to $99,999 | 23 (24.7%) | 0 (0.0%) |
| $100,000 to $149,999 | 27 (29.0%) | 0 (0.0%) |
| $150,000 or more | 9 (9.7%) | 0 (0.0%) |
| Total | 93 (100.0%) | 2 (100.0%) |
Monthly Housing Cost Tiers in Altamont
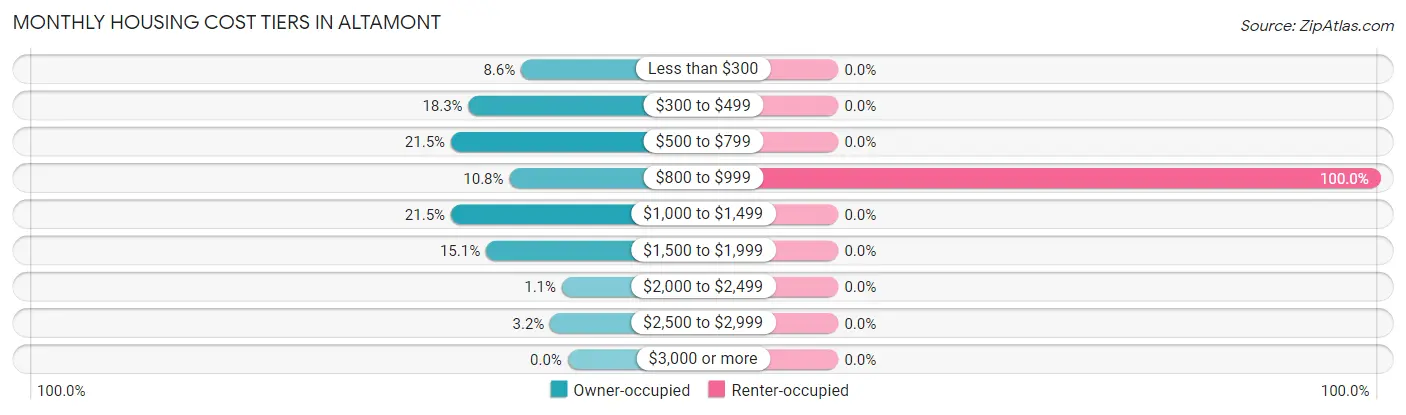
| Monthly Cost | Owner-occupied | Renter-occupied |
| Less than $300 | 8 (8.6%) | 0 (0.0%) |
| $300 to $499 | 17 (18.3%) | 0 (0.0%) |
| $500 to $799 | 20 (21.5%) | 0 (0.0%) |
| $800 to $999 | 10 (10.7%) | 2 (100.0%) |
| $1,000 to $1,499 | 20 (21.5%) | 0 (0.0%) |
| $1,500 to $1,999 | 14 (15.0%) | 0 (0.0%) |
| $2,000 to $2,499 | 1 (1.1%) | 0 (0.0%) |
| $2,500 to $2,999 | 3 (3.2%) | 0 (0.0%) |
| $3,000 or more | 0 (0.0%) | 0 (0.0%) |
| Total | 93 (100.0%) | 2 (100.0%) |
Physical Housing Characteristics in Altamont
Housing Structures in Altamont
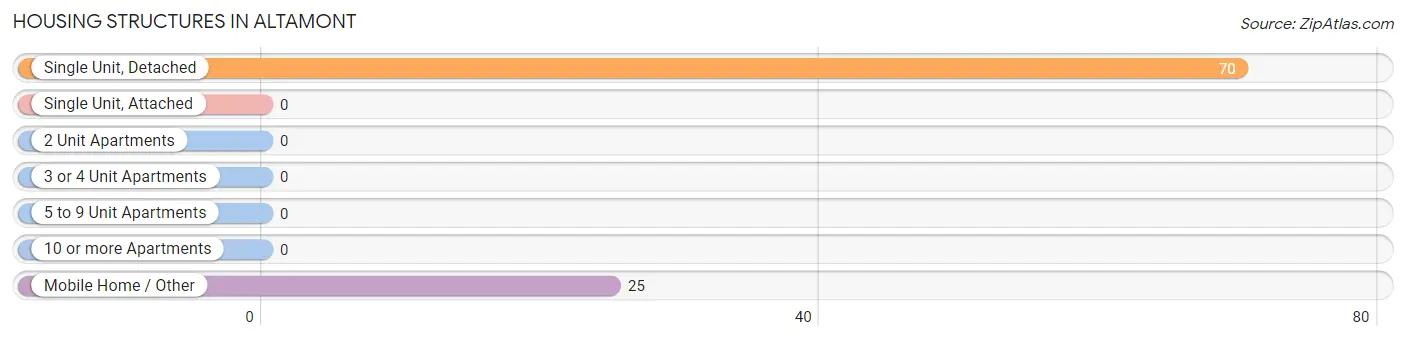
| Structure Type | # Housing Units | % Housing Units |
| Single Unit, Detached | 70 | 73.7% |
| Single Unit, Attached | 0 | 0.0% |
| 2 Unit Apartments | 0 | 0.0% |
| 3 or 4 Unit Apartments | 0 | 0.0% |
| 5 to 9 Unit Apartments | 0 | 0.0% |
| 10 or more Apartments | 0 | 0.0% |
| Mobile Home / Other | 25 | 26.3% |
| Total | 95 | 100.0% |
Housing Structures by Occupancy in Altamont
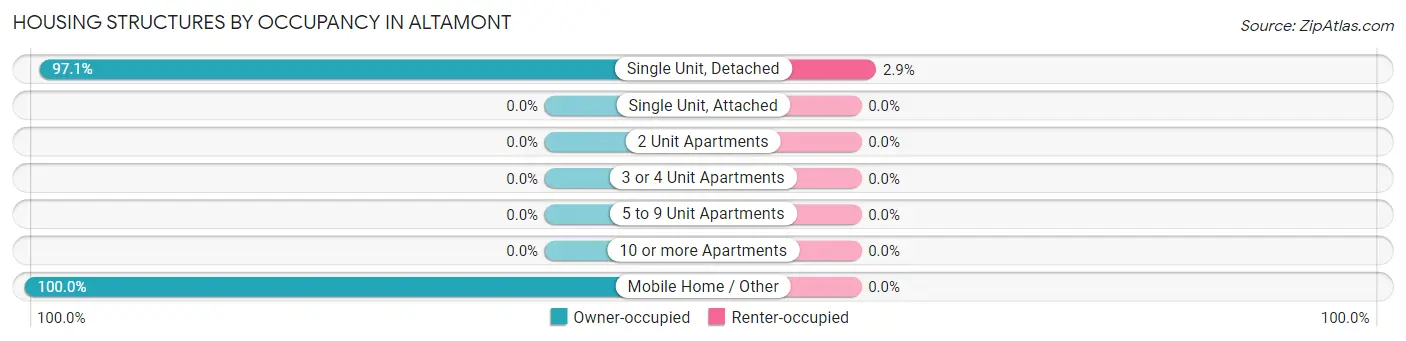
| Structure Type | Owner-occupied | Renter-occupied |
| Single Unit, Detached | 68 (97.1%) | 2 (2.9%) |
| Single Unit, Attached | 0 (0.0%) | 0 (0.0%) |
| 2 Unit Apartments | 0 (0.0%) | 0 (0.0%) |
| 3 or 4 Unit Apartments | 0 (0.0%) | 0 (0.0%) |
| 5 to 9 Unit Apartments | 0 (0.0%) | 0 (0.0%) |
| 10 or more Apartments | 0 (0.0%) | 0 (0.0%) |
| Mobile Home / Other | 25 (100.0%) | 0 (0.0%) |
| Total | 93 (97.9%) | 2 (2.1%) |
Housing Structures by Number of Rooms in Altamont
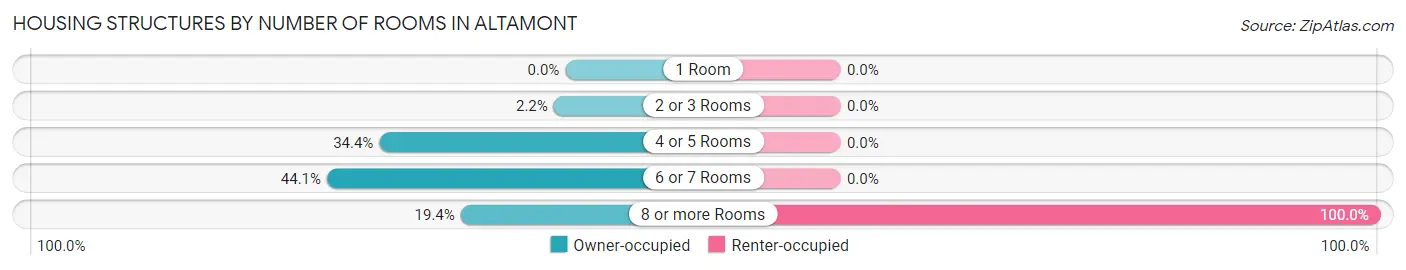
| Number of Rooms | Owner-occupied | Renter-occupied |
| 1 Room | 0 (0.0%) | 0 (0.0%) |
| 2 or 3 Rooms | 2 (2.1%) | 0 (0.0%) |
| 4 or 5 Rooms | 32 (34.4%) | 0 (0.0%) |
| 6 or 7 Rooms | 41 (44.1%) | 0 (0.0%) |
| 8 or more Rooms | 18 (19.4%) | 2 (100.0%) |
| Total | 93 (100.0%) | 2 (100.0%) |
Housing Structure by Heating Type in Altamont
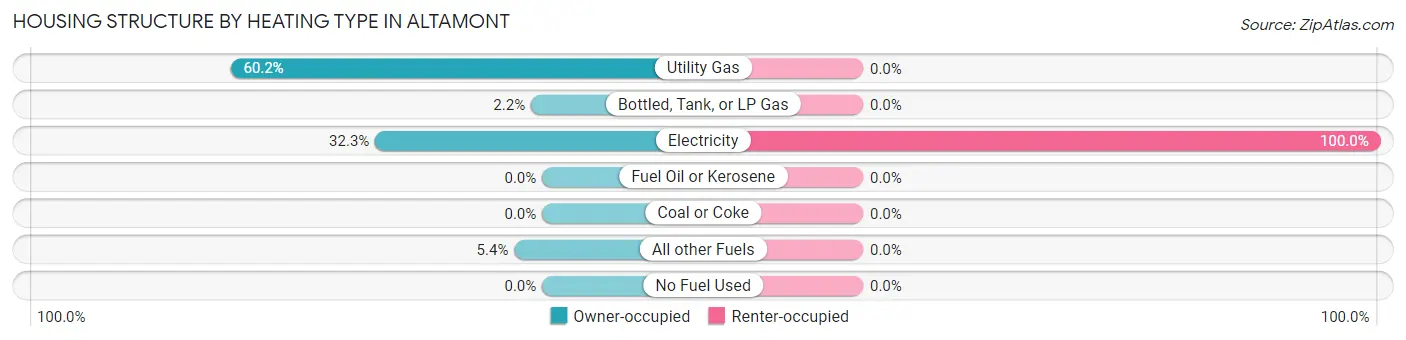
| Heating Type | Owner-occupied | Renter-occupied |
| Utility Gas | 56 (60.2%) | 0 (0.0%) |
| Bottled, Tank, or LP Gas | 2 (2.1%) | 0 (0.0%) |
| Electricity | 30 (32.3%) | 2 (100.0%) |
| Fuel Oil or Kerosene | 0 (0.0%) | 0 (0.0%) |
| Coal or Coke | 0 (0.0%) | 0 (0.0%) |
| All other Fuels | 5 (5.4%) | 0 (0.0%) |
| No Fuel Used | 0 (0.0%) | 0 (0.0%) |
| Total | 93 (100.0%) | 2 (100.0%) |
Household Vehicle Usage in Altamont
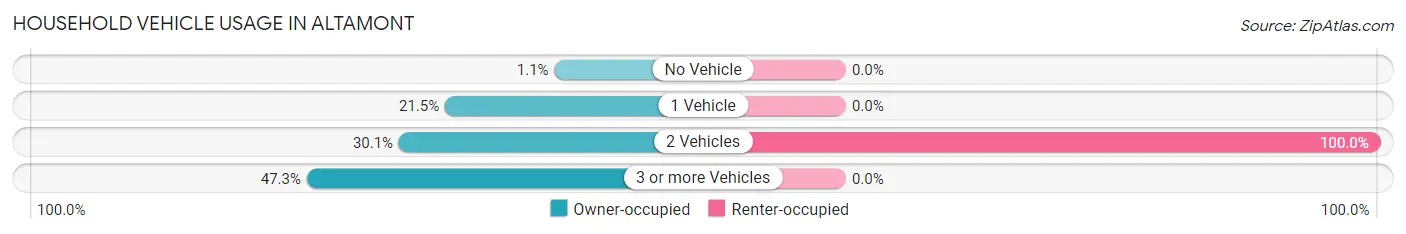
| Vehicles per Household | Owner-occupied | Renter-occupied |
| No Vehicle | 1 (1.1%) | 0 (0.0%) |
| 1 Vehicle | 20 (21.5%) | 0 (0.0%) |
| 2 Vehicles | 28 (30.1%) | 2 (100.0%) |
| 3 or more Vehicles | 44 (47.3%) | 0 (0.0%) |
| Total | 93 (100.0%) | 2 (100.0%) |
Real Estate & Mortgages in Altamont
Real Estate and Mortgage Overview in Altamont
| Characteristic | Without Mortgage | With Mortgage |
| Housing Units | 40 | 53 |
| Median Property Value | $125,000 | $217,900 |
| Median Household Income | $94,167 | $7 |
| Monthly Housing Costs | $400 | $0 |
| Real Estate Taxes | $1,023 | $0 |
Property Value by Mortgage Status in Altamont
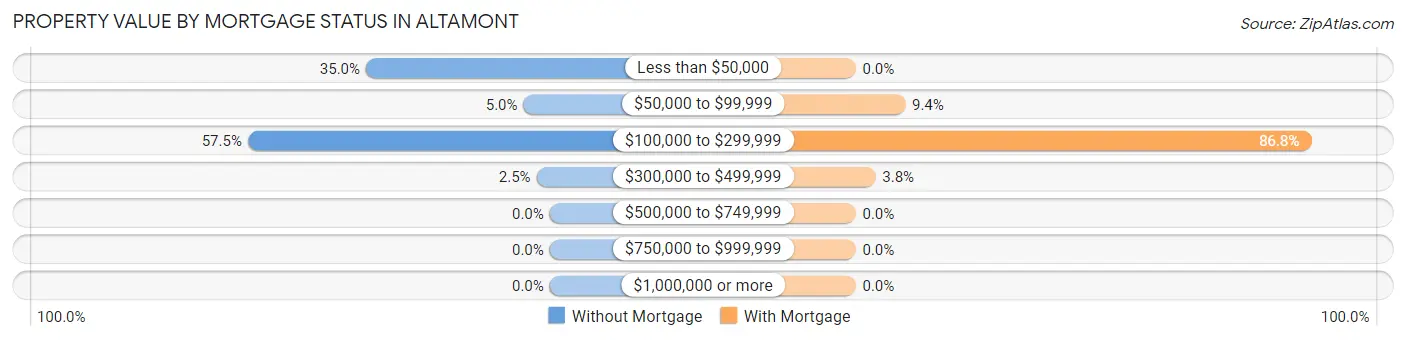
| Property Value | Without Mortgage | With Mortgage |
| Less than $50,000 | 14 (35.0%) | 0 (0.0%) |
| $50,000 to $99,999 | 2 (5.0%) | 5 (9.4%) |
| $100,000 to $299,999 | 23 (57.5%) | 46 (86.8%) |
| $300,000 to $499,999 | 1 (2.5%) | 2 (3.8%) |
| $500,000 to $749,999 | 0 (0.0%) | 0 (0.0%) |
| $750,000 to $999,999 | 0 (0.0%) | 0 (0.0%) |
| $1,000,000 or more | 0 (0.0%) | 0 (0.0%) |
| Total | 40 (100.0%) | 53 (100.0%) |
Household Income by Mortgage Status in Altamont
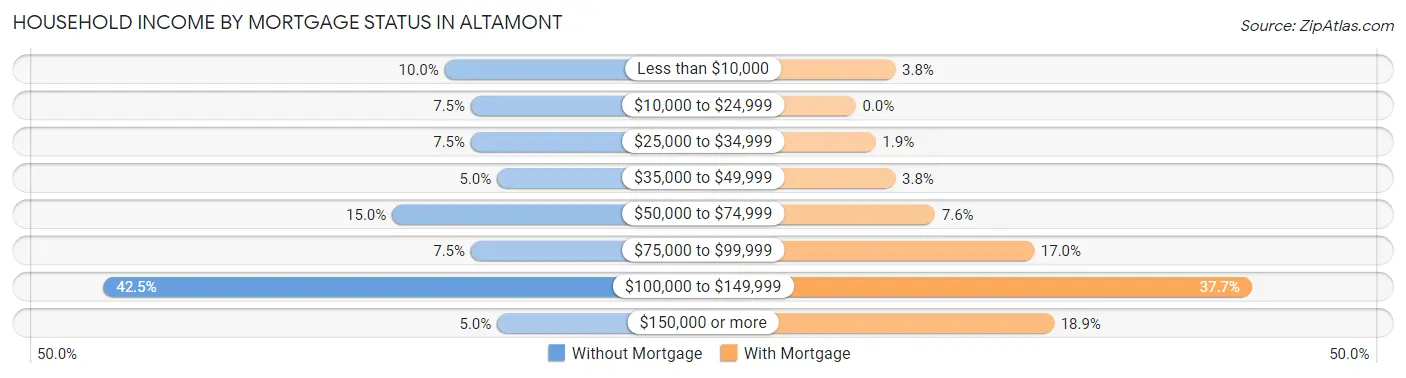
| Household Income | Without Mortgage | With Mortgage |
| Less than $10,000 | 4 (10.0%) | 2 (3.8%) |
| $10,000 to $24,999 | 3 (7.5%) | 0 (0.0%) |
| $25,000 to $34,999 | 3 (7.5%) | 1 (1.9%) |
| $35,000 to $49,999 | 2 (5.0%) | 2 (3.8%) |
| $50,000 to $74,999 | 6 (15.0%) | 4 (7.5%) |
| $75,000 to $99,999 | 3 (7.5%) | 9 (17.0%) |
| $100,000 to $149,999 | 17 (42.5%) | 20 (37.7%) |
| $150,000 or more | 2 (5.0%) | 10 (18.9%) |
| Total | 40 (100.0%) | 53 (100.0%) |
Property Value to Household Income Ratio in Altamont
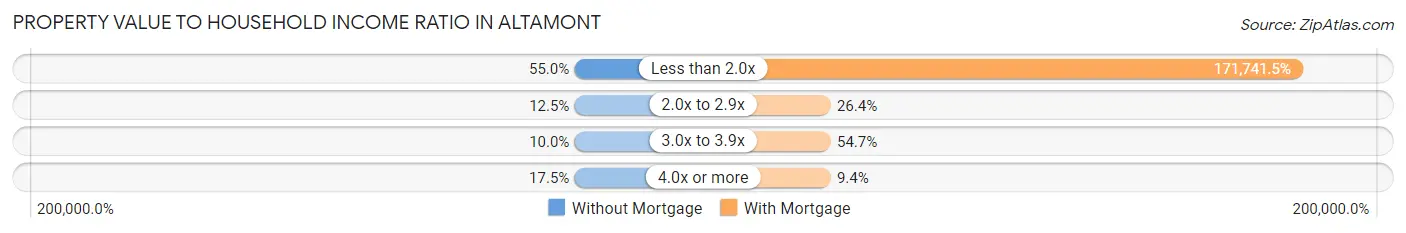
| Value-to-Income Ratio | Without Mortgage | With Mortgage |
| Less than 2.0x | 22 (55.0%) | 91,023 (171,741.5%) |
| 2.0x to 2.9x | 5 (12.5%) | 14 (26.4%) |
| 3.0x to 3.9x | 4 (10.0%) | 29 (54.7%) |
| 4.0x or more | 7 (17.5%) | 5 (9.4%) |
| Total | 40 (100.0%) | 53 (100.0%) |
Real Estate Taxes by Mortgage Status in Altamont
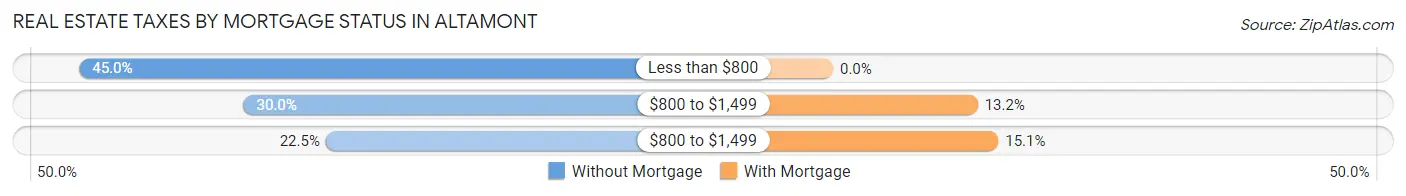
| Property Taxes | Without Mortgage | With Mortgage |
| Less than $800 | 18 (45.0%) | 0 (0.0%) |
| $800 to $1,499 | 12 (30.0%) | 7 (13.2%) |
| $800 to $1,499 | 9 (22.5%) | 8 (15.1%) |
| Total | 40 (100.0%) | 53 (100.0%) |
Health & Disability in Altamont
Health Insurance Coverage by Age in Altamont
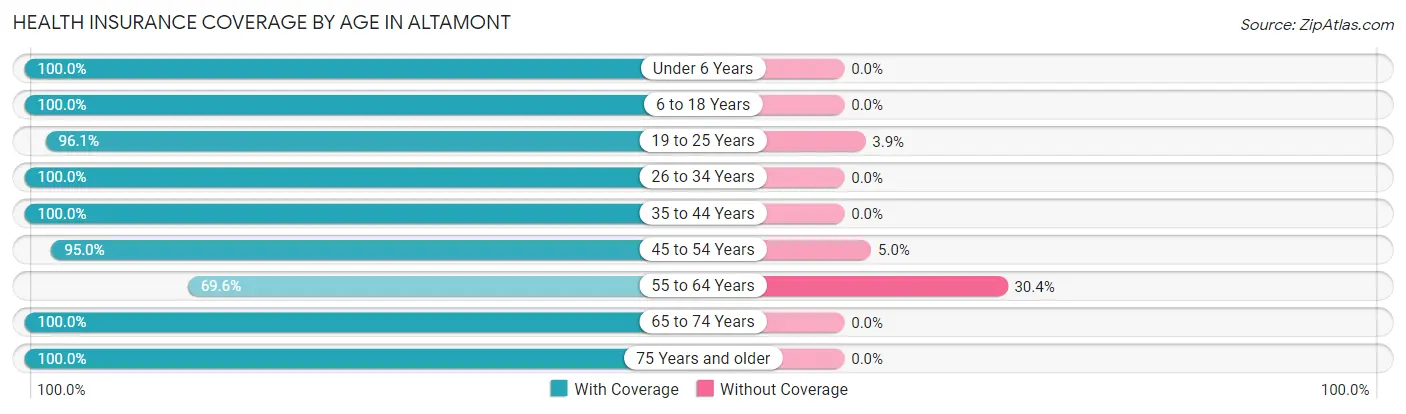
| Age Bracket | With Coverage | Without Coverage |
| Under 6 Years | 78 (100.0%) | 0 (0.0%) |
| 6 to 18 Years | 107 (100.0%) | 0 (0.0%) |
| 19 to 25 Years | 49 (96.1%) | 2 (3.9%) |
| 26 to 34 Years | 55 (100.0%) | 0 (0.0%) |
| 35 to 44 Years | 52 (100.0%) | 0 (0.0%) |
| 45 to 54 Years | 38 (95.0%) | 2 (5.0%) |
| 55 to 64 Years | 16 (69.6%) | 7 (30.4%) |
| 65 to 74 Years | 13 (100.0%) | 0 (0.0%) |
| 75 Years and older | 15 (100.0%) | 0 (0.0%) |
| Total | 423 (97.5%) | 11 (2.5%) |
Health Insurance Coverage by Citizenship Status in Altamont

| Citizenship Status | With Coverage | Without Coverage |
| Native Born | 78 (100.0%) | 0 (0.0%) |
| Foreign Born, Citizen | 107 (100.0%) | 0 (0.0%) |
| Foreign Born, not a Citizen | 49 (96.1%) | 2 (3.9%) |
Health Insurance Coverage by Household Income in Altamont
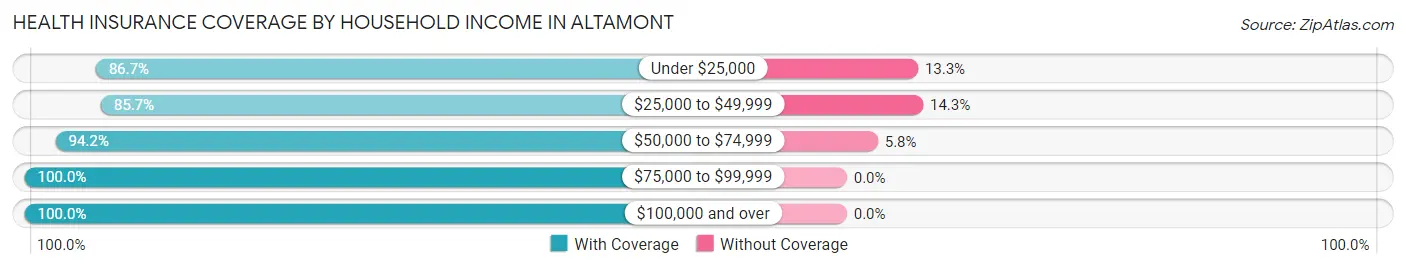
| Household Income | With Coverage | Without Coverage |
| Under $25,000 | 13 (86.7%) | 2 (13.3%) |
| $25,000 to $49,999 | 30 (85.7%) | 5 (14.3%) |
| $50,000 to $74,999 | 65 (94.2%) | 4 (5.8%) |
| $75,000 to $99,999 | 138 (100.0%) | 0 (0.0%) |
| $100,000 and over | 177 (100.0%) | 0 (0.0%) |
Public vs Private Health Insurance Coverage by Age in Altamont
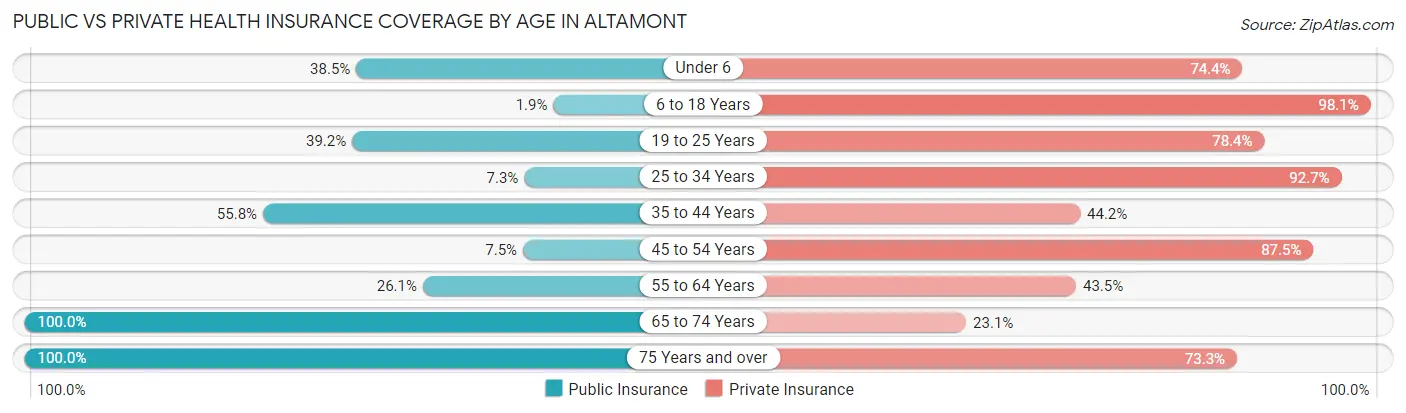
| Age Bracket | Public Insurance | Private Insurance |
| Under 6 | 30 (38.5%) | 58 (74.4%) |
| 6 to 18 Years | 2 (1.9%) | 105 (98.1%) |
| 19 to 25 Years | 20 (39.2%) | 40 (78.4%) |
| 25 to 34 Years | 4 (7.3%) | 51 (92.7%) |
| 35 to 44 Years | 29 (55.8%) | 23 (44.2%) |
| 45 to 54 Years | 3 (7.5%) | 35 (87.5%) |
| 55 to 64 Years | 6 (26.1%) | 10 (43.5%) |
| 65 to 74 Years | 13 (100.0%) | 3 (23.1%) |
| 75 Years and over | 15 (100.0%) | 11 (73.3%) |
| Total | 122 (28.1%) | 336 (77.4%) |
Disability Status by Sex by Age in Altamont
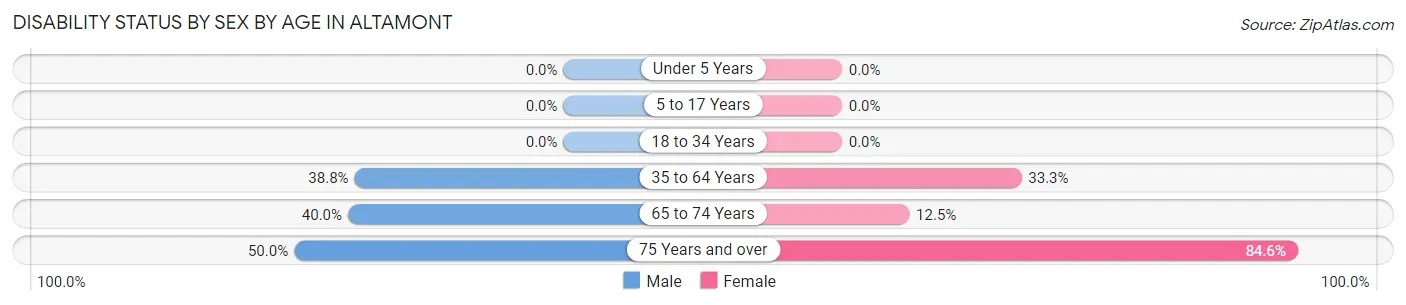
| Age Bracket | Male | Female |
| Under 5 Years | 0 (0.0%) | 0 (0.0%) |
| 5 to 17 Years | 0 (0.0%) | 0 (0.0%) |
| 18 to 34 Years | 0 (0.0%) | 0 (0.0%) |
| 35 to 64 Years | 19 (38.8%) | 22 (33.3%) |
| 65 to 74 Years | 2 (40.0%) | 1 (12.5%) |
| 75 Years and over | 1 (50.0%) | 11 (84.6%) |
Disability Class by Sex by Age in Altamont
Disability Class: Hearing Difficulty
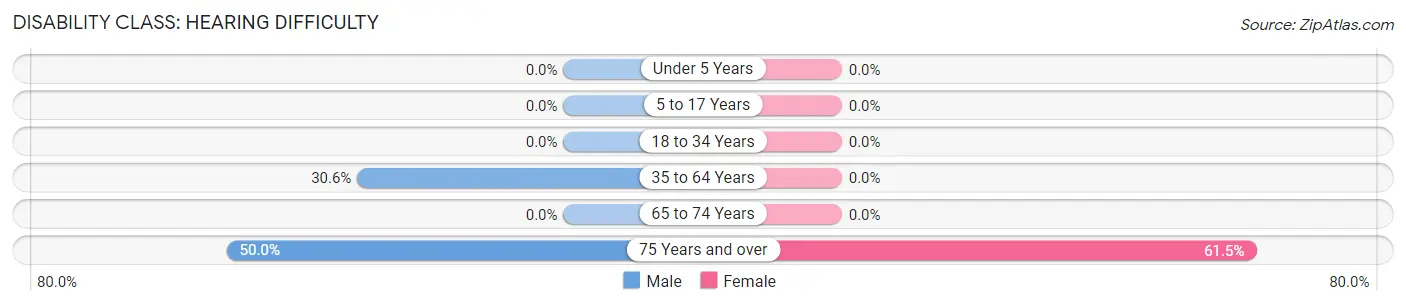
| Age Bracket | Male | Female |
| Under 5 Years | 0 (0.0%) | 0 (0.0%) |
| 5 to 17 Years | 0 (0.0%) | 0 (0.0%) |
| 18 to 34 Years | 0 (0.0%) | 0 (0.0%) |
| 35 to 64 Years | 15 (30.6%) | 0 (0.0%) |
| 65 to 74 Years | 0 (0.0%) | 0 (0.0%) |
| 75 Years and over | 1 (50.0%) | 8 (61.5%) |
Disability Class: Vision Difficulty
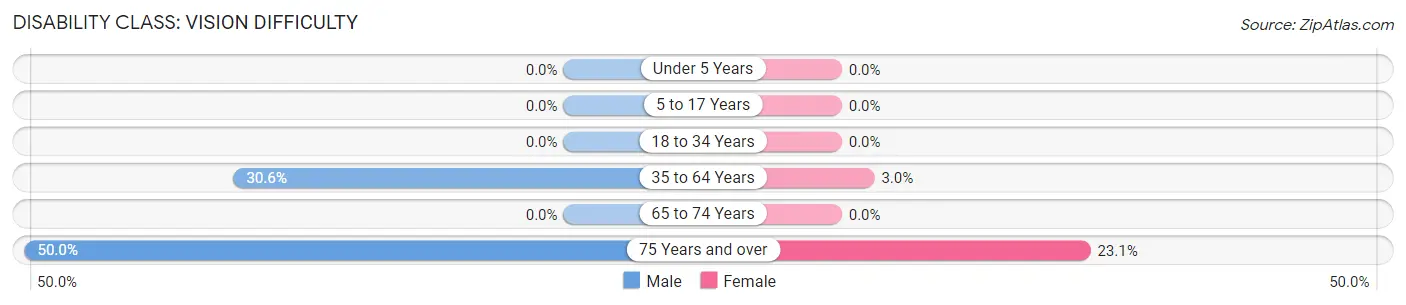
| Age Bracket | Male | Female |
| Under 5 Years | 0 (0.0%) | 0 (0.0%) |
| 5 to 17 Years | 0 (0.0%) | 0 (0.0%) |
| 18 to 34 Years | 0 (0.0%) | 0 (0.0%) |
| 35 to 64 Years | 15 (30.6%) | 2 (3.0%) |
| 65 to 74 Years | 0 (0.0%) | 0 (0.0%) |
| 75 Years and over | 1 (50.0%) | 3 (23.1%) |
Disability Class: Cognitive Difficulty
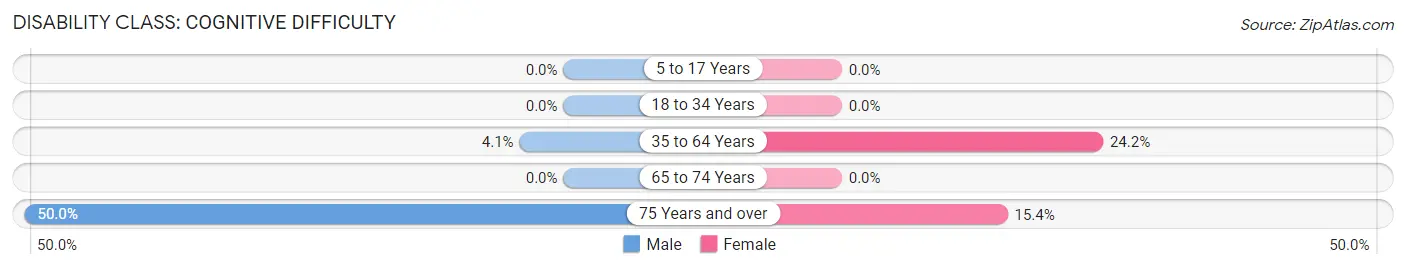
| Age Bracket | Male | Female |
| 5 to 17 Years | 0 (0.0%) | 0 (0.0%) |
| 18 to 34 Years | 0 (0.0%) | 0 (0.0%) |
| 35 to 64 Years | 2 (4.1%) | 16 (24.2%) |
| 65 to 74 Years | 0 (0.0%) | 0 (0.0%) |
| 75 Years and over | 1 (50.0%) | 2 (15.4%) |
Disability Class: Ambulatory Difficulty
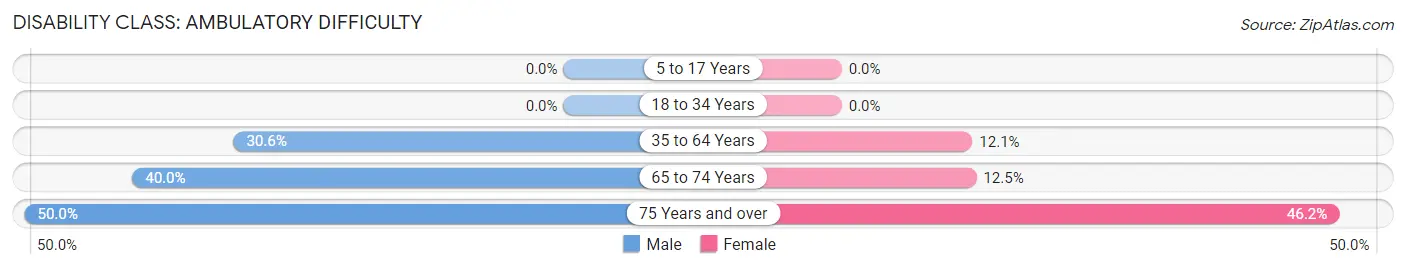
| Age Bracket | Male | Female |
| 5 to 17 Years | 0 (0.0%) | 0 (0.0%) |
| 18 to 34 Years | 0 (0.0%) | 0 (0.0%) |
| 35 to 64 Years | 15 (30.6%) | 8 (12.1%) |
| 65 to 74 Years | 2 (40.0%) | 1 (12.5%) |
| 75 Years and over | 1 (50.0%) | 6 (46.2%) |
Disability Class: Self-Care Difficulty
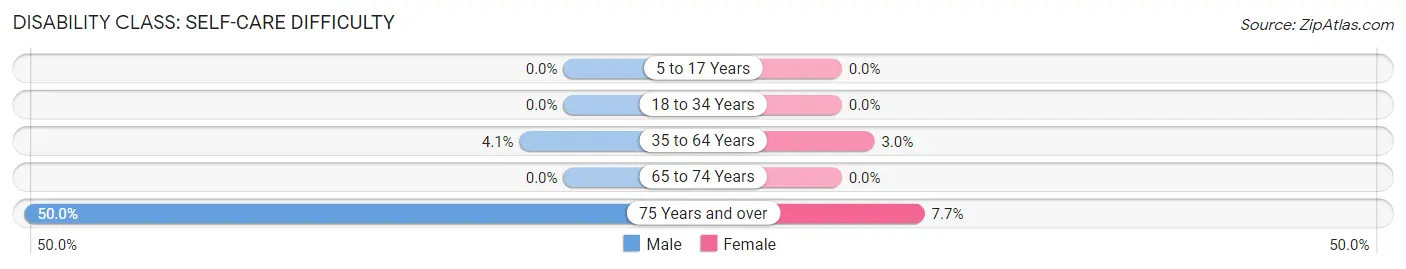
| Age Bracket | Male | Female |
| 5 to 17 Years | 0 (0.0%) | 0 (0.0%) |
| 18 to 34 Years | 0 (0.0%) | 0 (0.0%) |
| 35 to 64 Years | 2 (4.1%) | 2 (3.0%) |
| 65 to 74 Years | 0 (0.0%) | 0 (0.0%) |
| 75 Years and over | 1 (50.0%) | 1 (7.7%) |
Technology Access in Altamont
Computing Device Access in Altamont
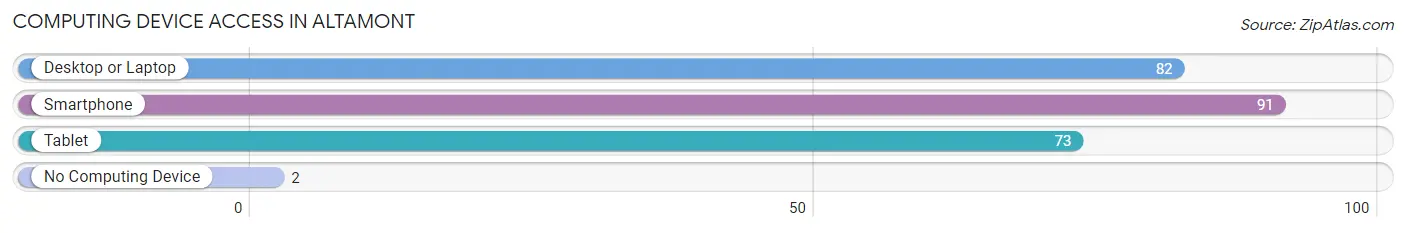
| Device Type | # Households | % Households |
| Desktop or Laptop | 82 | 86.3% |
| Smartphone | 91 | 95.8% |
| Tablet | 73 | 76.8% |
| No Computing Device | 2 | 2.1% |
| Total | 95 | 100.0% |
Internet Access in Altamont

| Internet Type | # Households | % Households |
| Dial-Up Internet | 0 | 0.0% |
| Broadband Home | 89 | 93.7% |
| Cellular Data Only | 2 | 2.1% |
| Satellite Internet | 5 | 5.3% |
| No Internet | 2 | 2.1% |
| Total | 95 | 100.0% |
Altamont Summary
Altamont, Utah is a small town located in the northeastern corner of the state, near the border of Wyoming. It is situated in the Uinta Basin, a region of the state known for its vast expanses of open land and its abundance of natural resources. The town is home to just over 500 people, and is the county seat of Duchesne County.
History
The area that is now Altamont was first settled in the late 1800s by Mormon pioneers. The town was originally known as “Uintah”, and was later renamed “Altamont” in honor of the nearby mountain range. The town was officially incorporated in 1909, and has remained a small, rural community ever since.
Geography
Altamont is located in the Uinta Basin, a region of the state known for its vast expanses of open land and its abundance of natural resources. The town is situated at an elevation of 5,890 feet, and is surrounded by the Uinta Mountains to the east and the Wasatch Mountains to the west. The town is located near the junction of U.S. Route 40 and Utah State Route 87, and is approximately 80 miles east of Salt Lake City.
Economy
The economy of Altamont is largely based on agriculture and ranching. The town is home to several large farms and ranches, and the surrounding area is known for its production of hay, wheat, and other crops. The town is also home to several small businesses, including a grocery store, a hardware store, and a few restaurants.
Demographics
As of the 2010 census, the population of Altamont was 517. The racial makeup of the town was 95.2% White, 0.4% African American, 0.4% Native American, 0.2% Asian, 0.2% Pacific Islander, and 3.6% from two or more races. The median household income was $37,500, and the median age was 37.
Altamont is a small, rural town with a rich history and a strong sense of community. The town is home to a diverse population, and is known for its abundance of natural resources and its strong agricultural economy. Despite its small size, Altamont is a vibrant and welcoming community, and is a great place to call home.
Common Questions
What is Per Capita Income in Altamont?
Per Capita income in Altamont is $20,352.
What is the Median Family Income in Altamont?
Median Family Income in Altamont is $92,273.
What is the Median Household income in Altamont?
Median Household Income in Altamont is $91,250.
What is Family Income Deficit in Altamont?
Family Income Deficit in Altamont is $10,200.
Families that are below poverty line in Altamont earn $10,200 less on average than the poverty threshold level.
What is Inequality or Gini Index in Altamont?
Inequality or Gini Index in Altamont is 0.29.
What is the Total Population of Altamont?
Total Population of Altamont is 434.
What is the Total Male Population of Altamont?
Total Male Population of Altamont is 184.
What is the Total Female Population of Altamont?
Total Female Population of Altamont is 250.
What is the Ratio of Males per 100 Females in Altamont?
There are 73.60 Males per 100 Females in Altamont.
What is the Ratio of Females per 100 Males in Altamont?
There are 135.87 Females per 100 Males in Altamont.
What is the Median Population Age in Altamont?
Median Population Age in Altamont is 23.5 Years.
What is the Average Family Size in Altamont
Average Family Size in Altamont is 5.7 People.
What is the Average Household Size in Altamont
Average Household Size in Altamont is 4.6 People.
How Large is the Labor Force in Altamont?
There are 166 People in the Labor Forcein in Altamont.
What is the Percentage of People in the Labor Force in Altamont?
60.4% of People are in the Labor Force in Altamont.
What is the Unemployment Rate in Altamont?
Unemployment Rate in Altamont is 5.4%.