Zip Codes with the Highest Percentage of Population Employed in Life, Physical & Social Science in Garland, TX
RELATED REPORTS & OPTIONS
Life, Physical & Social Science
Garland
Compare Zip Codes
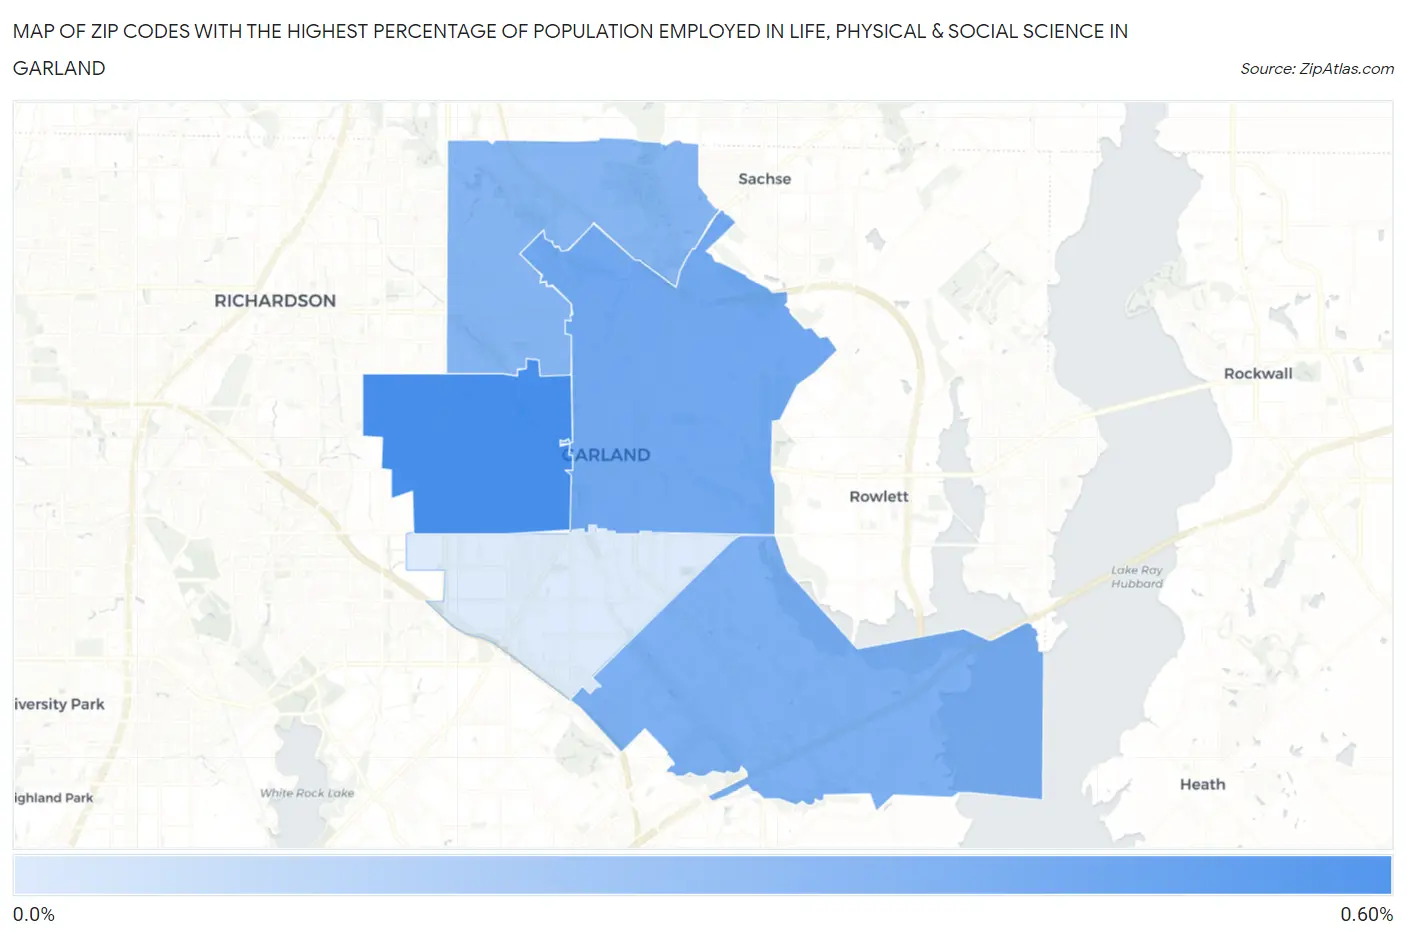
Map of Zip Codes with the Highest Percentage of Population Employed in Life, Physical & Social Science in Garland
0.039%
0.52%
Zip Codes with the Highest Percentage of Population Employed in Life, Physical & Social Science in Garland, TX
| Zip Code | % Employed | vs State | vs National | |
| 1. | 75042 | 0.52% | 0.84%(-0.321)#714 | 1.1%(-0.569)#14,252 |
| 2. | 75040 | 0.39% | 0.84%(-0.457)#838 | 1.1%(-0.705)#15,938 |
| 3. | 75043 | 0.35% | 0.84%(-0.490)#866 | 1.1%(-0.738)#16,373 |
| 4. | 75044 | 0.32% | 0.84%(-0.521)#894 | 1.1%(-0.770)#16,790 |
| 5. | 75041 | 0.039% | 0.84%(-0.804)#1,119 | 1.1%(-1.05)#19,374 |
1
Common Questions
What are the Top 3 Zip Codes with the Highest Percentage of Population Employed in Life, Physical & Social Science in Garland, TX?
Top 3 Zip Codes with the Highest Percentage of Population Employed in Life, Physical & Social Science in Garland, TX are:
What zip code has the Highest Percentage of Population Employed in Life, Physical & Social Science in Garland, TX?
75042 has the Highest Percentage of Population Employed in Life, Physical & Social Science in Garland, TX with 0.52%.
What is the Percentage of Population Employed in Life, Physical & Social Science in Garland, TX?
Percentage of Population Employed in Life, Physical & Social Science in Garland is 0.34%.
What is the Percentage of Population Employed in Life, Physical & Social Science in Texas?
Percentage of Population Employed in Life, Physical & Social Science in Texas is 0.84%.
What is the Percentage of Population Employed in Life, Physical & Social Science in the United States?
Percentage of Population Employed in Life, Physical & Social Science in the United States is 1.1%.