Zip Codes with the Highest Percentage of Population Employed in Administrative & Support Services in Mount Pleasant, SC
RELATED REPORTS & OPTIONS
Administrative & Support Services
Mount Pleasant
Compare Zip Codes
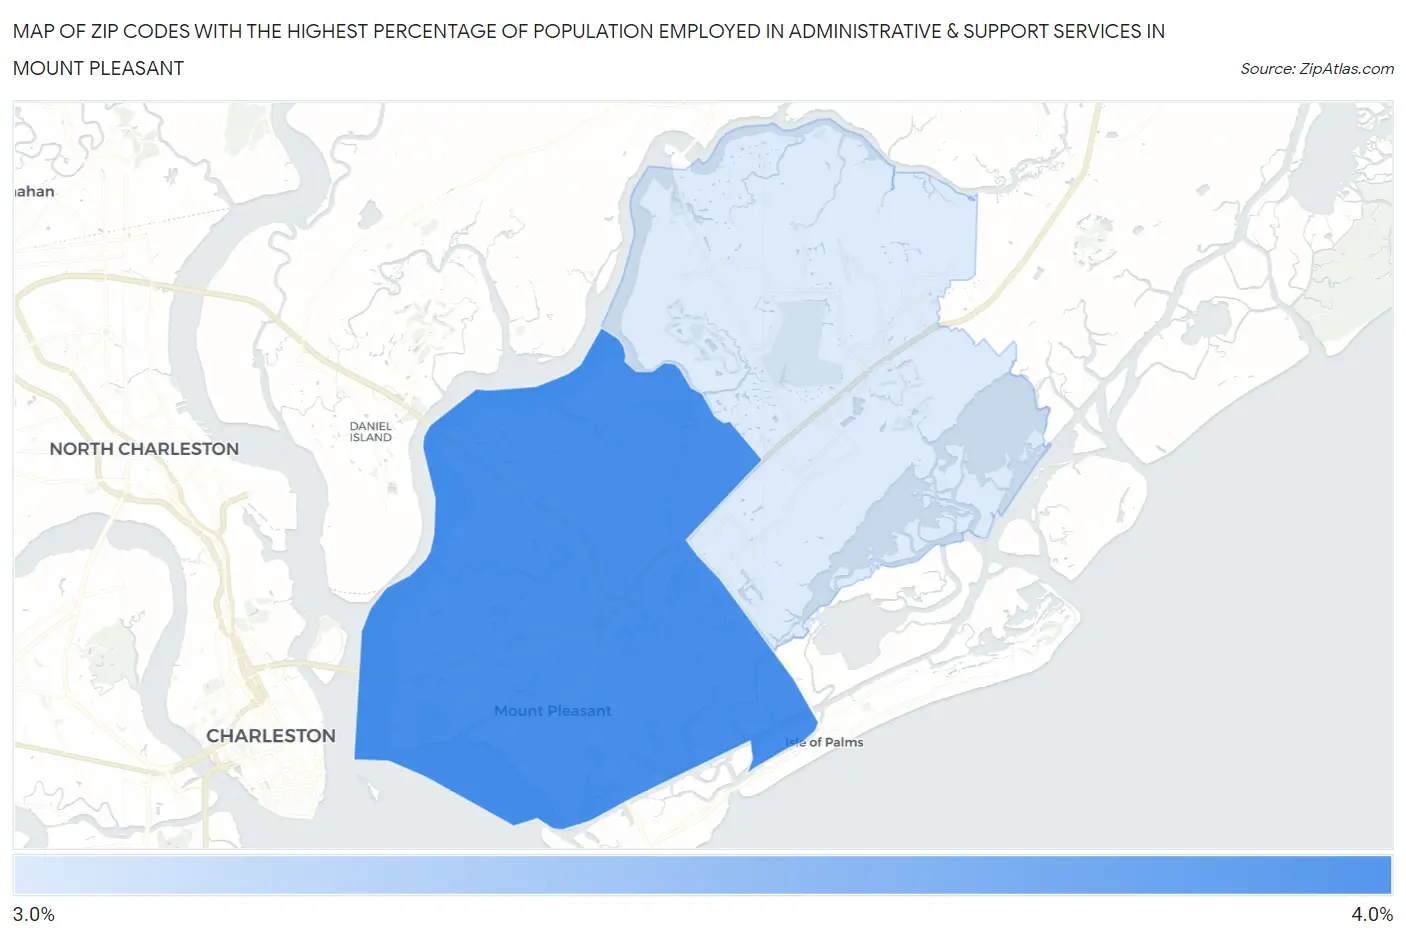
Map of Zip Codes with the Highest Percentage of Population Employed in Administrative & Support Services in Mount Pleasant
3.8%
4.0%
Zip Codes with the Highest Percentage of Population Employed in Administrative & Support Services in Mount Pleasant, SC
| Zip Code | % Employed | vs State | vs National | |
| 1. | 29464 | 4.0% | 4.8%(-0.844)#229 | 4.1%(-0.150)#10,702 |
| 2. | 29466 | 3.8% | 4.8%(-1.08)#244 | 4.1%(-0.388)#11,707 |
1
Common Questions
What are the Top Zip Codes with the Highest Percentage of Population Employed in Administrative & Support Services in Mount Pleasant, SC?
Top Zip Codes with the Highest Percentage of Population Employed in Administrative & Support Services in Mount Pleasant, SC are:
What zip code has the Highest Percentage of Population Employed in Administrative & Support Services in Mount Pleasant, SC?
29464 has the Highest Percentage of Population Employed in Administrative & Support Services in Mount Pleasant, SC with 4.0%.
What is the Percentage of Population Employed in Administrative & Support Services in Mount Pleasant, SC?
Percentage of Population Employed in Administrative & Support Services in Mount Pleasant is 3.9%.
What is the Percentage of Population Employed in Administrative & Support Services in South Carolina?
Percentage of Population Employed in Administrative & Support Services in South Carolina is 4.8%.
What is the Percentage of Population Employed in Administrative & Support Services in the United States?
Percentage of Population Employed in Administrative & Support Services in the United States is 4.1%.