Zip Codes with the Highest Percentage of Households Heated by Bottled Gas / Liquid Propane in Seneca, SC
RELATED REPORTS & OPTIONS
Bottled Gas / LP Heating
Seneca
Compare Zip Codes
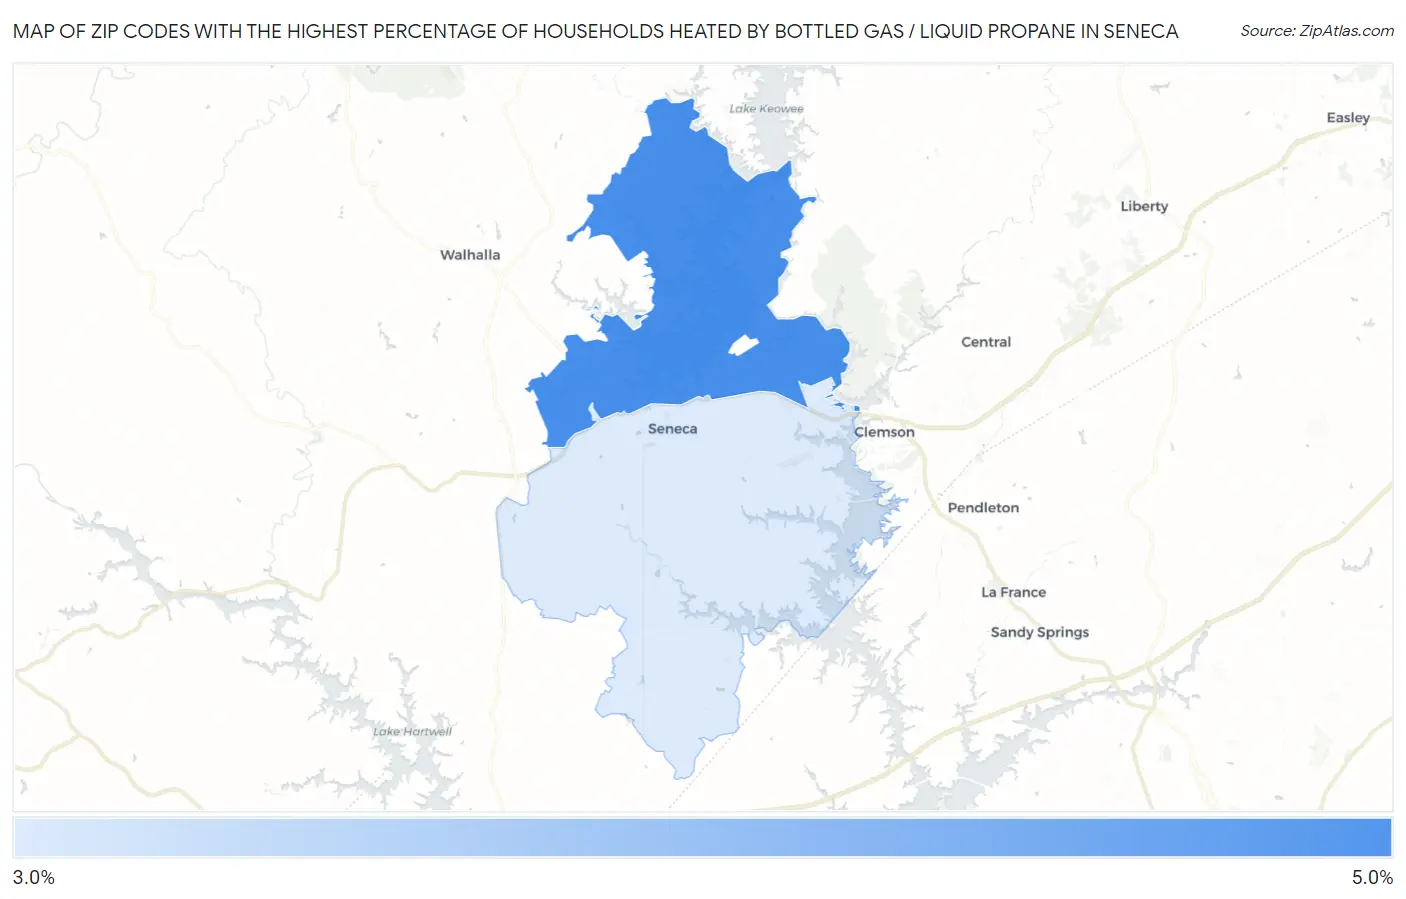
Map of Zip Codes with the Highest Percentage of Households Heated by Bottled Gas / Liquid Propane in Seneca
0.0%
5.0%
Zip Codes with the Highest Percentage of Households Heated by Bottled Gas / Liquid Propane in Seneca, SC
| Zip Code | Bottled Gas / LP Heating | vs State | vs National | |
| 1. | 29672 | 4.6% | 3.4%(+1.20)#215 | 4.9%(-0.300)#18,984 |
| 2. | 29678 | 3.4% | 3.4%(=0.000)#250 | 4.9%(-1.50)#20,373 |
1
Common Questions
What are the Top Zip Codes with the Highest Percentage of Households Heated by Bottled Gas / Liquid Propane in Seneca, SC?
Top Zip Codes with the Highest Percentage of Households Heated by Bottled Gas / Liquid Propane in Seneca, SC are:
What zip code has the Highest Percentage of Households Heated by Bottled Gas / Liquid Propane in Seneca, SC?
29672 has the Highest Percentage of Households Heated by Bottled Gas / Liquid Propane in Seneca, SC with 4.6%.
What is the Percentage of Households Heated by Bottled Gas / Liquid Propane in Seneca, SC?
Percentage of Households Heated by Bottled Gas / Liquid Propane in Seneca is 0.40%.
What is the Percentage of Households Heated by Bottled Gas / Liquid Propane in South Carolina?
Percentage of Households Heated by Bottled Gas / Liquid Propane in South Carolina is 3.4%.
What is the Percentage of Households Heated by Bottled Gas / Liquid Propane in the United States?
Percentage of Households Heated by Bottled Gas / Liquid Propane in the United States is 4.9%.