Zip Codes with the Highest Percentage of Population Employed in Sales & Related in Orangeburg, SC
RELATED REPORTS & OPTIONS
Sales & Related
Orangeburg
Compare Zip Codes
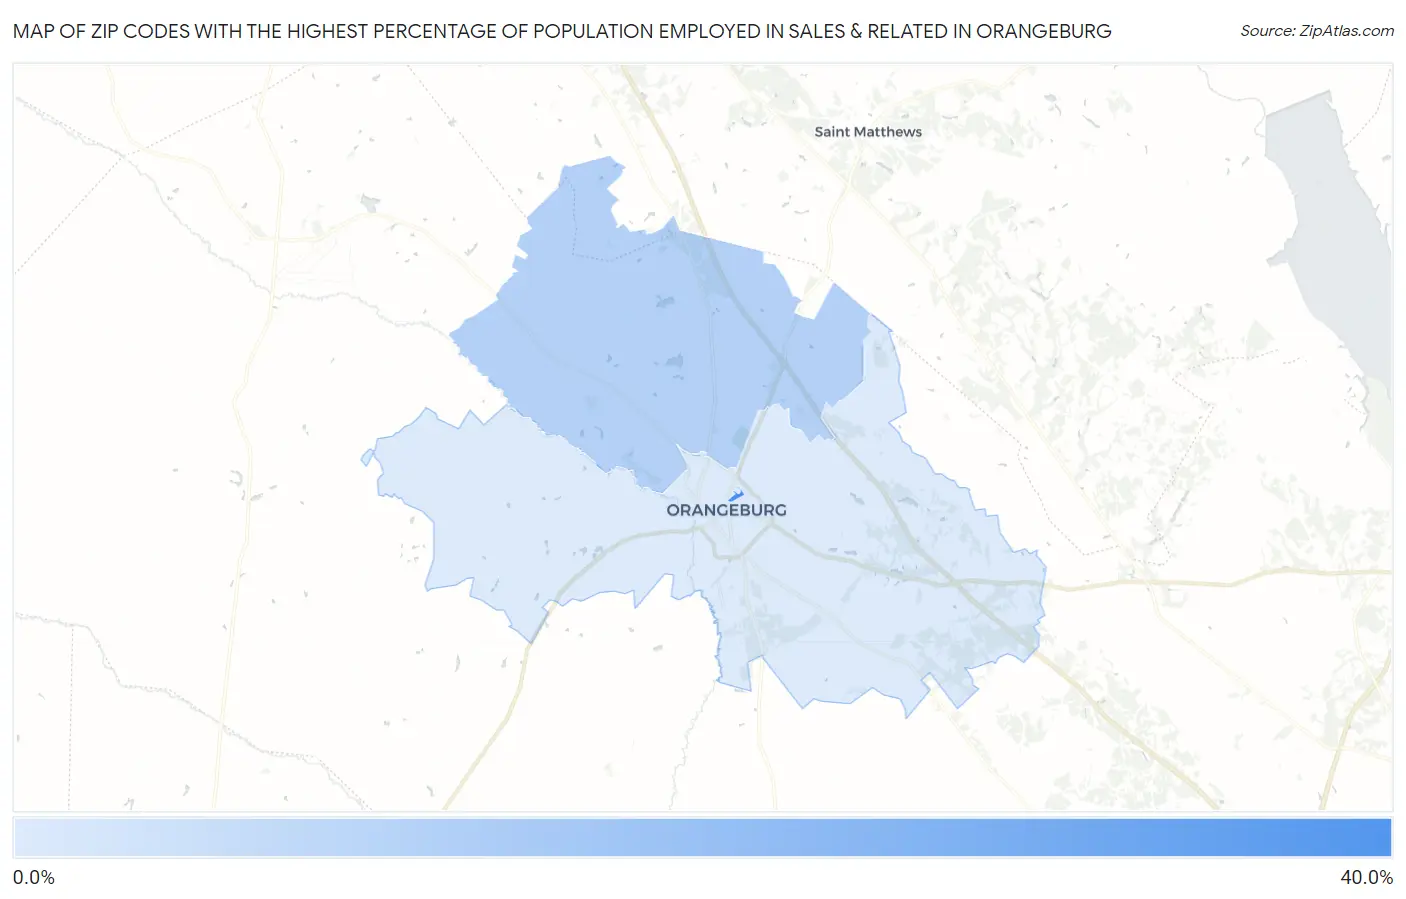
Map of Zip Codes with the Highest Percentage of Population Employed in Sales & Related in Orangeburg
8.9%
32.0%
Zip Codes with the Highest Percentage of Population Employed in Sales & Related in Orangeburg, SC
| Zip Code | % Employed | vs State | vs National | |
| 1. | 29117 | 32.0% | 10.4%(+21.6)#3 | 9.6%(+22.4)#344 |
| 2. | 29118 | 14.7% | 10.4%(+4.35)#50 | 9.6%(+5.14)#2,911 |
| 3. | 29115 | 8.9% | 10.4%(-1.45)#222 | 9.6%(-0.662)#14,763 |
1
Common Questions
What are the Top Zip Codes with the Highest Percentage of Population Employed in Sales & Related in Orangeburg, SC?
Top Zip Codes with the Highest Percentage of Population Employed in Sales & Related in Orangeburg, SC are:
What zip code has the Highest Percentage of Population Employed in Sales & Related in Orangeburg, SC?
29117 has the Highest Percentage of Population Employed in Sales & Related in Orangeburg, SC with 32.0%.
What is the Percentage of Population Employed in Sales & Related in Orangeburg, SC?
Percentage of Population Employed in Sales & Related in Orangeburg is 13.4%.
What is the Percentage of Population Employed in Sales & Related in South Carolina?
Percentage of Population Employed in Sales & Related in South Carolina is 10.4%.
What is the Percentage of Population Employed in Sales & Related in the United States?
Percentage of Population Employed in Sales & Related in the United States is 9.6%.