Zip Codes with the Highest Percentage of Population Employed in Sales & Related in Conway, SC
RELATED REPORTS & OPTIONS
Sales & Related
Conway
Compare Zip Codes
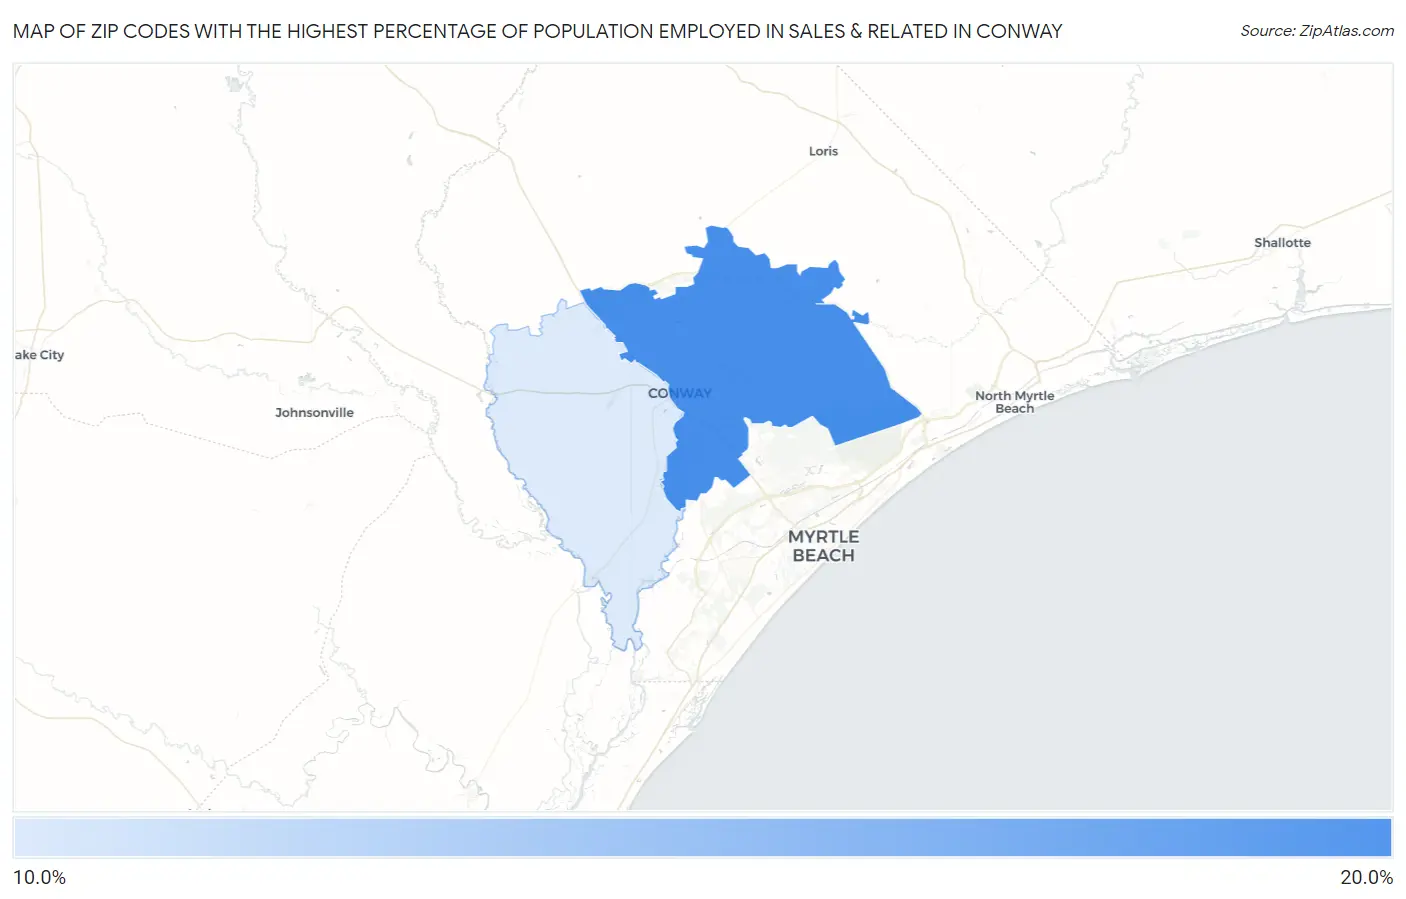
Map of Zip Codes with the Highest Percentage of Population Employed in Sales & Related in Conway
13.1%
15.5%
Zip Codes with the Highest Percentage of Population Employed in Sales & Related in Conway, SC
| Zip Code | % Employed | vs State | vs National | |
| 1. | 29526 | 15.5% | 10.4%(+5.07)#42 | 9.6%(+5.86)#2,494 |
| 2. | 29527 | 13.1% | 10.4%(+2.73)#81 | 9.6%(+3.51)#4,370 |
1
Common Questions
What are the Top Zip Codes with the Highest Percentage of Population Employed in Sales & Related in Conway, SC?
Top Zip Codes with the Highest Percentage of Population Employed in Sales & Related in Conway, SC are:
What zip code has the Highest Percentage of Population Employed in Sales & Related in Conway, SC?
29526 has the Highest Percentage of Population Employed in Sales & Related in Conway, SC with 15.5%.
What is the Percentage of Population Employed in Sales & Related in Conway, SC?
Percentage of Population Employed in Sales & Related in Conway is 14.5%.
What is the Percentage of Population Employed in Sales & Related in South Carolina?
Percentage of Population Employed in Sales & Related in South Carolina is 10.4%.
What is the Percentage of Population Employed in Sales & Related in the United States?
Percentage of Population Employed in Sales & Related in the United States is 9.6%.