Zip Codes with the Highest Percentage of Population Employed in Professional & Scientific Services in San Juan, PR
RELATED REPORTS & OPTIONS
Professional & Scientific Services
San Juan
Compare Zip Codes
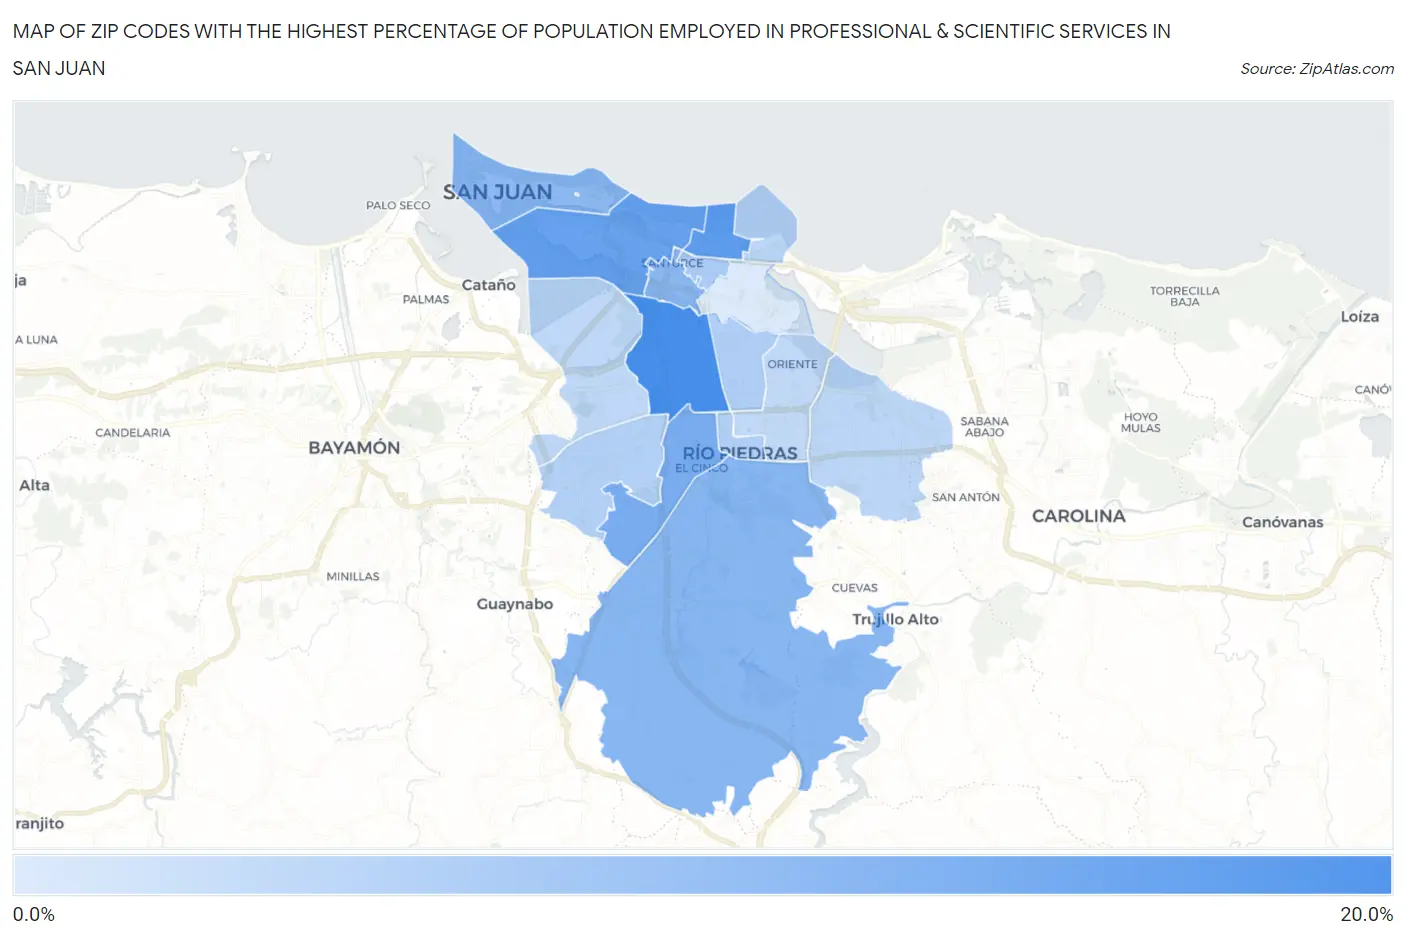
Map of Zip Codes with the Highest Percentage of Population Employed in Professional & Scientific Services in San Juan
0.0%
20.0%
Zip Codes with the Highest Percentage of Population Employed in Professional & Scientific Services in San Juan, PR
| Zip Code | % Employed | vs State | vs National | |
| 1. | 00918 | 18.2% | 4.5%(+13.7)#3 | 7.8%(+10.3)#1,135 |
| 2. | 00911 | 15.3% | 4.5%(+10.8)#4 | 7.8%(+7.47)#1,795 |
| 3. | 00907 | 14.4% | 4.5%(+9.88)#5 | 7.8%(+6.50)#2,141 |
| 4. | 00927 | 12.1% | 4.5%(+7.59)#8 | 7.8%(+4.22)#3,159 |
| 5. | 00926 | 10.6% | 4.5%(+6.10)#10 | 7.8%(+2.72)#4,121 |
| 6. | 00909 | 10.2% | 4.5%(+5.77)#11 | 7.8%(+2.40)#4,389 |
| 7. | 00901 | 10.1% | 4.5%(+5.67)#12 | 7.8%(+2.29)#4,470 |
| 8. | 00906 | 8.2% | 4.5%(+3.69)#14 | 7.8%(+0.316)#6,454 |
| 9. | 00912 | 6.8% | 4.5%(+2.31)#17 | 7.8%(-1.06)#8,513 |
| 10. | 00917 | 6.3% | 4.5%(+1.87)#20 | 7.8%(-1.50)#9,302 |
| 11. | 00925 | 6.1% | 4.5%(+1.59)#21 | 7.8%(-1.78)#9,848 |
| 12. | 00921 | 5.9% | 4.5%(+1.38)#22 | 7.8%(-1.99)#10,251 |
| 13. | 00913 | 5.0% | 4.5%(+0.480)#32 | 7.8%(-2.89)#12,437 |
| 14. | 00924 | 4.8% | 4.5%(+0.343)#34 | 7.8%(-3.03)#12,778 |
| 15. | 00920 | 4.6% | 4.5%(+0.086)#38 | 7.8%(-3.29)#13,480 |
| 16. | 00923 | 4.2% | 4.5%(-0.301)#47 | 7.8%(-3.67)#14,609 |
| 17. | 00915 | 1.4% | 4.5%(-3.12)#102 | 7.8%(-6.50)#24,024 |
1
Common Questions
What are the Top 10 Zip Codes with the Highest Percentage of Population Employed in Professional & Scientific Services in San Juan, PR?
Top 10 Zip Codes with the Highest Percentage of Population Employed in Professional & Scientific Services in San Juan, PR are:
What zip code has the Highest Percentage of Population Employed in Professional & Scientific Services in San Juan, PR?
00918 has the Highest Percentage of Population Employed in Professional & Scientific Services in San Juan, PR with 18.2%.
What is the Percentage of Population Employed in Professional & Scientific Services in San Juan, PR?
Percentage of Population Employed in Professional & Scientific Services in San Juan is 9.0%.
What is the Percentage of Population Employed in Professional & Scientific Services in Puerto Rico?
Percentage of Population Employed in Professional & Scientific Services in Puerto Rico is 4.5%.
What is the Percentage of Population Employed in Professional & Scientific Services in the United States?
Percentage of Population Employed in Professional & Scientific Services in the United States is 7.8%.