Zip Codes with the Highest Percentage of Population Employed in Farming, Fishing & Forestry in San Juan, PR
RELATED REPORTS & OPTIONS
Farming, Fishing & Forestry
San Juan
Compare Zip Codes
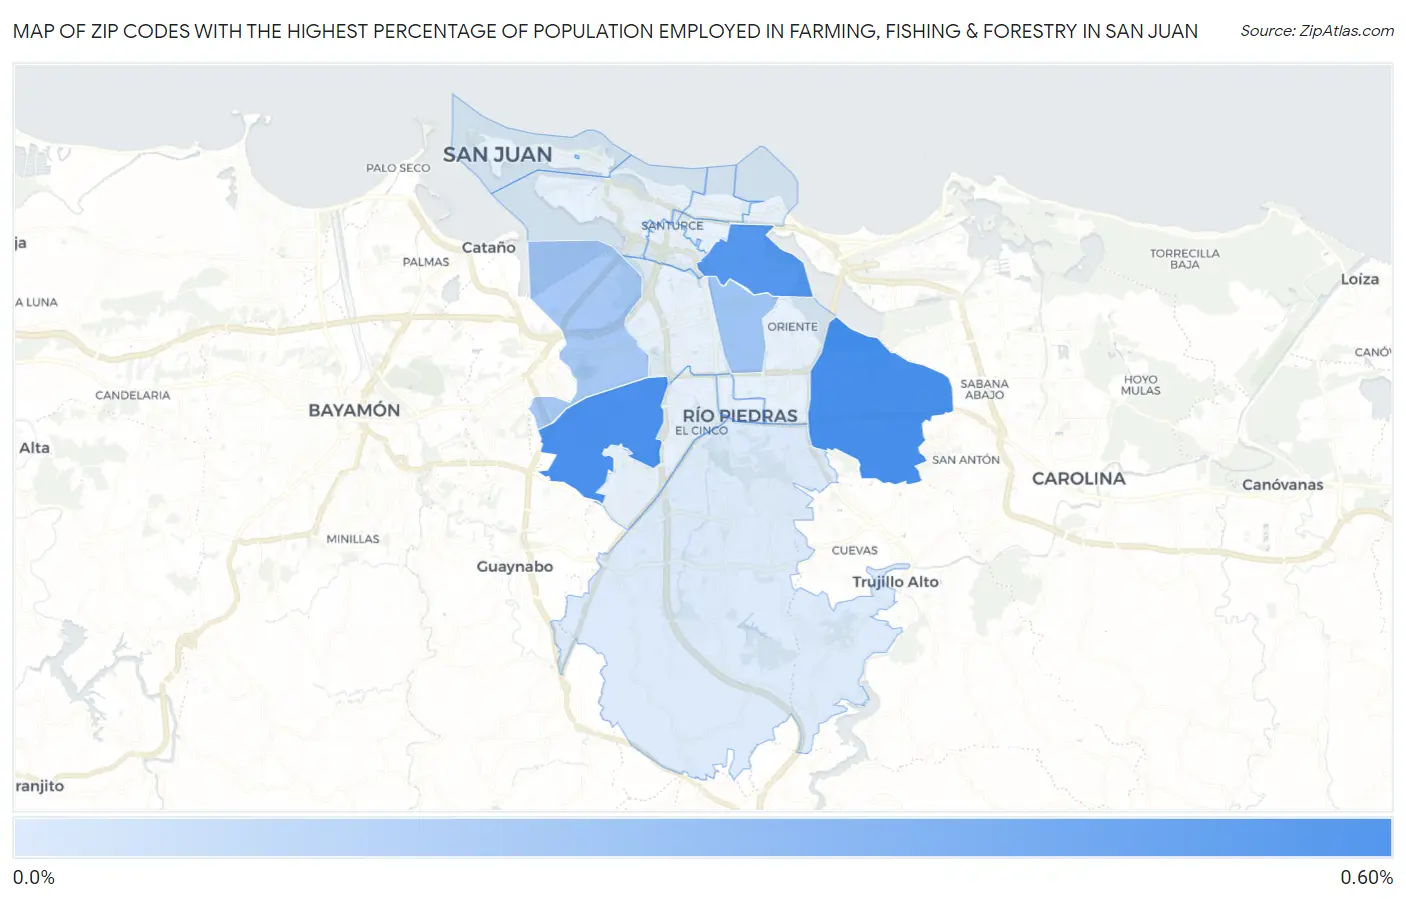
Map of Zip Codes with the Highest Percentage of Population Employed in Farming, Fishing & Forestry in San Juan
0.0%
0.60%
Zip Codes with the Highest Percentage of Population Employed in Farming, Fishing & Forestry in San Juan, PR
| Zip Code | % Employed | vs State | vs National | |
| 1. | 00924 | 0.51% | 0.83%(-0.322)#64 | 0.61%(-0.094)#12,744 |
| 2. | 00921 | 0.50% | 0.83%(-0.330)#66 | 0.61%(-0.102)#12,814 |
| 3. | 00915 | 0.47% | 0.83%(-0.366)#67 | 0.61%(-0.138)#13,121 |
| 4. | 00917 | 0.22% | 0.83%(-0.612)#79 | 0.61%(-0.385)#15,827 |
| 5. | 00920 | 0.20% | 0.83%(-0.635)#82 | 0.61%(-0.407)#16,158 |
| 6. | 00926 | 0.021% | 0.83%(-0.812)#97 | 0.61%(-0.585)#19,069 |
1
Common Questions
What are the Top 10 Zip Codes with the Highest Percentage of Population Employed in Farming, Fishing & Forestry in San Juan, PR?
Top 10 Zip Codes with the Highest Percentage of Population Employed in Farming, Fishing & Forestry in San Juan, PR are:
What zip code has the Highest Percentage of Population Employed in Farming, Fishing & Forestry in San Juan, PR?
00924 has the Highest Percentage of Population Employed in Farming, Fishing & Forestry in San Juan, PR with 0.51%.
What is the Percentage of Population Employed in Farming, Fishing & Forestry in San Juan, PR?
Percentage of Population Employed in Farming, Fishing & Forestry in San Juan is 0.15%.
What is the Percentage of Population Employed in Farming, Fishing & Forestry in Puerto Rico?
Percentage of Population Employed in Farming, Fishing & Forestry in Puerto Rico is 0.83%.
What is the Percentage of Population Employed in Farming, Fishing & Forestry in the United States?
Percentage of Population Employed in Farming, Fishing & Forestry in the United States is 0.61%.