Zip Codes with the Highest Percentage of Population Employed in Agriculture, Fishing & Hunting in Genesee, PA
RELATED REPORTS & OPTIONS
Agriculture, Fishing & Hunting
Genesee
Compare Zip Codes
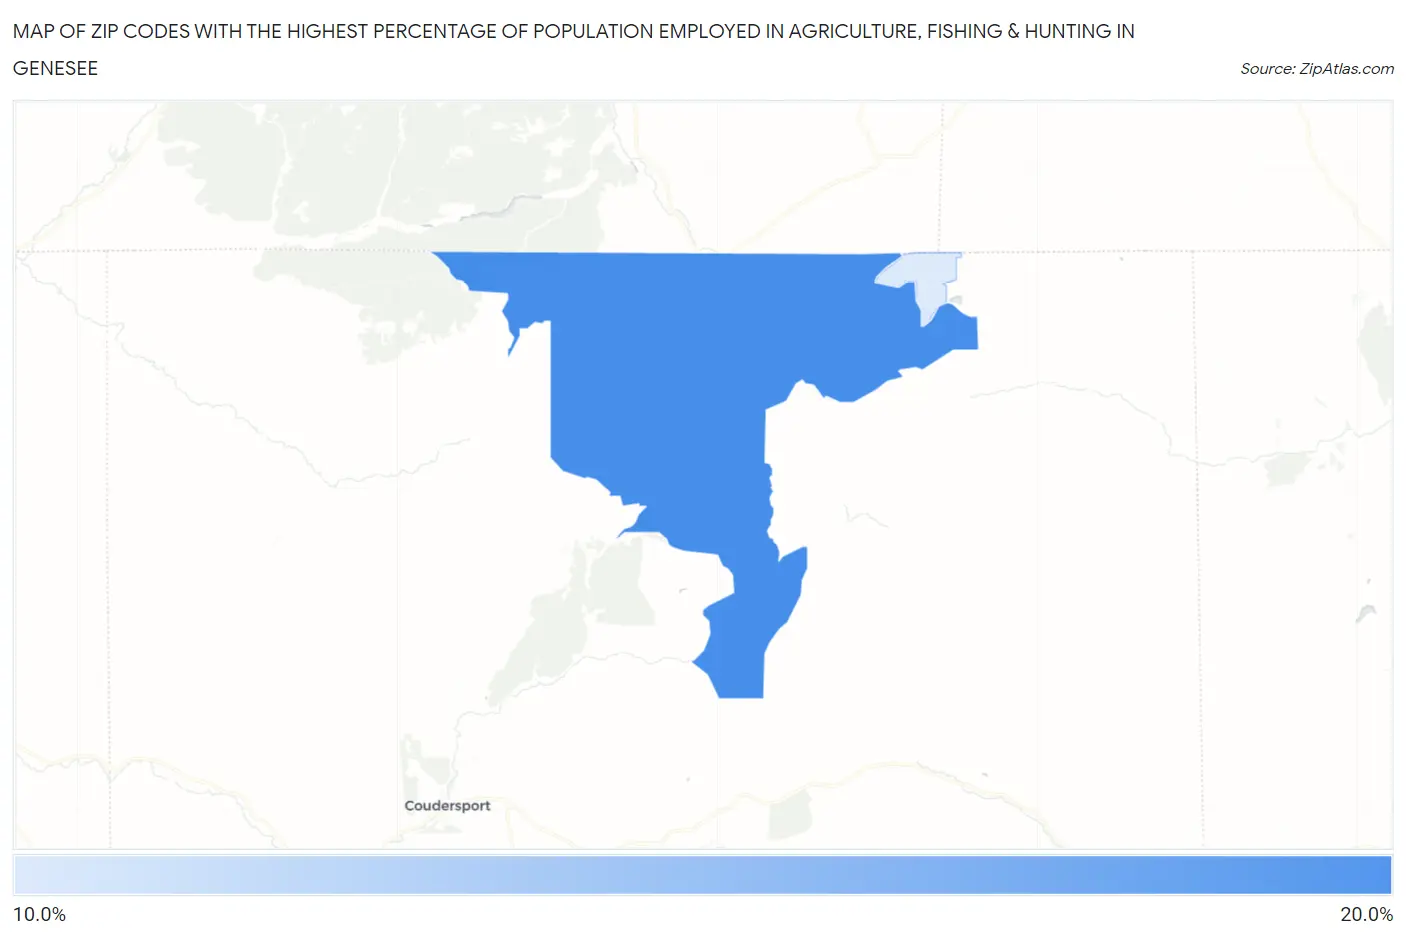
Map of Zip Codes with the Highest Percentage of Population Employed in Agriculture, Fishing & Hunting in Genesee
0.0%
20.0%
Zip Codes with the Highest Percentage of Population Employed in Agriculture, Fishing & Hunting in Genesee, PA
| Zip Code | % Employed | vs State | vs National | |
| 1. | 16923 | 20.0% | 0.87%(+19.1)#13 | 1.2%(+18.8)#1,763 |
| 2. | 16941 | 14.7% | 0.87%(+13.8)#25 | 1.2%(+13.5)#2,710 |
1
Common Questions
What are the Top Zip Codes with the Highest Percentage of Population Employed in Agriculture, Fishing & Hunting in Genesee, PA?
Top Zip Codes with the Highest Percentage of Population Employed in Agriculture, Fishing & Hunting in Genesee, PA are:
What zip code has the Highest Percentage of Population Employed in Agriculture, Fishing & Hunting in Genesee, PA?
16923 has the Highest Percentage of Population Employed in Agriculture, Fishing & Hunting in Genesee, PA with 20.0%.
What is the Percentage of Population Employed in Agriculture, Fishing & Hunting in Pennsylvania?
Percentage of Population Employed in Agriculture, Fishing & Hunting in Pennsylvania is 0.87%.
What is the Percentage of Population Employed in Agriculture, Fishing & Hunting in the United States?
Percentage of Population Employed in Agriculture, Fishing & Hunting in the United States is 1.2%.