Zip Codes with the Highest Percentage of Population Employed in Sales & Related in Roseburg, OR
RELATED REPORTS & OPTIONS
Sales & Related
Roseburg
Compare Zip Codes
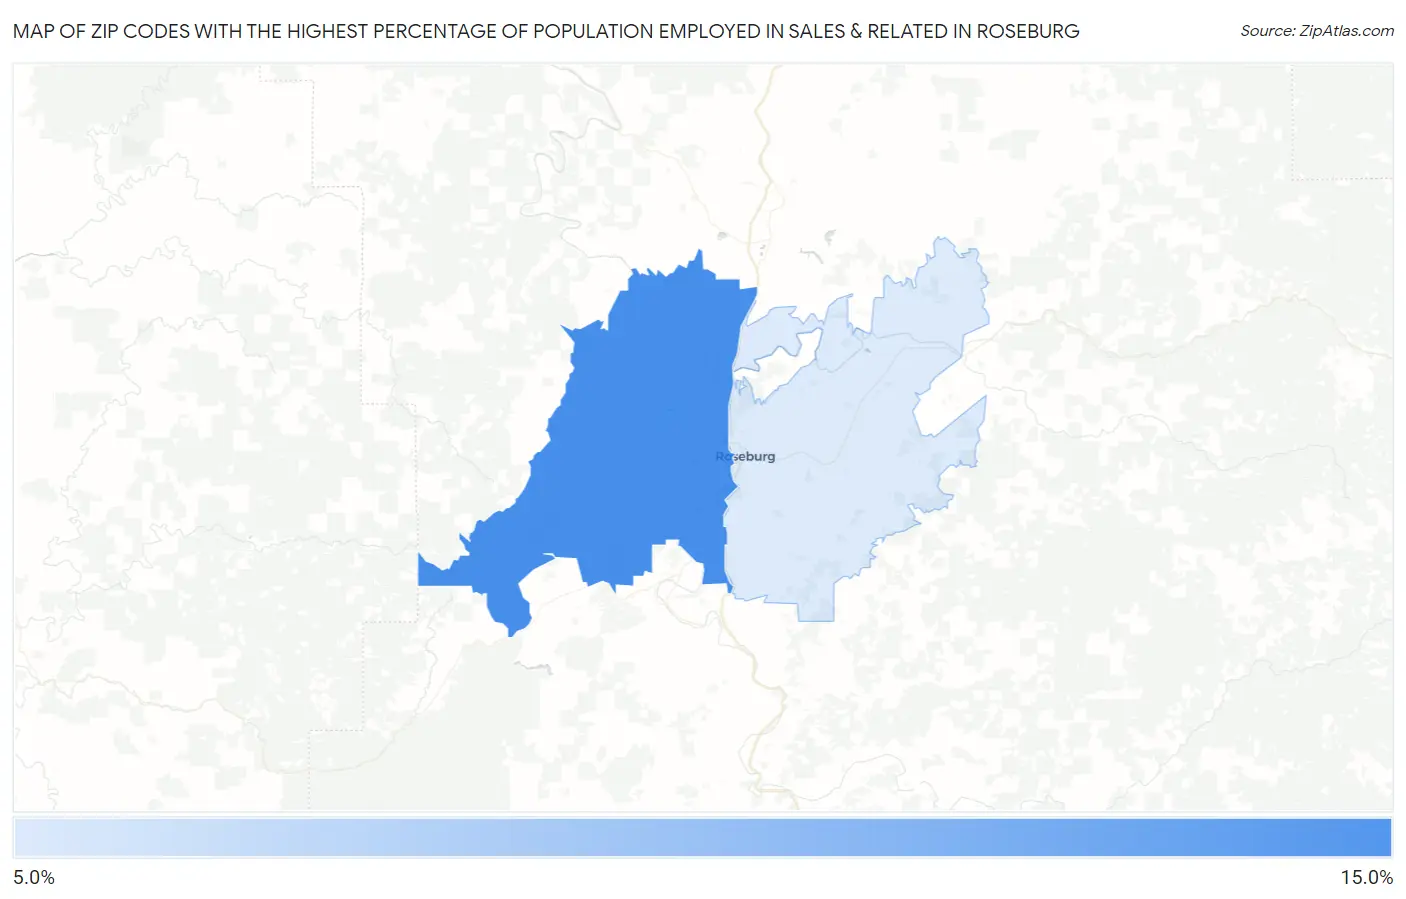
Map of Zip Codes with the Highest Percentage of Population Employed in Sales & Related in Roseburg
7.7%
11.3%
Zip Codes with the Highest Percentage of Population Employed in Sales & Related in Roseburg, OR
| Zip Code | % Employed | vs State | vs National | |
| 1. | 97471 | 11.3% | 9.2%(+2.11)#79 | 9.6%(+1.68)#7,548 |
| 2. | 97470 | 7.7% | 9.2%(-1.45)#220 | 9.6%(-1.88)#18,932 |
1
Common Questions
What are the Top Zip Codes with the Highest Percentage of Population Employed in Sales & Related in Roseburg, OR?
Top Zip Codes with the Highest Percentage of Population Employed in Sales & Related in Roseburg, OR are:
What zip code has the Highest Percentage of Population Employed in Sales & Related in Roseburg, OR?
97471 has the Highest Percentage of Population Employed in Sales & Related in Roseburg, OR with 11.3%.
What is the Percentage of Population Employed in Sales & Related in Roseburg, OR?
Percentage of Population Employed in Sales & Related in Roseburg is 6.7%.
What is the Percentage of Population Employed in Sales & Related in Oregon?
Percentage of Population Employed in Sales & Related in Oregon is 9.2%.
What is the Percentage of Population Employed in Sales & Related in the United States?
Percentage of Population Employed in Sales & Related in the United States is 9.6%.