Zip Codes with the Highest Percentage of Population Employed in Arts, Media & Entertainment in Columbus, OH
RELATED REPORTS & OPTIONS
Arts, Media & Entertainment
Columbus
Compare Zip Codes
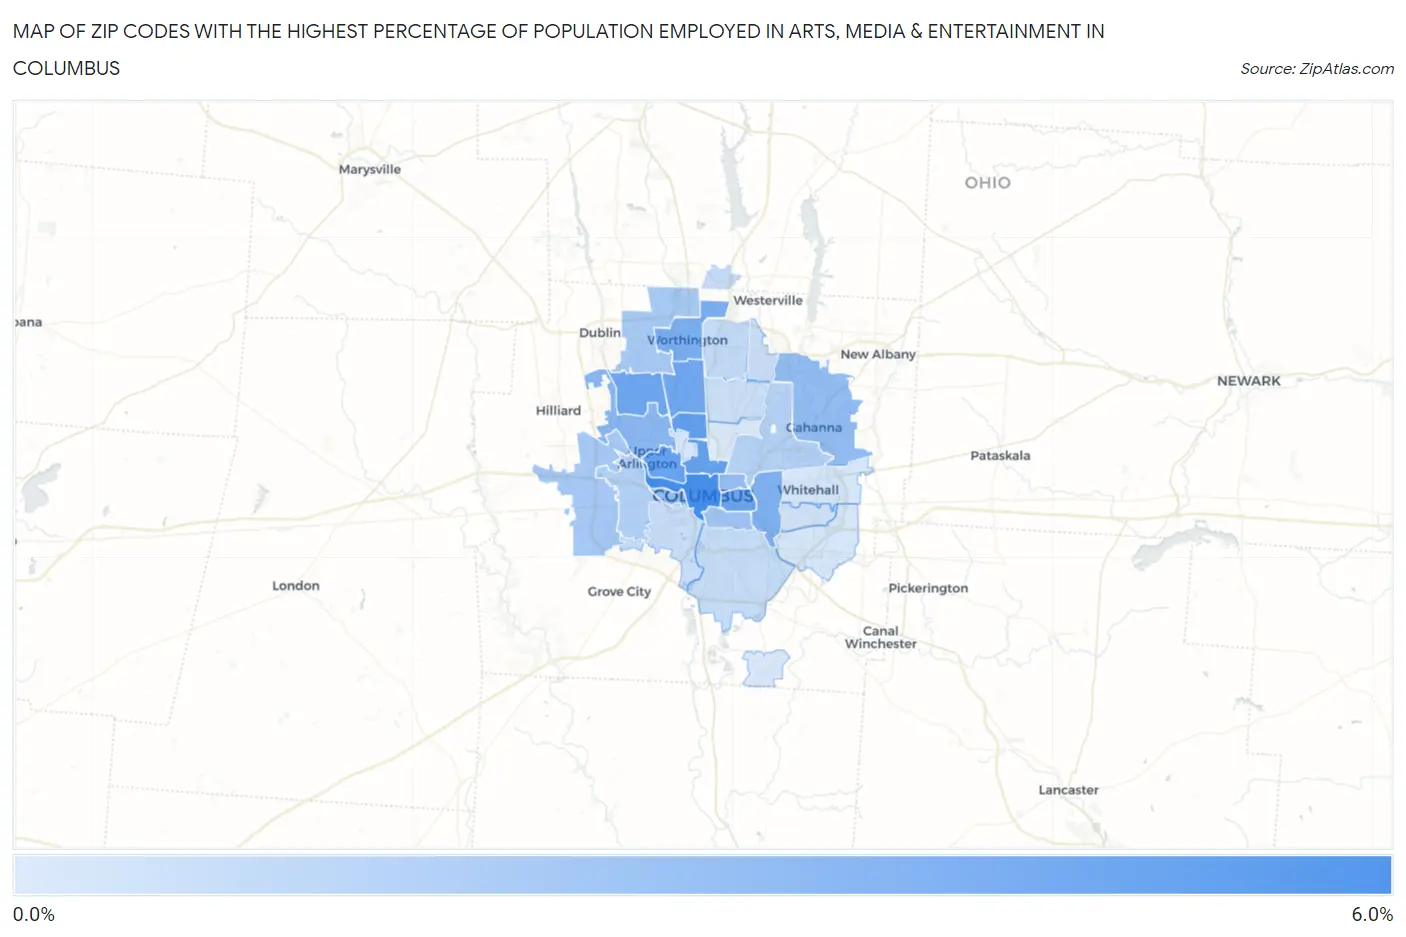
Map of Zip Codes with the Highest Percentage of Population Employed in Arts, Media & Entertainment in Columbus
0.47%
5.0%
Zip Codes with the Highest Percentage of Population Employed in Arts, Media & Entertainment in Columbus, OH
| Zip Code | % Employed | vs State | vs National | |
| 1. | 43215 | 5.0% | 1.6%(+3.47)#19 | 2.1%(+2.96)#1,493 |
| 2. | 43202 | 4.2% | 1.6%(+2.62)#36 | 2.1%(+2.11)#2,162 |
| 3. | 43201 | 4.1% | 1.6%(+2.55)#38 | 2.1%(+2.04)#2,249 |
| 4. | 43212 | 4.0% | 1.6%(+2.48)#41 | 2.1%(+1.97)#2,330 |
| 5. | 43205 | 3.9% | 1.6%(+2.33)#45 | 2.1%(+1.82)#2,517 |
| 6. | 43220 | 3.8% | 1.6%(+2.27)#47 | 2.1%(+1.76)#2,595 |
| 7. | 43214 | 3.7% | 1.6%(+2.16)#52 | 2.1%(+1.65)#2,757 |
| 8. | 43085 | 3.4% | 1.6%(+1.84)#68 | 2.1%(+1.33)#3,263 |
| 9. | 43209 | 3.2% | 1.6%(+1.67)#76 | 2.1%(+1.16)#3,560 |
| 10. | 43221 | 3.0% | 1.6%(+1.41)#91 | 2.1%(+0.904)#4,169 |
| 11. | 43222 | 2.7% | 1.6%(+1.17)#106 | 2.1%(+0.656)#4,863 |
| 12. | 43230 | 2.7% | 1.6%(+1.12)#111 | 2.1%(+0.608)#5,001 |
| 13. | 43203 | 2.6% | 1.6%(+1.07)#118 | 2.1%(+0.556)#5,177 |
| 14. | 43206 | 2.2% | 1.6%(+0.690)#172 | 2.1%(+0.180)#6,639 |
| 15. | 43228 | 2.1% | 1.6%(+0.589)#186 | 2.1%(+0.079)#7,089 |
| 16. | 43235 | 2.1% | 1.6%(+0.507)#207 | 2.1%(-0.003)#7,504 |
| 17. | 43204 | 1.7% | 1.6%(+0.148)#285 | 2.1%(-0.361)#9,633 |
| 18. | 43219 | 1.6% | 1.6%(+0.076)#308 | 2.1%(-0.433)#10,144 |
| 19. | 43240 | 1.2% | 1.6%(-0.308)#421 | 2.1%(-0.818)#12,925 |
| 20. | 43229 | 1.2% | 1.6%(-0.325)#428 | 2.1%(-0.834)#13,032 |
| 21. | 43207 | 1.2% | 1.6%(-0.398)#454 | 2.1%(-0.907)#13,558 |
| 22. | 43223 | 1.1% | 1.6%(-0.446)#473 | 2.1%(-0.955)#13,954 |
| 23. | 43231 | 0.99% | 1.6%(-0.565)#508 | 2.1%(-1.07)#14,929 |
| 24. | 43224 | 0.98% | 1.6%(-0.570)#510 | 2.1%(-1.08)#14,967 |
| 25. | 43227 | 0.83% | 1.6%(-0.719)#546 | 2.1%(-1.23)#16,163 |
| 26. | 43210 | 0.74% | 1.6%(-0.809)#584 | 2.1%(-1.32)#16,890 |
| 27. | 43213 | 0.69% | 1.6%(-0.864)#604 | 2.1%(-1.37)#17,361 |
| 28. | 43232 | 0.66% | 1.6%(-0.887)#614 | 2.1%(-1.40)#17,544 |
| 29. | 43217 | 0.56% | 1.6%(-0.988)#655 | 2.1%(-1.50)#18,347 |
| 30. | 43211 | 0.47% | 1.6%(-1.08)#688 | 2.1%(-1.59)#19,108 |
1
Common Questions
What are the Top 10 Zip Codes with the Highest Percentage of Population Employed in Arts, Media & Entertainment in Columbus, OH?
Top 10 Zip Codes with the Highest Percentage of Population Employed in Arts, Media & Entertainment in Columbus, OH are:
What zip code has the Highest Percentage of Population Employed in Arts, Media & Entertainment in Columbus, OH?
43215 has the Highest Percentage of Population Employed in Arts, Media & Entertainment in Columbus, OH with 5.0%.
What is the Percentage of Population Employed in Arts, Media & Entertainment in Columbus, OH?
Percentage of Population Employed in Arts, Media & Entertainment in Columbus is 2.1%.
What is the Percentage of Population Employed in Arts, Media & Entertainment in Ohio?
Percentage of Population Employed in Arts, Media & Entertainment in Ohio is 1.6%.
What is the Percentage of Population Employed in Arts, Media & Entertainment in the United States?
Percentage of Population Employed in Arts, Media & Entertainment in the United States is 2.1%.