Zip Codes with the Highest Percentage of Population Employed in Construction & Extraction in Cleveland, OH

RELATED REPORTS & OPTIONS

Construction & Extraction
Population
Families and Households
Female Fertility
Female Fertility (Unmarried)
Race (Community Size)
Race (Percentage)
Ancestry (Community Size)
AfghanAfricanAlbanianAlsatianAmericanApacheArabArgentineanArmenianAustralianAustrianBahamianBangladeshiBarbadianBelgianBelizeanBhutaneseBlackfeetBrazilianBritishBritish West IndianBulgarianBurmeseCajunCambodianCanadianCape VerdeanCarpatho RusynCelticCentral AmericanCentral American IndianCherokeeChickasawChileanChippewaChoctawColombianComancheCosta RicanCreekCroatianCubanCzechCzechoslovakianDanishDelawareDominicanDutchDutch West IndianEastern EuropeanEcuadorianEgyptianEnglishEstonianEthiopianEuropeanFilipinoFinnishFrenchFrench American IndianFrench CanadianGermanGhanaianGreekGuamanian / ChamorroGuatemalanGuyaneseHaitianHonduranHungarianIcelanderIndian (Asian)IndonesianIranianIraqiIrishIroquoisIsraeliItalianJamaicanJapaneseJordanianKoreanLaotianLatvianLebaneseLiberianLithuanianLumbeeLuxembourgerMacedonianMalaysianMexicanMexican American IndianMongolianMoroccanNative HawaiianNavajoNicaraguanNigerianNorthern EuropeanNorwegianPakistaniPalestinianPanamanianParaguayanPennsylvania GermanPeruvianPolishPortuguesePuebloPuerto RicanRomanianRussianSalvadoranSamoanScandinavianScotch-IrishScottishSeminoleSerbianSierra LeoneanSiouxSlavicSlovakSloveneSomaliSouth AfricanSouth AmericanSouth American IndianSpaniardSpanishSri LankanSubsaharan AfricanSudaneseSwedishSwissSyrianThaiTrinidadian and TobagonianTurkishU.S. Virgin IslanderUgandanUkrainianUruguayanVenezuelanVietnameseWelshWest IndianYaquiYugoslavianZimbabwean
Ancestry (Percentage)
AfghanAfricanAlbanianAlsatianAmericanApacheArabArgentineanArmenianAustralianAustrianBahamianBangladeshiBarbadianBelgianBelizeanBhutaneseBlackfeetBrazilianBritishBritish West IndianBulgarianBurmeseCajunCambodianCanadianCape VerdeanCarpatho RusynCelticCentral AmericanCentral American IndianCherokeeChickasawChileanChippewaChoctawColombianComancheCosta RicanCreekCroatianCubanCzechCzechoslovakianDanishDelawareDominicanDutchDutch West IndianEastern EuropeanEcuadorianEgyptianEnglishEstonianEthiopianEuropeanFilipinoFinnishFrenchFrench American IndianFrench CanadianGermanGhanaianGreekGuamanian / ChamorroGuatemalanGuyaneseHaitianHonduranHungarianIcelanderIndian (Asian)IndonesianIranianIraqiIrishIroquoisIsraeliItalianJamaicanJapaneseJordanianKoreanLaotianLatvianLebaneseLiberianLithuanianLumbeeLuxembourgerMacedonianMalaysianMexicanMexican American IndianMongolianMoroccanNative HawaiianNavajoNicaraguanNigerianNorthern EuropeanNorwegianPakistaniPalestinianPanamanianParaguayanPennsylvania GermanPeruvianPolishPortuguesePuebloPuerto RicanRomanianRussianSalvadoranSamoanScandinavianScotch-IrishScottishSeminoleSerbianSierra LeoneanSiouxSlavicSlovakSloveneSomaliSouth AfricanSouth AmericanSouth American IndianSpaniardSpanishSri LankanSubsaharan AfricanSudaneseSwedishSwissSyrianThaiTrinidadian and TobagonianTurkishU.S. Virgin IslanderUgandanUkrainianUruguayanVenezuelanVietnameseWelshWest IndianYaquiYugoslavianZimbabwean
Immigrant Origin (Total)
AfghanistanAfricaAlbaniaArgentinaAsiaAustraliaAustriaBangladeshBarbadosBelarusBelgiumBelizeBosnia and HerzegovinaBrazilBulgariaBurma / MyanmarCambodiaCanadaCaribbeanCentral AmericaChileChinaColombiaCongoCosta RicaCroatiaCubaCzechoslovakiaDominican RepublicEastern AfricaEastern AsiaEastern EuropeEcuadorEgyptEl SalvadorEnglandEthiopiaEuropeFranceGermanyGhanaGreeceGuatemalaGuyanaHaitiHondurasHong KongHungaryIndiaIndonesiaIranIraqIrelandIsraelItalyJamaicaJapanJordanKazakhstanKenyaKoreaKuwaitLaosLatin AmericaLatviaLebanonLiberiaLithuaniaMalaysiaMexicoMiddle AfricaMoldovaMoroccoNepalNetherlandsNicaraguaNigeriaNorthern AfricaNorthern EuropeOceaniaPakistanPanamaPeruPhilippinesPolandRomaniaRussiaSaudi ArabiaScotlandSerbiaSierra LeoneSingaporeSomaliaSouth AfricaSouth AmericaSouth Central AsiaSouth Eastern AsiaSouthern EuropeSpainSri LankaSudanSwedenSyriaTaiwanThailandTrinidad and TobagoTurkeyUgandaUkraineUruguayUzbekistanVenezuelaVietnamWest IndiesWestern AfricaWestern AsiaWestern EuropeZaireZimbabwe
Immigrant Origin (Percentage)
AfghanistanAfricaAlbaniaArgentinaAsiaAustraliaAustriaBangladeshBarbadosBelarusBelgiumBelizeBosnia and HerzegovinaBrazilBulgariaBurma / MyanmarCambodiaCanadaCaribbeanCentral AmericaChileChinaColombiaCongoCosta RicaCroatiaCubaCzechoslovakiaDominican RepublicEastern AfricaEastern AsiaEastern EuropeEcuadorEgyptEl SalvadorEnglandEthiopiaEuropeFranceGermanyGhanaGreeceGuatemalaGuyanaHaitiHondurasHong KongHungaryIndiaIndonesiaIranIraqIrelandIsraelItalyJamaicaJapanJordanKazakhstanKenyaKoreaKuwaitLaosLatin AmericaLatviaLebanonLiberiaLithuaniaMalaysiaMexicoMiddle AfricaMoldovaMoroccoNepalNetherlandsNicaraguaNigeriaNorthern AfricaNorthern EuropeOceaniaPakistanPanamaPeruPhilippinesPolandRomaniaRussiaSaudi ArabiaScotlandSerbiaSierra LeoneSingaporeSomaliaSouth AfricaSouth AmericaSouth Central AsiaSouth Eastern AsiaSouthern EuropeSpainSri LankaSudanSwedenSyriaTaiwanThailandTrinidad and TobagoTurkeyUgandaUkraineUruguayUzbekistanVenezuelaVietnamWest IndiesWestern AfricaWestern AsiaWestern EuropeZaireZimbabwe
Income
Income (Families)
Income (Households)
Poverty
Poverty (Families)
Unemployment
Employment Occupations
Employment Industries
Employer Class
Commute Time
Commute Means
School Enrollment
Education by Degree Field
Occupancy
Finances
Physical Characteristics
Cleveland
Compare Zip Codes
Comparison Subject

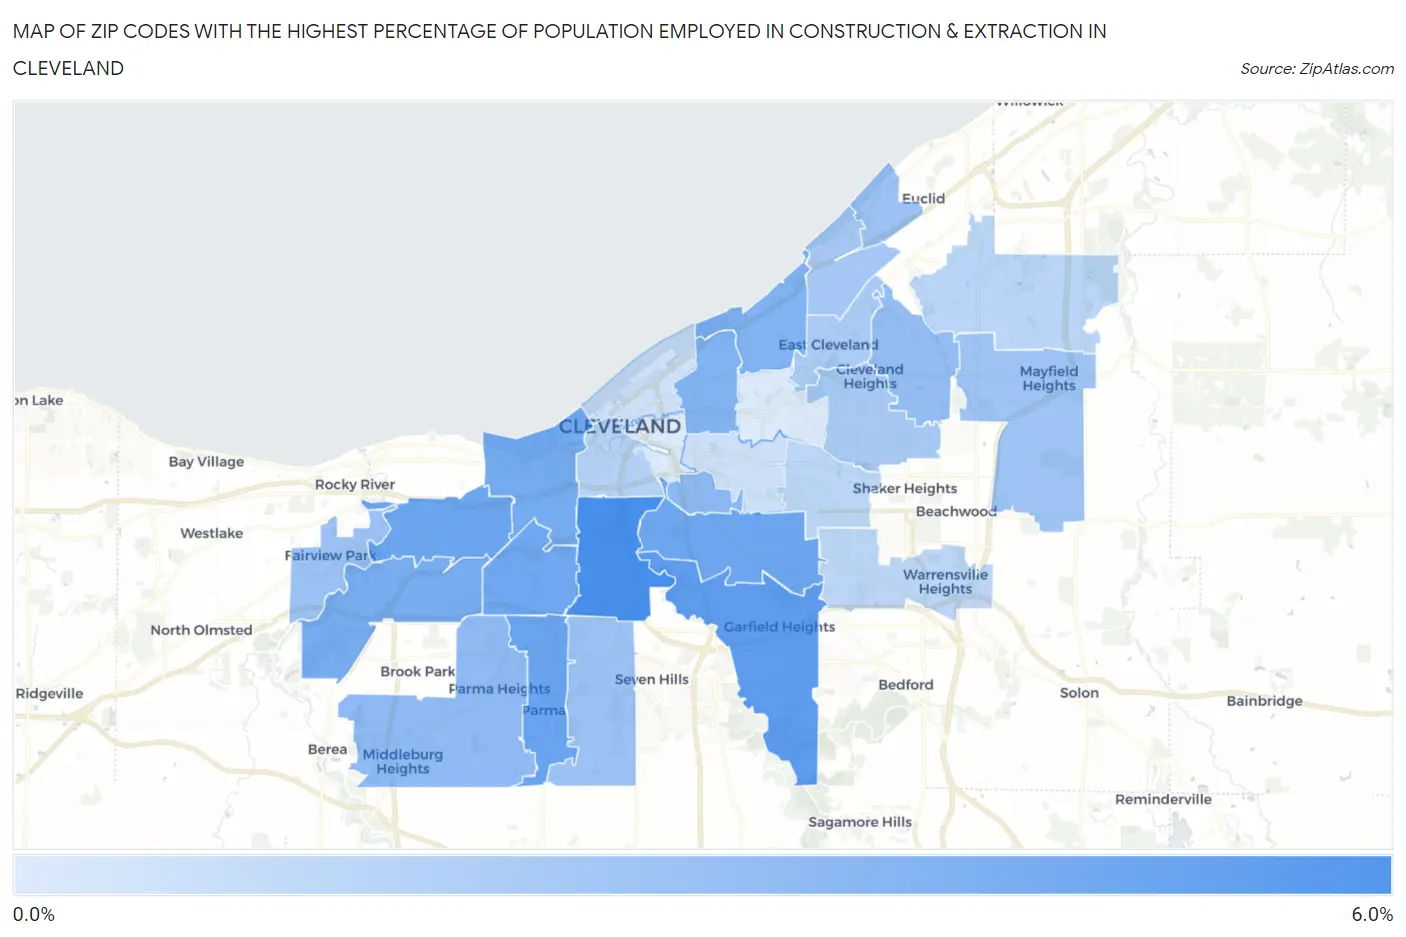
Map of Zip Codes with the Highest Percentage of Population Employed in Construction & Extraction in Cleveland

0.0%
6.0%
Zip Codes with the Highest Percentage of Population Employed in Construction & Extraction in Cleveland Map

Zip Codes with the Highest Percentage of Population Employed in Construction & Extraction in Cleveland, OH

Zip Code % Employed vs State vs National
1.441095.5%4.1%(+1.40)#4695.0%(+0.516)#14,993
2.441254.7%4.1%(+0.616)#5805.0%(-0.269)#17,704
3.441294.4%4.1%(+0.241)#6405.0%(-0.644)#19,039
4.441114.3%4.1%(+0.202)#6465.0%(-0.683)#19,176
5.441054.2%4.1%(+0.122)#6605.0%(-0.763)#19,484
6.441444.2%4.1%(+0.051)#6715.0%(-0.834)#19,759
7.441024.0%4.1%(-0.153)#7085.0%(-1.04)#20,508
8.441353.9%4.1%(-0.178)#7145.0%(-1.06)#20,590
9.441033.6%4.1%(-0.534)#7725.0%(-1.42)#21,755
10.441083.6%4.1%(-0.536)#7745.0%(-1.42)#21,764
11.441273.3%4.1%(-0.846)#8105.0%(-1.73)#22,752
12.441303.1%4.1%(-0.988)#8305.0%(-1.87)#23,200
13.441213.0%4.1%(-1.08)#8495.0%(-1.97)#23,524
14.441262.7%4.1%(-1.37)#8825.0%(-2.26)#24,381
15.441192.7%4.1%(-1.39)#8845.0%(-2.28)#24,437
16.441342.7%4.1%(-1.41)#8895.0%(-2.29)#24,483
17.441242.6%4.1%(-1.51)#9025.0%(-2.39)#24,763
18.441102.4%4.1%(-1.69)#9265.0%(-2.58)#25,254
19.441182.3%4.1%(-1.80)#9395.0%(-2.68)#25,541
20.441122.3%4.1%(-1.81)#9405.0%(-2.70)#25,583
21.441131.9%4.1%(-2.21)#9925.0%(-3.10)#26,584
22.441431.8%4.1%(-2.34)#1,0065.0%(-3.23)#26,840
23.441281.7%4.1%(-2.42)#1,0115.0%(-3.30)#27,015
24.441201.6%4.1%(-2.47)#1,0185.0%(-3.36)#27,131
25.441041.2%4.1%(-2.93)#1,0555.0%(-3.82)#28,030
26.441141.1%4.1%(-3.02)#1,0595.0%(-3.90)#28,152
27.441060.65%4.1%(-3.46)#1,0855.0%(-4.34)#28,773
28.441150.64%4.1%(-3.47)#1,0865.0%(-4.36)#28,783

Common Questions

What are the Top 10 Zip Codes with the Highest Percentage of Population Employed in Construction & Extraction in Cleveland, OH?
Top 10 Zip Codes with the Highest Percentage of Population Employed in Construction & Extraction in Cleveland, OH are:
#1
5.5%
#2
4.7%
#3
4.4%
#4
4.3%
#5
4.2%
#6
4.2%
#7
4.0%
#8
3.9%
#9
3.6%
#10
3.6%
What zip code has the Highest Percentage of Population Employed in Construction & Extraction in Cleveland, OH?
44109 has the Highest Percentage of Population Employed in Construction & Extraction in Cleveland, OH with 5.5%.
What is the Percentage of Population Employed in Construction & Extraction in Cleveland, OH?
Percentage of Population Employed in Construction & Extraction in Cleveland is 3.4%.
What is the Percentage of Population Employed in Construction & Extraction in Ohio?
Percentage of Population Employed in Construction & Extraction in Ohio is 4.1%.
What is the Percentage of Population Employed in Construction & Extraction in the United States?
Percentage of Population Employed in Construction & Extraction in the United States is 5.0%.