Zip Codes with the Highest Percentage of Population Taking Public Transit to Work in Camden, NJ
RELATED REPORTS & OPTIONS
Public Transit
Camden
Compare Zip Codes
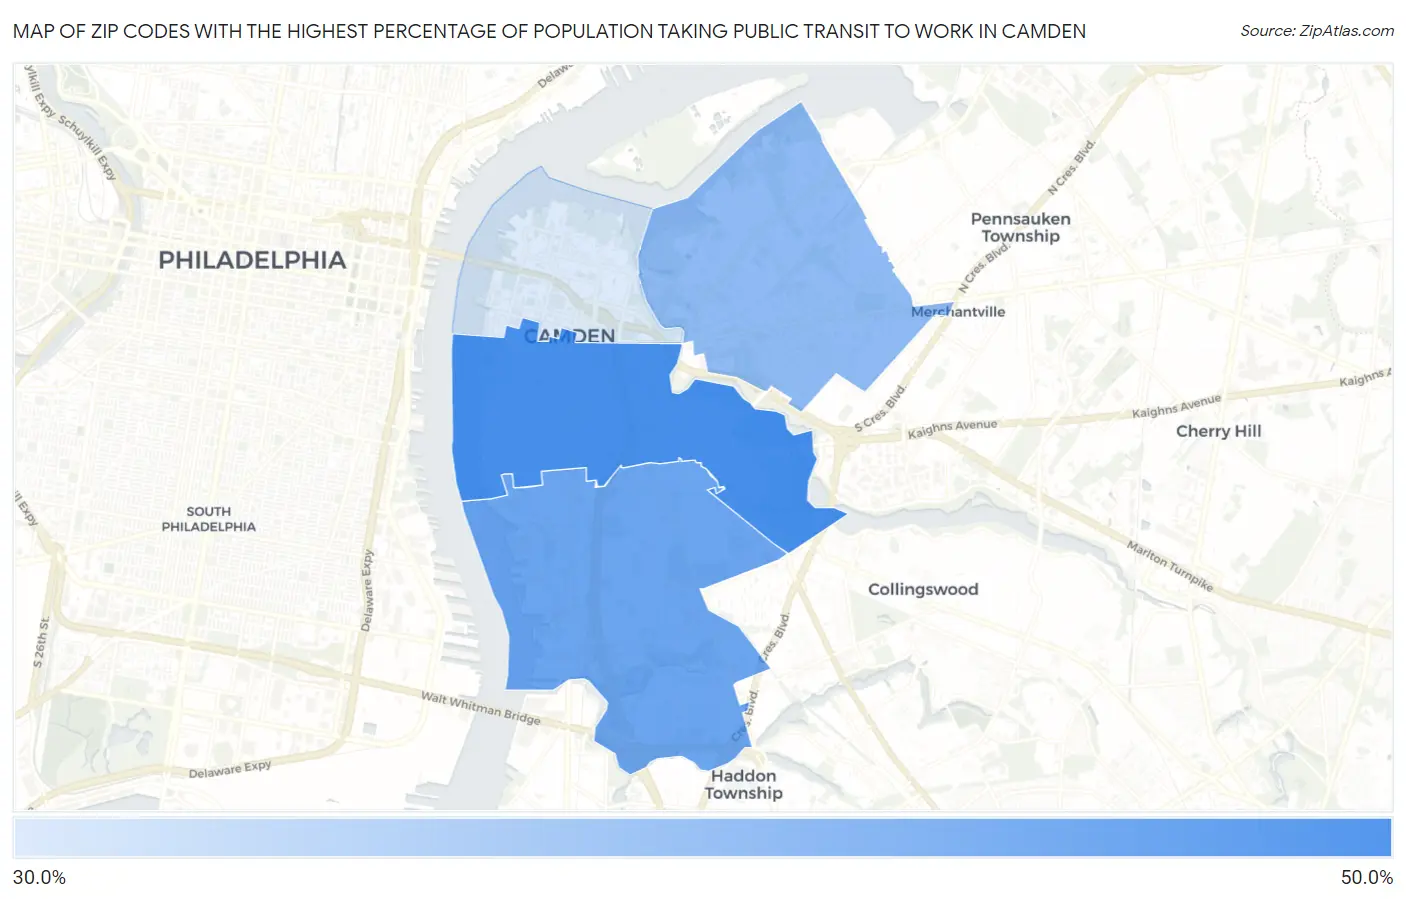
Map of Zip Codes with the Highest Percentage of Population Taking Public Transit to Work in Camden
0.0%
50.0%
Zip Codes with the Highest Percentage of Population Taking Public Transit to Work in Camden, NJ
| Zip Code | % Public Transit | vs State | vs National | |
| 1. | 08103 | 42.5% | 40.9%(+1.60)#272 | 38.5%(+4.00)#3,424 |
| 2. | 08104 | 40.1% | 40.9%(-0.800)#329 | 38.5%(+1.60)#4,187 |
| 3. | 08105 | 37.8% | 40.9%(-3.10)#375 | 38.5%(-0.700)#4,884 |
| 4. | 08102 | 32.9% | 40.9%(-8.00)#429 | 38.5%(-5.60)#6,239 |
1
Common Questions
What are the Top 3 Zip Codes with the Highest Percentage of Population Taking Public Transit to Work in Camden, NJ?
Top 3 Zip Codes with the Highest Percentage of Population Taking Public Transit to Work in Camden, NJ are:
What zip code has the Highest Percentage of Population Taking Public Transit to Work in Camden, NJ?
08103 has the Highest Percentage of Population Taking Public Transit to Work in Camden, NJ with 42.5%.
What is the Percentage of Population Taking Public Transit to Work in Camden, NJ?
Percentage of Population Taking Public Transit to Work in Camden is 39.9%.
What is the Percentage of Population Taking Public Transit to Work in New Jersey?
Percentage of Population Taking Public Transit to Work in New Jersey is 40.9%.
What is the Percentage of Population Taking Public Transit to Work in the United States?
Percentage of Population Taking Public Transit to Work in the United States is 38.5%.