Zip Codes with the Highest Percentage of Hispanic or Latino Population in Camden, NJ
RELATED REPORTS & OPTIONS
Hispanic or Latino
Camden
Compare Zip Codes
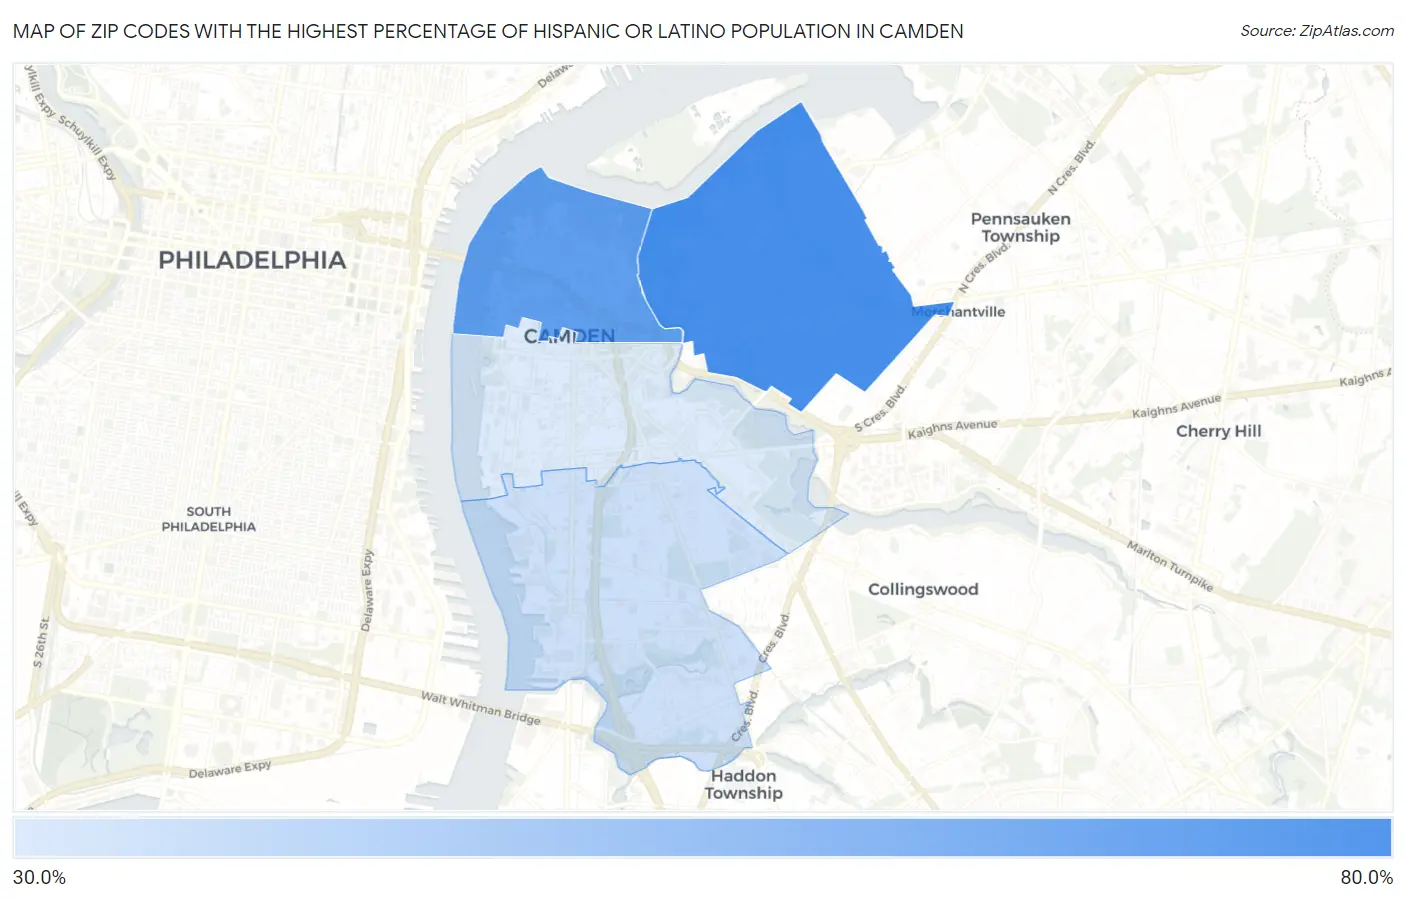
Map of Zip Codes with the Highest Percentage of Hispanic or Latino Population in Camden
35.6%
69.4%
Zip Codes with the Highest Percentage of Hispanic or Latino Population in Camden, NJ
| Zip Code | Hispanic or Latino | vs State | vs National | |
| 1. | 08105 | 69.4% | 21.2%(+48.2)#11 | 18.7%(+50.7)#815 |
| 2. | 08102 | 63.3% | 21.2%(+42.1)#18 | 18.7%(+44.6)#994 |
| 3. | 08104 | 39.0% | 21.2%(+17.8)#54 | 18.7%(+20.3)#2,232 |
| 4. | 08103 | 35.6% | 21.2%(+14.4)#62 | 18.7%(+17.0)#2,507 |
1
Common Questions
What are the Top 3 Zip Codes with the Highest Percentage of Hispanic or Latino Population in Camden, NJ?
Top 3 Zip Codes with the Highest Percentage of Hispanic or Latino Population in Camden, NJ are:
What zip code has the Highest Percentage of Hispanic or Latino Population in Camden, NJ?
08105 has the Highest Percentage of Hispanic or Latino Population in Camden, NJ with 69.4%.
What is the Percentage of Hispanic or Latino Population in Camden, NJ?
Percentage of Hispanic or Latino Population in Camden is 53.3%.
What is the Percentage of Hispanic or Latino Population in New Jersey?
Percentage of Hispanic or Latino Population in New Jersey is 21.2%.
What is the Percentage of Hispanic or Latino Population in the United States?
Percentage of Hispanic or Latino Population in the United States is 18.7%.