Zip Codes with the Highest Percentage of Population Employed in Health Diagnosing & Treating in Brick, NJ
RELATED REPORTS & OPTIONS
Health Diagnosing & Treating
Brick
Compare Zip Codes
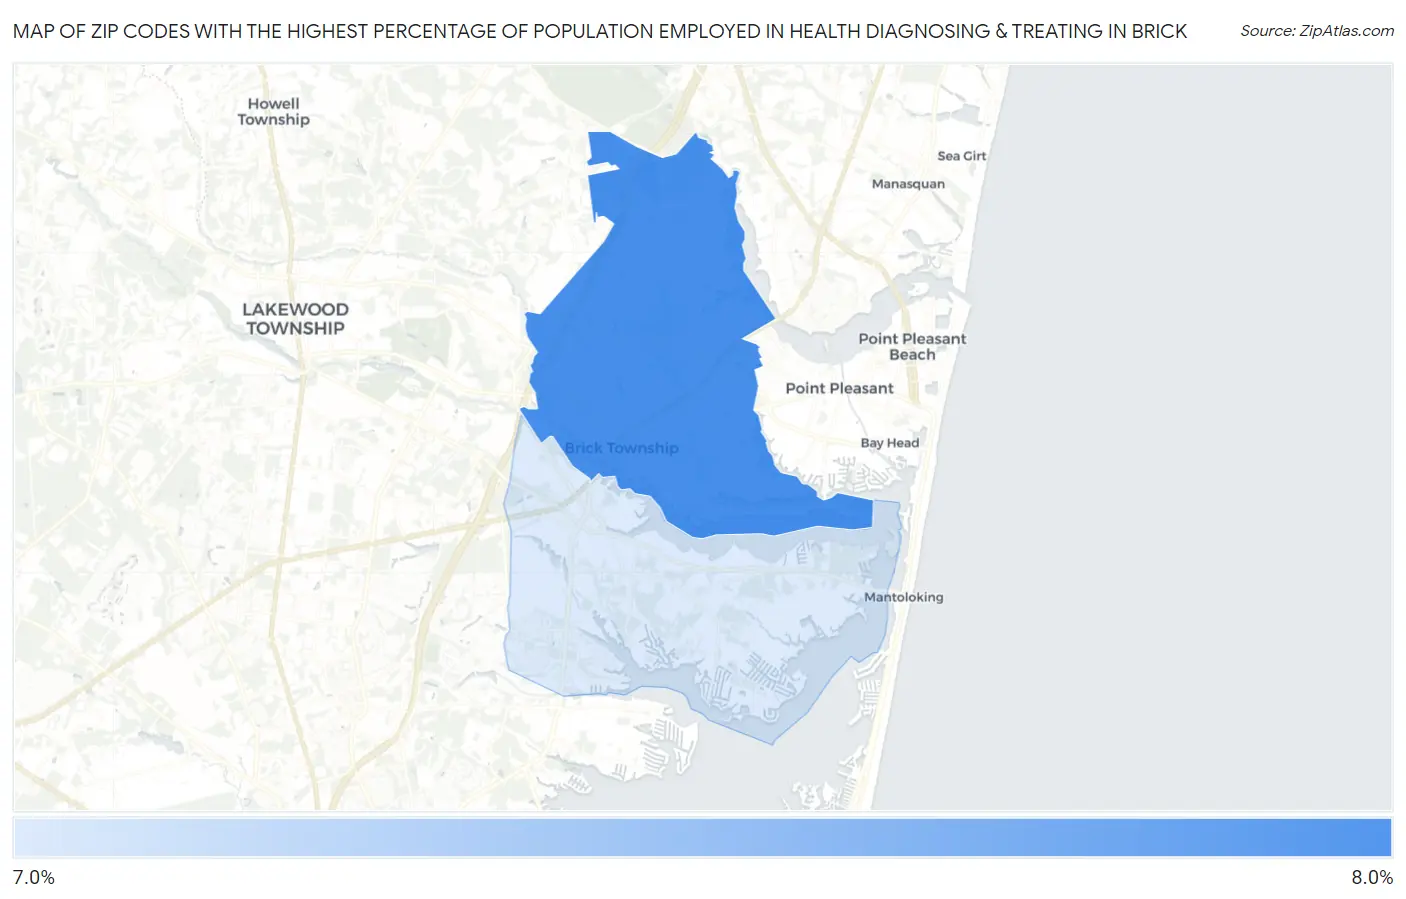
Map of Zip Codes with the Highest Percentage of Population Employed in Health Diagnosing & Treating in Brick
7.8%
7.8%
Zip Codes with the Highest Percentage of Population Employed in Health Diagnosing & Treating in Brick, NJ
| Zip Code | % Employed | vs State | vs National | |
| 1. | 08724 | 7.8% | 6.2%(+1.57)#148 | 6.2%(+1.56)#7,972 |
| 2. | 08723 | 7.8% | 6.2%(+1.53)#152 | 6.2%(+1.52)#8,075 |
1
Common Questions
What are the Top Zip Codes with the Highest Percentage of Population Employed in Health Diagnosing & Treating in Brick, NJ?
Top Zip Codes with the Highest Percentage of Population Employed in Health Diagnosing & Treating in Brick, NJ are:
What zip code has the Highest Percentage of Population Employed in Health Diagnosing & Treating in Brick, NJ?
08724 has the Highest Percentage of Population Employed in Health Diagnosing & Treating in Brick, NJ with 7.8%.
What is the Percentage of Population Employed in Health Diagnosing & Treating in New Jersey?
Percentage of Population Employed in Health Diagnosing & Treating in New Jersey is 6.2%.
What is the Percentage of Population Employed in Health Diagnosing & Treating in the United States?
Percentage of Population Employed in Health Diagnosing & Treating in the United States is 6.2%.