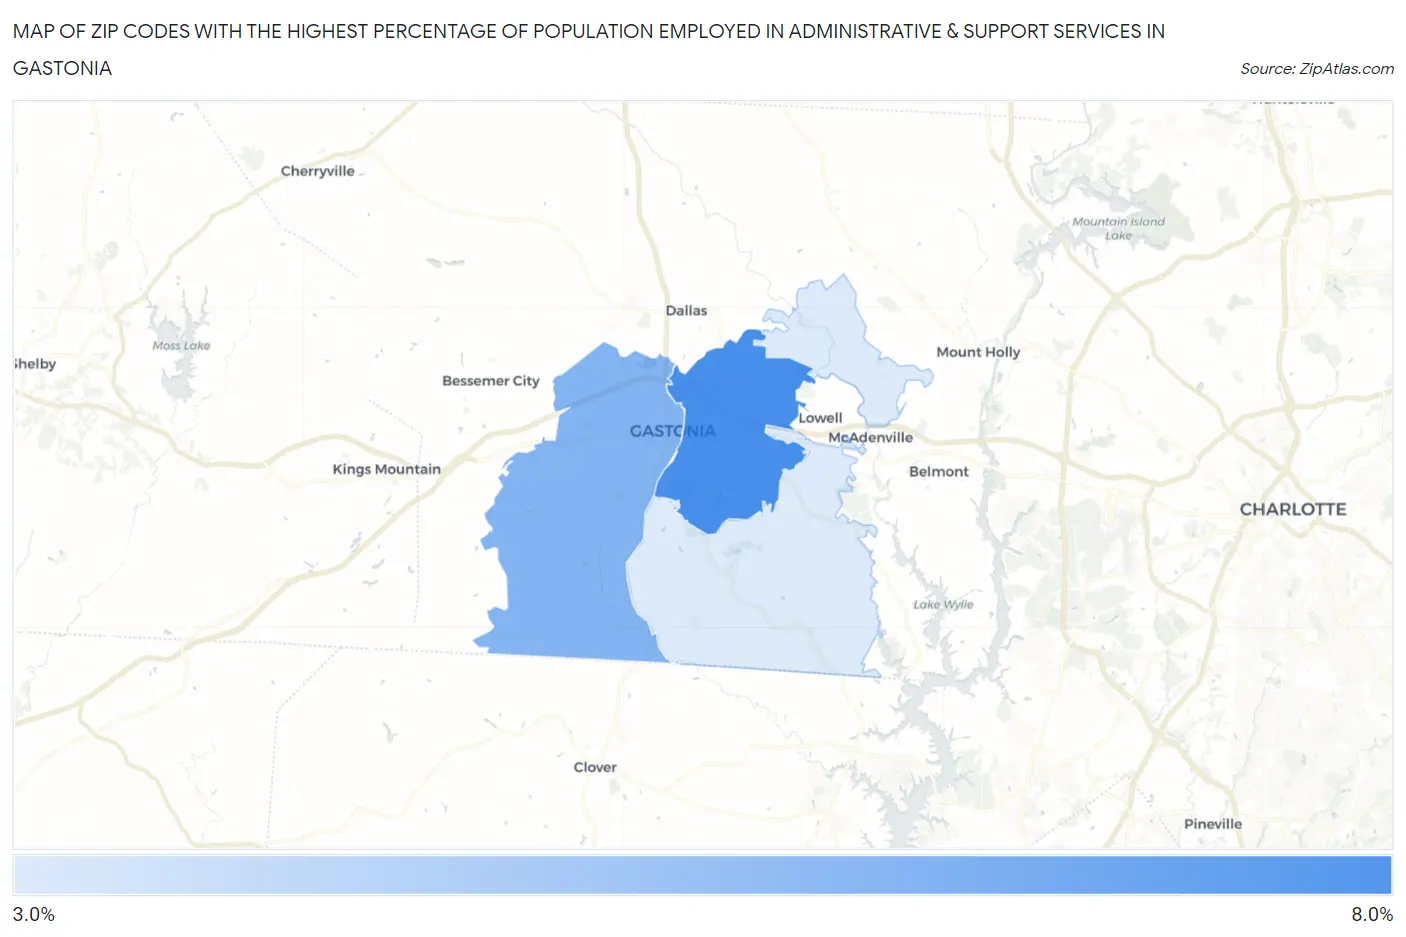
Zip Codes with the Highest Percentage of Population Employed in Administrative & Support Services in Gastonia, NC
RELATED REPORTS & OPTIONS
Administrative & Support Services
Gastonia
Compare Zip Codes
Map of Zip Codes with the Highest Percentage of Population Employed in Administrative & Support Services in Gastonia
3.9%
6.2%
Zip Codes with the Highest Percentage of Population Employed in Administrative & Support Services in Gastonia, NC
| Zip Code | % Employed | vs State | vs National | |
| 1. | 28054 | 6.2% | 4.3%(+1.96)#132 | 4.1%(+2.07)#4,370 |
| 2. | 28052 | 5.3% | 4.3%(+1.05)#206 | 4.1%(+1.16)#6,290 |
| 3. | 28056 | 3.9% | 4.3%(-0.337)#380 | 4.1%(-0.222)#10,977 |
1
Common Questions
What are the Top Zip Codes with the Highest Percentage of Population Employed in Administrative & Support Services in Gastonia, NC?
Top Zip Codes with the Highest Percentage of Population Employed in Administrative & Support Services in Gastonia, NC are:
What zip code has the Highest Percentage of Population Employed in Administrative & Support Services in Gastonia, NC?
28054 has the Highest Percentage of Population Employed in Administrative & Support Services in Gastonia, NC with 6.2%.
What is the Percentage of Population Employed in Administrative & Support Services in Gastonia, NC?
Percentage of Population Employed in Administrative & Support Services in Gastonia is 5.2%.
What is the Percentage of Population Employed in Administrative & Support Services in North Carolina?
Percentage of Population Employed in Administrative & Support Services in North Carolina is 4.3%.
What is the Percentage of Population Employed in Administrative & Support Services in the United States?
Percentage of Population Employed in Administrative & Support Services in the United States is 4.1%.