Zip Codes with the Highest Percentage of Population Employed in Security & Protection in Great Falls, MT
RELATED REPORTS & OPTIONS
Security & Protection
Great Falls
Compare Zip Codes
Map of Zip Codes with the Highest Percentage of Population Employed in Security & Protection in Great Falls
1.3%
2.5%
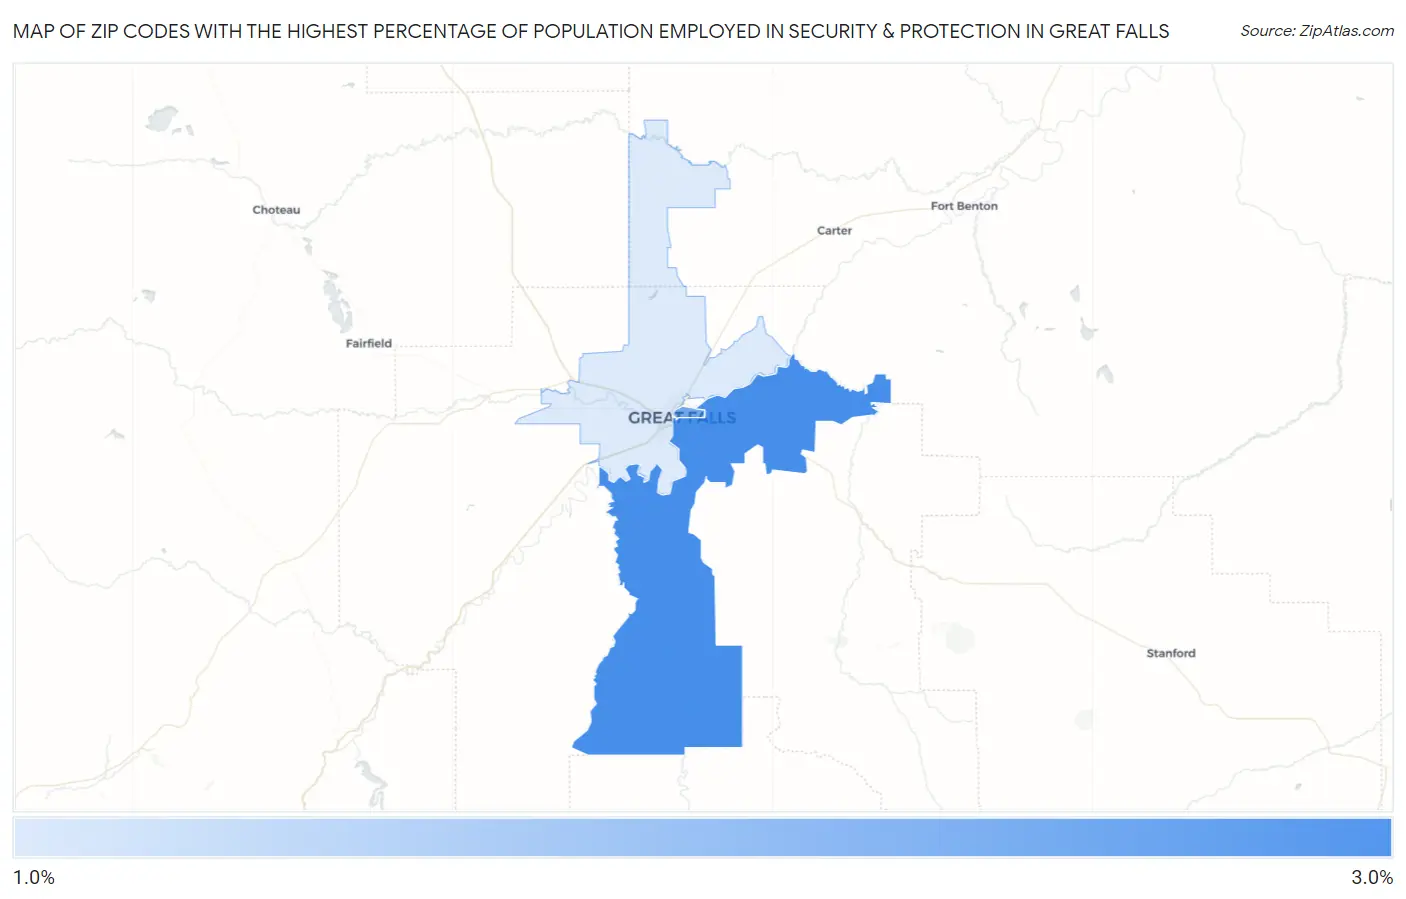
Zip Codes with the Highest Percentage of Population Employed in Security & Protection in Great Falls, MT
| Zip Code | % Employed | vs State | vs National | |
| 1. | 59405 | 2.5% | 1.9%(+0.595)#86 | 2.1%(+0.356)#9,485 |
| 2. | 59401 | 2.2% | 1.9%(+0.263)#97 | 2.1%(+0.023)#11,438 |
| 3. | 59404 | 1.3% | 1.9%(-0.582)#130 | 2.1%(-0.822)#17,521 |
1
Common Questions
What are the Top Zip Codes with the Highest Percentage of Population Employed in Security & Protection in Great Falls, MT?
Top Zip Codes with the Highest Percentage of Population Employed in Security & Protection in Great Falls, MT are:
What zip code has the Highest Percentage of Population Employed in Security & Protection in Great Falls, MT?
59405 has the Highest Percentage of Population Employed in Security & Protection in Great Falls, MT with 2.5%.
What is the Percentage of Population Employed in Security & Protection in Great Falls, MT?
Percentage of Population Employed in Security & Protection in Great Falls is 1.9%.
What is the Percentage of Population Employed in Security & Protection in Montana?
Percentage of Population Employed in Security & Protection in Montana is 1.9%.
What is the Percentage of Population Employed in Security & Protection in the United States?
Percentage of Population Employed in Security & Protection in the United States is 2.1%.