Zip Codes with the Highest Percentage of Population with a Degree in Liberal Arts and History in Great Falls, MT
RELATED REPORTS & OPTIONS
Liberal Arts and History
Great Falls
Compare Zip Codes
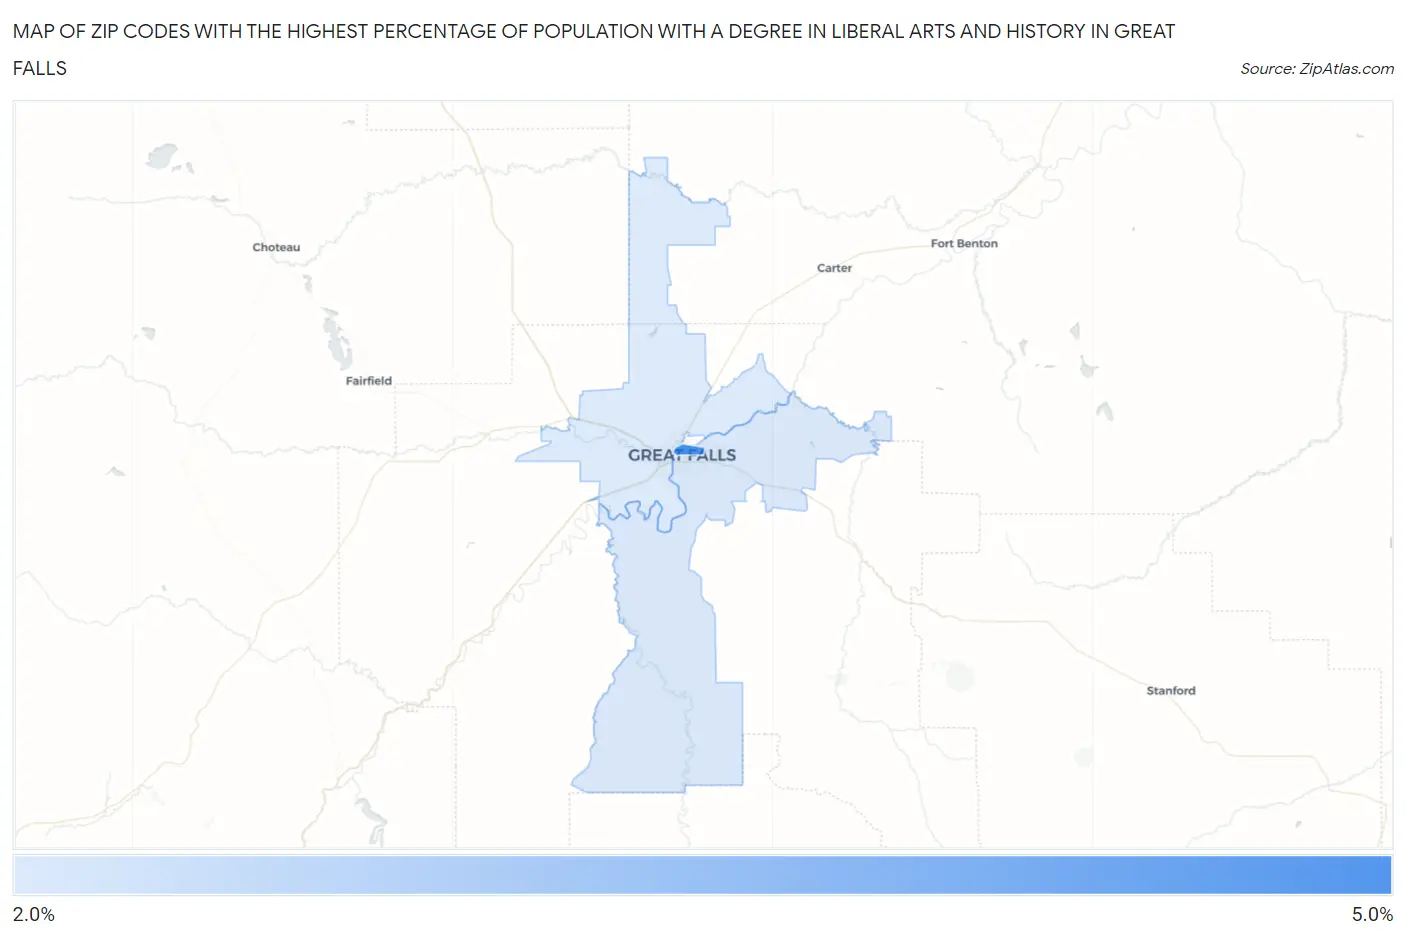
Map of Zip Codes with the Highest Percentage of Population with a Degree in Liberal Arts and History in Great Falls
2.5%
4.4%
Zip Codes with the Highest Percentage of Population with a Degree in Liberal Arts and History in Great Falls, MT
| Zip Code | % Graduates | vs State | vs National | |
| 1. | 59401 | 4.4% | 5.3%(-0.859)#123 | 4.9%(-0.439)#13,179 |
| 2. | 59405 | 2.6% | 5.3%(-2.70)#175 | 4.9%(-2.28)#19,679 |
| 3. | 59404 | 2.5% | 5.3%(-2.74)#176 | 4.9%(-2.32)#19,829 |
1
Common Questions
What are the Top Zip Codes with the Highest Percentage of Population with a Degree in Liberal Arts and History in Great Falls, MT?
Top Zip Codes with the Highest Percentage of Population with a Degree in Liberal Arts and History in Great Falls, MT are:
What zip code has the Highest Percentage of Population with a Degree in Liberal Arts and History in Great Falls, MT?
59401 has the Highest Percentage of Population with a Degree in Liberal Arts and History in Great Falls, MT with 4.4%.
What is the Percentage of Population with a Degree in Liberal Arts and History in Great Falls, MT?
Percentage of Population with a Degree in Liberal Arts and History in Great Falls is 2.9%.
What is the Percentage of Population with a Degree in Liberal Arts and History in Montana?
Percentage of Population with a Degree in Liberal Arts and History in Montana is 5.3%.
What is the Percentage of Population with a Degree in Liberal Arts and History in the United States?
Percentage of Population with a Degree in Liberal Arts and History in the United States is 4.9%.