Zip Codes with the Highest Percentage of Population Employed in Health Diagnosing & Treating in Great Falls, MT
RELATED REPORTS & OPTIONS
Health Diagnosing & Treating
Great Falls
Compare Zip Codes
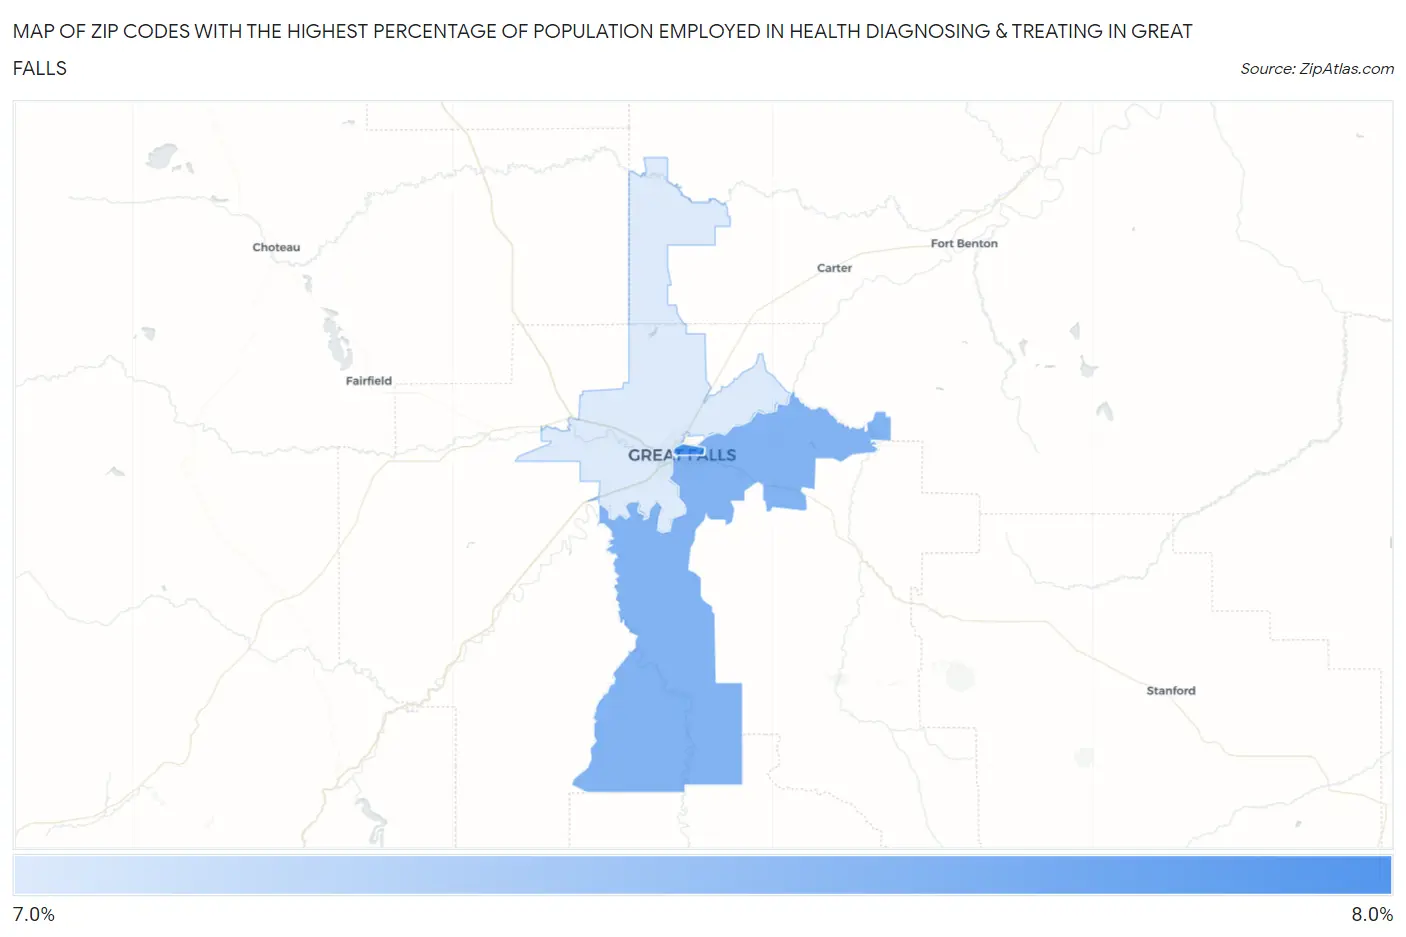
Map of Zip Codes with the Highest Percentage of Population Employed in Health Diagnosing & Treating in Great Falls
7.8%
7.9%
Zip Codes with the Highest Percentage of Population Employed in Health Diagnosing & Treating in Great Falls, MT
| Zip Code | % Employed | vs State | vs National | |
| 1. | 59401 | 7.9% | 6.6%(+1.35)#61 | 6.2%(+1.67)#7,724 |
| 2. | 59405 | 7.9% | 6.6%(+1.30)#62 | 6.2%(+1.61)#7,859 |
| 3. | 59404 | 7.8% | 6.6%(+1.21)#65 | 6.2%(+1.53)#8,066 |
1
Common Questions
What are the Top Zip Codes with the Highest Percentage of Population Employed in Health Diagnosing & Treating in Great Falls, MT?
Top Zip Codes with the Highest Percentage of Population Employed in Health Diagnosing & Treating in Great Falls, MT are:
What zip code has the Highest Percentage of Population Employed in Health Diagnosing & Treating in Great Falls, MT?
59401 has the Highest Percentage of Population Employed in Health Diagnosing & Treating in Great Falls, MT with 7.9%.
What is the Percentage of Population Employed in Health Diagnosing & Treating in Great Falls, MT?
Percentage of Population Employed in Health Diagnosing & Treating in Great Falls is 7.6%.
What is the Percentage of Population Employed in Health Diagnosing & Treating in Montana?
Percentage of Population Employed in Health Diagnosing & Treating in Montana is 6.6%.
What is the Percentage of Population Employed in Health Diagnosing & Treating in the United States?
Percentage of Population Employed in Health Diagnosing & Treating in the United States is 6.2%.