Zip Codes with the Highest Percentage of Population Employed in Food Preparation & Serving in Hattiesburg, MS
RELATED REPORTS & OPTIONS
Food Preparation & Serving
Hattiesburg
Compare Zip Codes
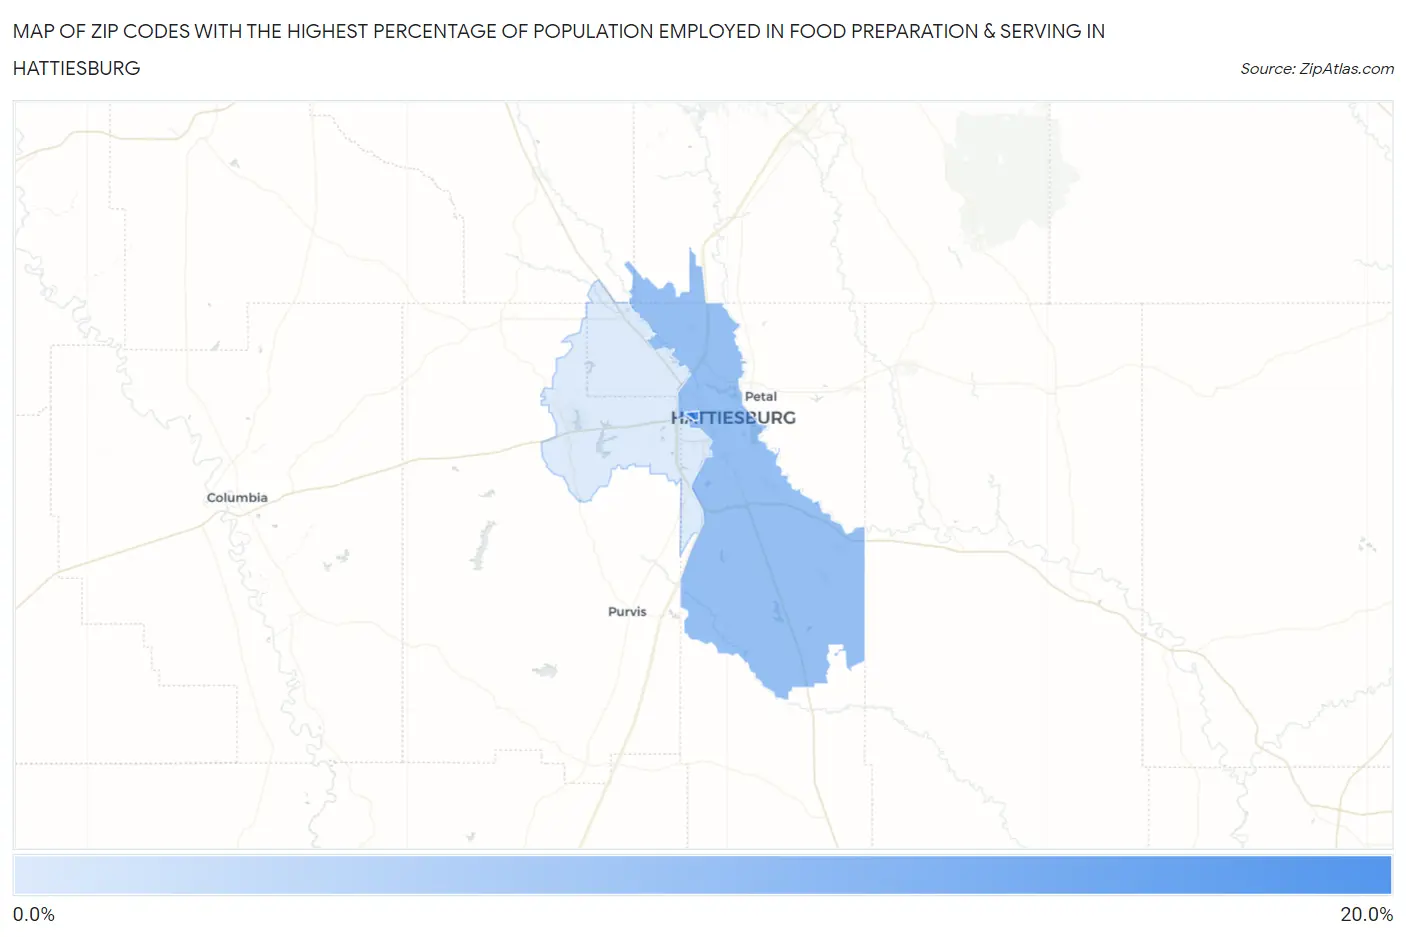
Map of Zip Codes with the Highest Percentage of Population Employed in Food Preparation & Serving in Hattiesburg
5.4%
15.9%
Zip Codes with the Highest Percentage of Population Employed in Food Preparation & Serving in Hattiesburg, MS
| Zip Code | % Employed | vs State | vs National | |
| 1. | 39406 | 15.9% | 5.6%(+10.3)#11 | 5.3%(+10.6)#871 |
| 2. | 39401 | 10.4% | 5.6%(+4.77)#36 | 5.3%(+5.07)#2,394 |
| 3. | 39402 | 5.4% | 5.6%(-0.165)#143 | 5.3%(+0.142)#11,311 |
1
Common Questions
What are the Top Zip Codes with the Highest Percentage of Population Employed in Food Preparation & Serving in Hattiesburg, MS?
Top Zip Codes with the Highest Percentage of Population Employed in Food Preparation & Serving in Hattiesburg, MS are:
What zip code has the Highest Percentage of Population Employed in Food Preparation & Serving in Hattiesburg, MS?
39406 has the Highest Percentage of Population Employed in Food Preparation & Serving in Hattiesburg, MS with 15.9%.
What is the Percentage of Population Employed in Food Preparation & Serving in Hattiesburg, MS?
Percentage of Population Employed in Food Preparation & Serving in Hattiesburg is 10.8%.
What is the Percentage of Population Employed in Food Preparation & Serving in Mississippi?
Percentage of Population Employed in Food Preparation & Serving in Mississippi is 5.6%.
What is the Percentage of Population Employed in Food Preparation & Serving in the United States?
Percentage of Population Employed in Food Preparation & Serving in the United States is 5.3%.