Zip Codes with the Highest Percentage of Population Employed in Office & Administration in Hattiesburg, MS
RELATED REPORTS & OPTIONS
Office & Administration
Hattiesburg
Compare Zip Codes
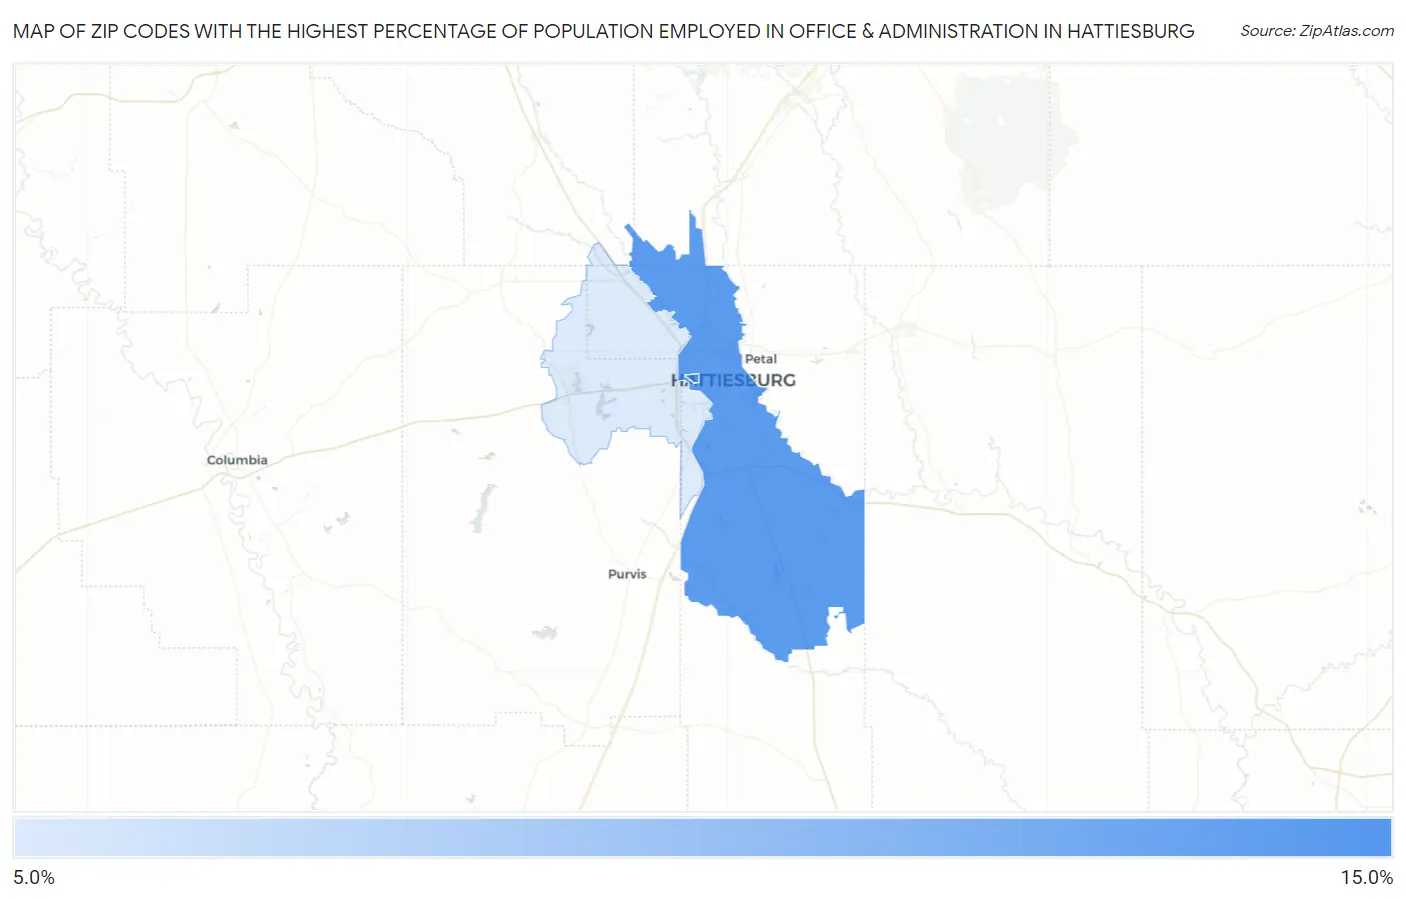
Map of Zip Codes with the Highest Percentage of Population Employed in Office & Administration in Hattiesburg
9.3%
14.9%
Zip Codes with the Highest Percentage of Population Employed in Office & Administration in Hattiesburg, MS
| Zip Code | % Employed | vs State | vs National | |
| 1. | 39406 | 14.9% | 10.8%(+4.13)#67 | 10.9%(+4.03)#4,717 |
| 2. | 39401 | 14.2% | 10.8%(+3.41)#85 | 10.9%(+3.31)#5,760 |
| 3. | 39402 | 9.3% | 10.8%(-1.48)#237 | 10.9%(-1.58)#19,453 |
1
Common Questions
What are the Top Zip Codes with the Highest Percentage of Population Employed in Office & Administration in Hattiesburg, MS?
Top Zip Codes with the Highest Percentage of Population Employed in Office & Administration in Hattiesburg, MS are:
What zip code has the Highest Percentage of Population Employed in Office & Administration in Hattiesburg, MS?
39406 has the Highest Percentage of Population Employed in Office & Administration in Hattiesburg, MS with 14.9%.
What is the Percentage of Population Employed in Office & Administration in Hattiesburg, MS?
Percentage of Population Employed in Office & Administration in Hattiesburg is 12.8%.
What is the Percentage of Population Employed in Office & Administration in Mississippi?
Percentage of Population Employed in Office & Administration in Mississippi is 10.8%.
What is the Percentage of Population Employed in Office & Administration in the United States?
Percentage of Population Employed in Office & Administration in the United States is 10.9%.