Zip Codes with the Highest Percentage of Population Employed in Food Preparation & Serving in Tupelo, MS
RELATED REPORTS & OPTIONS
Food Preparation & Serving
Tupelo
Compare Zip Codes
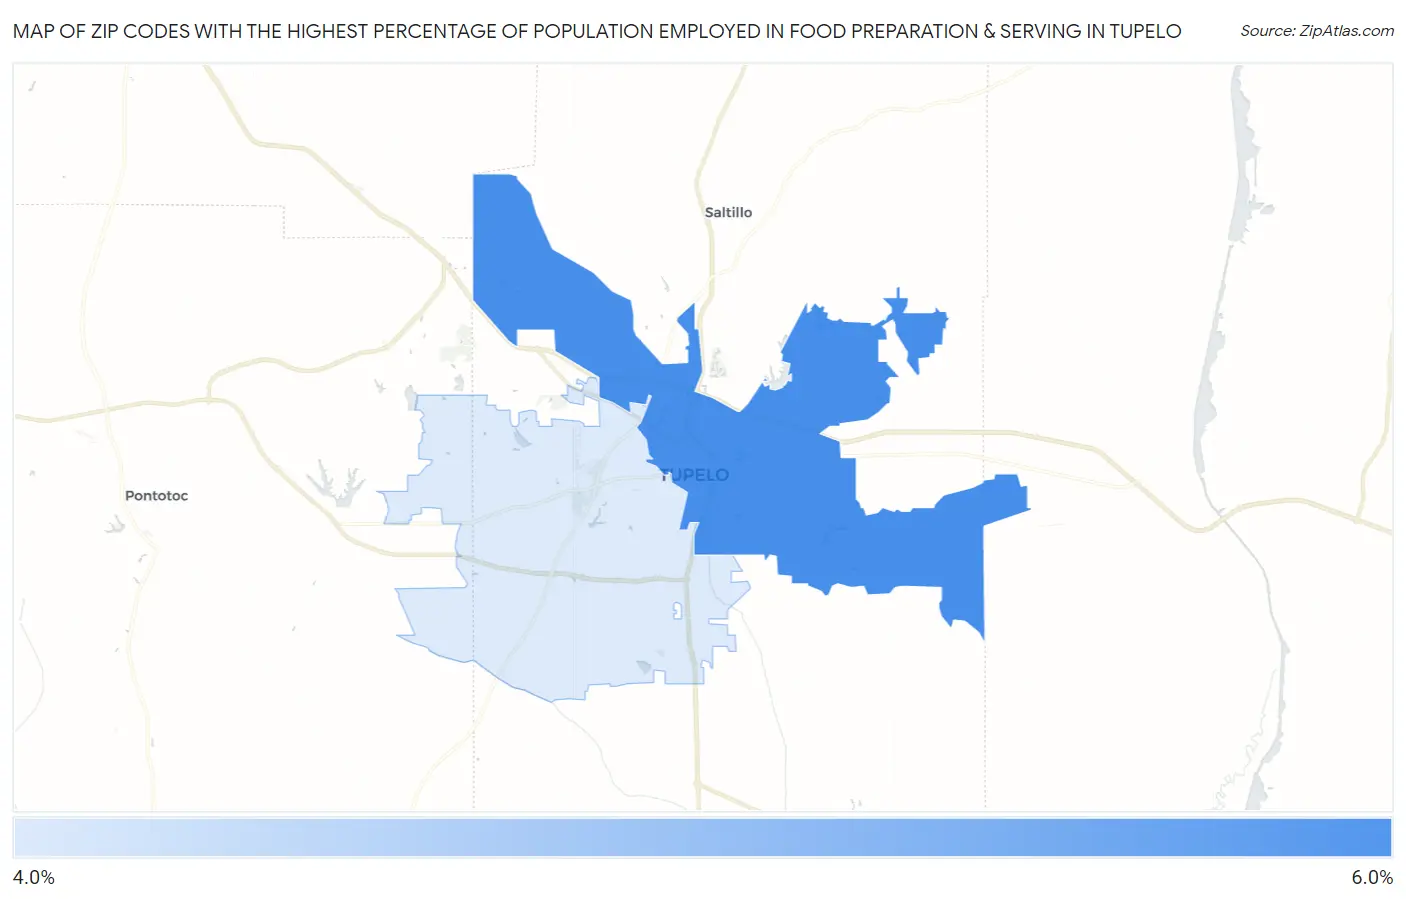
Map of Zip Codes with the Highest Percentage of Population Employed in Food Preparation & Serving in Tupelo
4.3%
5.8%
Zip Codes with the Highest Percentage of Population Employed in Food Preparation & Serving in Tupelo, MS
| Zip Code | % Employed | vs State | vs National | |
| 1. | 38804 | 5.8% | 5.6%(+0.251)#129 | 5.3%(+0.557)#9,888 |
| 2. | 38801 | 4.3% | 5.6%(-1.30)#191 | 5.3%(-0.991)#15,905 |
1
Common Questions
What are the Top Zip Codes with the Highest Percentage of Population Employed in Food Preparation & Serving in Tupelo, MS?
Top Zip Codes with the Highest Percentage of Population Employed in Food Preparation & Serving in Tupelo, MS are:
What zip code has the Highest Percentage of Population Employed in Food Preparation & Serving in Tupelo, MS?
38804 has the Highest Percentage of Population Employed in Food Preparation & Serving in Tupelo, MS with 5.8%.
What is the Percentage of Population Employed in Food Preparation & Serving in Tupelo, MS?
Percentage of Population Employed in Food Preparation & Serving in Tupelo is 4.8%.
What is the Percentage of Population Employed in Food Preparation & Serving in Mississippi?
Percentage of Population Employed in Food Preparation & Serving in Mississippi is 5.6%.
What is the Percentage of Population Employed in Food Preparation & Serving in the United States?
Percentage of Population Employed in Food Preparation & Serving in the United States is 5.3%.