Zip Codes with the Highest Percentage of Population Employed in Food Preparation & Serving in Pascagoula, MS
RELATED REPORTS & OPTIONS
Food Preparation & Serving
Pascagoula
Compare Zip Codes
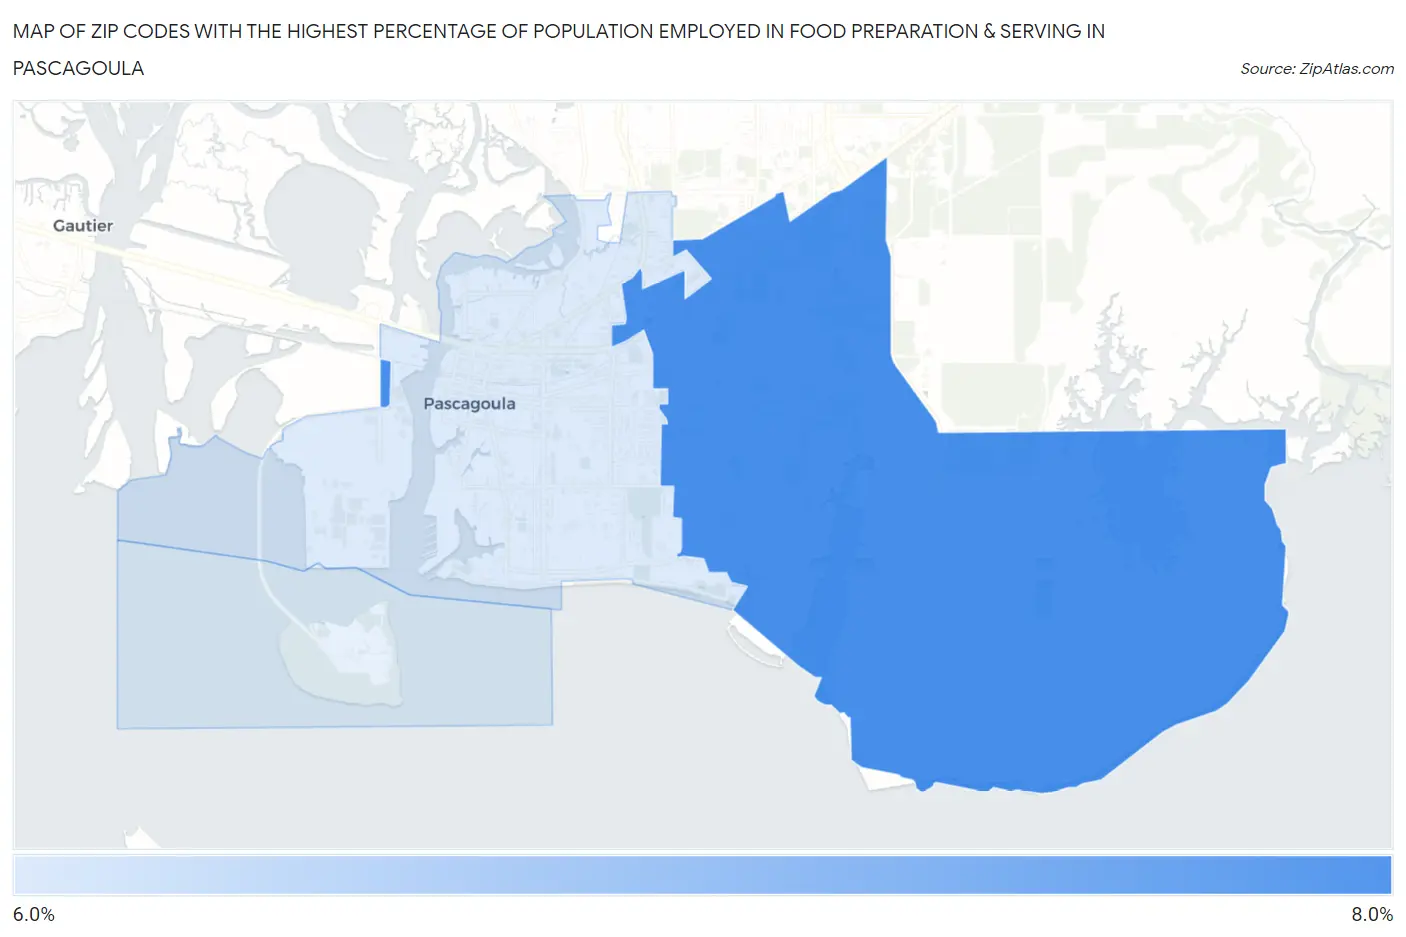
Map of Zip Codes with the Highest Percentage of Population Employed in Food Preparation & Serving in Pascagoula
6.1%
7.4%
Zip Codes with the Highest Percentage of Population Employed in Food Preparation & Serving in Pascagoula, MS
| Zip Code | % Employed | vs State | vs National | |
| 1. | 39581 | 7.4% | 5.6%(+1.81)#78 | 5.3%(+2.12)#5,739 |
| 2. | 39567 | 6.1% | 5.6%(+0.555)#121 | 5.3%(+0.862)#8,886 |
1
Common Questions
What are the Top Zip Codes with the Highest Percentage of Population Employed in Food Preparation & Serving in Pascagoula, MS?
Top Zip Codes with the Highest Percentage of Population Employed in Food Preparation & Serving in Pascagoula, MS are:
What zip code has the Highest Percentage of Population Employed in Food Preparation & Serving in Pascagoula, MS?
39581 has the Highest Percentage of Population Employed in Food Preparation & Serving in Pascagoula, MS with 7.4%.
What is the Percentage of Population Employed in Food Preparation & Serving in Pascagoula, MS?
Percentage of Population Employed in Food Preparation & Serving in Pascagoula is 6.9%.
What is the Percentage of Population Employed in Food Preparation & Serving in Mississippi?
Percentage of Population Employed in Food Preparation & Serving in Mississippi is 5.6%.
What is the Percentage of Population Employed in Food Preparation & Serving in the United States?
Percentage of Population Employed in Food Preparation & Serving in the United States is 5.3%.