Zip Codes with the Highest Percentage of Population Employed in Food Preparation & Serving in Brandon, MS
RELATED REPORTS & OPTIONS
Food Preparation & Serving
Brandon
Compare Zip Codes
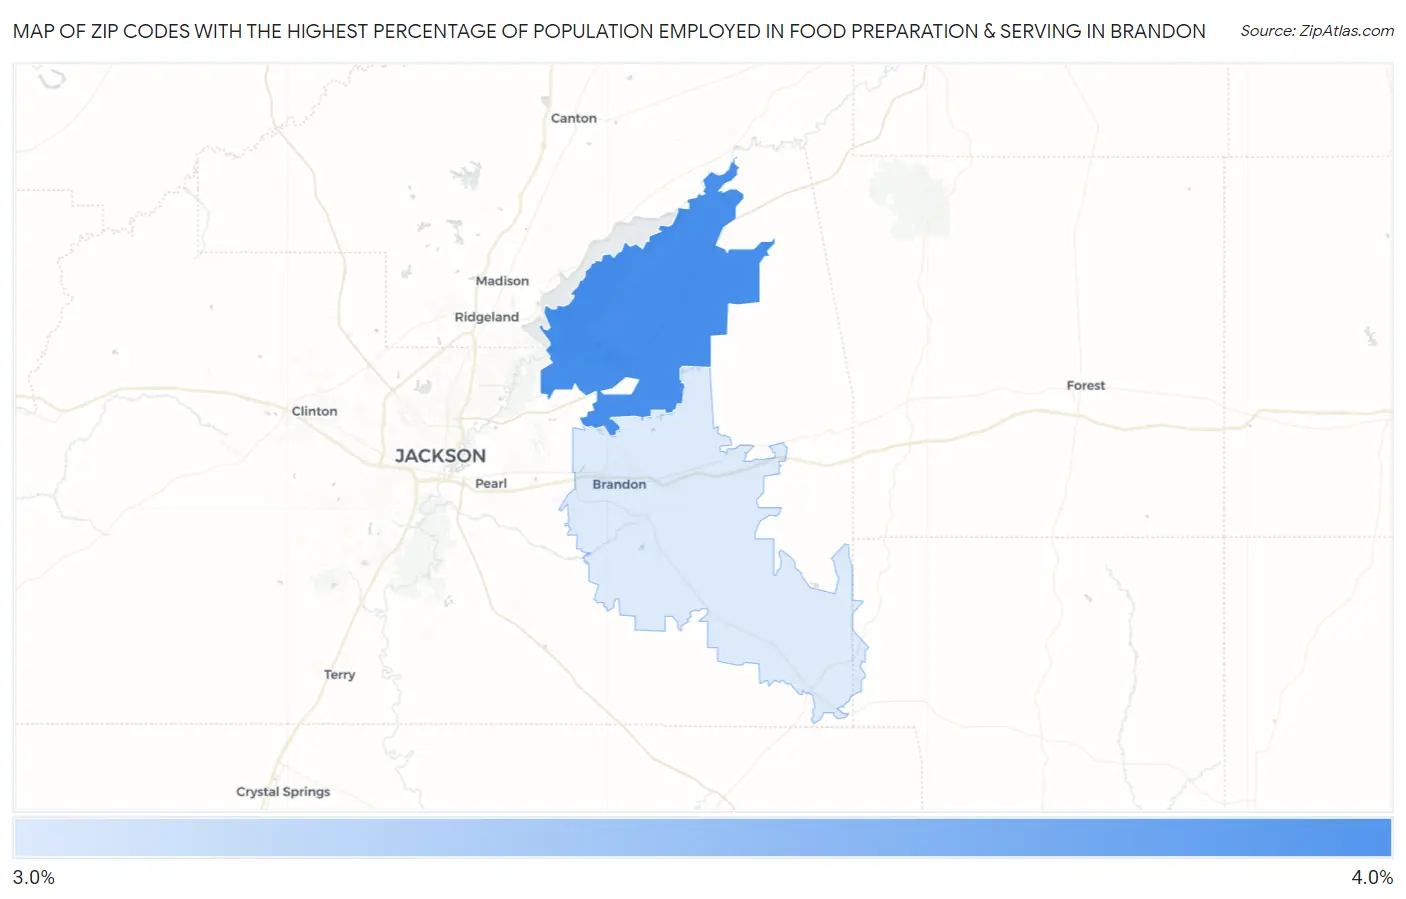
Map of Zip Codes with the Highest Percentage of Population Employed in Food Preparation & Serving in Brandon
3.2%
3.8%
Zip Codes with the Highest Percentage of Population Employed in Food Preparation & Serving in Brandon, MS
| Zip Code | % Employed | vs State | vs National | |
| 1. | 39047 | 3.8% | 5.6%(-1.76)#212 | 5.3%(-1.45)#17,805 |
| 2. | 39042 | 3.2% | 5.6%(-2.34)#228 | 5.3%(-2.04)#20,293 |
1
Common Questions
What are the Top Zip Codes with the Highest Percentage of Population Employed in Food Preparation & Serving in Brandon, MS?
Top Zip Codes with the Highest Percentage of Population Employed in Food Preparation & Serving in Brandon, MS are:
What zip code has the Highest Percentage of Population Employed in Food Preparation & Serving in Brandon, MS?
39047 has the Highest Percentage of Population Employed in Food Preparation & Serving in Brandon, MS with 3.8%.
What is the Percentage of Population Employed in Food Preparation & Serving in Brandon, MS?
Percentage of Population Employed in Food Preparation & Serving in Brandon is 2.7%.
What is the Percentage of Population Employed in Food Preparation & Serving in Mississippi?
Percentage of Population Employed in Food Preparation & Serving in Mississippi is 5.6%.
What is the Percentage of Population Employed in Food Preparation & Serving in the United States?
Percentage of Population Employed in Food Preparation & Serving in the United States is 5.3%.