Zip Codes with the Highest Percentage of Population Employed in Arts, Entertainment & Recreation in Utica, MI
RELATED REPORTS & OPTIONS
Arts, Entertainment & Recreation
Utica
Compare Zip Codes
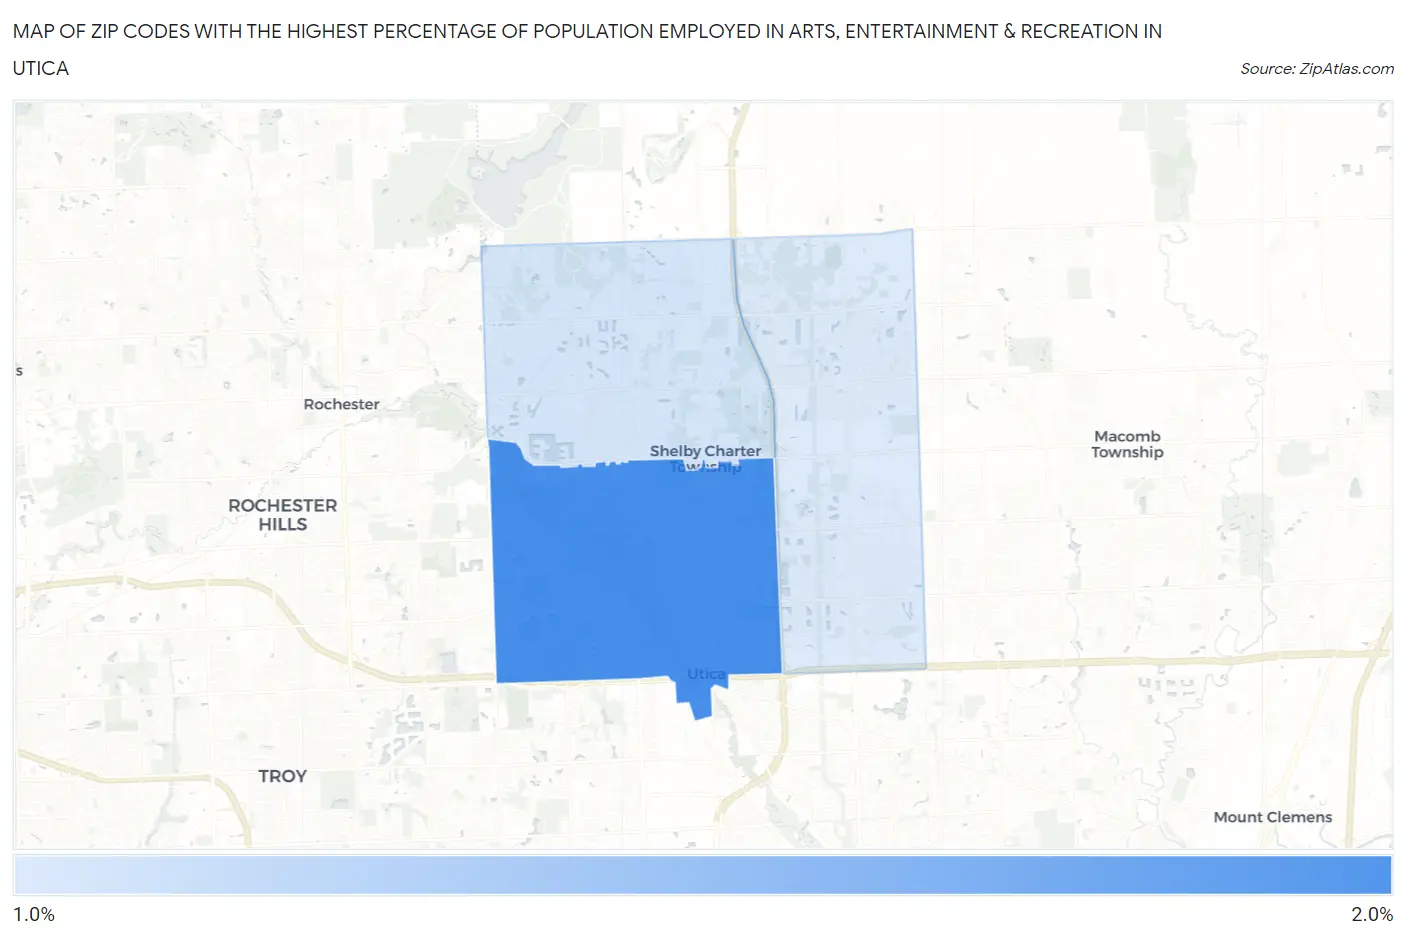
Map of Zip Codes with the Highest Percentage of Population Employed in Arts, Entertainment & Recreation in Utica
0.0%
2.0%
Zip Codes with the Highest Percentage of Population Employed in Arts, Entertainment & Recreation in Utica, MI
| Zip Code | % Employed | vs State | vs National | |
| 1. | 48317 | 1.7% | 1.8%(-0.081)#395 | 2.1%(-0.378)#11,700 |
| 2. | 48316 | 1.3% | 1.8%(-0.464)#524 | 2.1%(-0.760)#14,560 |
| 3. | 48315 | 1.3% | 1.8%(-0.482)#527 | 2.1%(-0.778)#14,689 |
1
Common Questions
What are the Top Zip Codes with the Highest Percentage of Population Employed in Arts, Entertainment & Recreation in Utica, MI?
Top Zip Codes with the Highest Percentage of Population Employed in Arts, Entertainment & Recreation in Utica, MI are:
What zip code has the Highest Percentage of Population Employed in Arts, Entertainment & Recreation in Utica, MI?
48317 has the Highest Percentage of Population Employed in Arts, Entertainment & Recreation in Utica, MI with 1.7%.
What is the Percentage of Population Employed in Arts, Entertainment & Recreation in Utica, MI?
Percentage of Population Employed in Arts, Entertainment & Recreation in Utica is 1.9%.
What is the Percentage of Population Employed in Arts, Entertainment & Recreation in Michigan?
Percentage of Population Employed in Arts, Entertainment & Recreation in Michigan is 1.8%.
What is the Percentage of Population Employed in Arts, Entertainment & Recreation in the United States?
Percentage of Population Employed in Arts, Entertainment & Recreation in the United States is 2.1%.