Zip Codes with the Highest Percentage of Population Employed in Sales & Related in Highland, MI
RELATED REPORTS & OPTIONS
Sales & Related
Highland
Compare Zip Codes
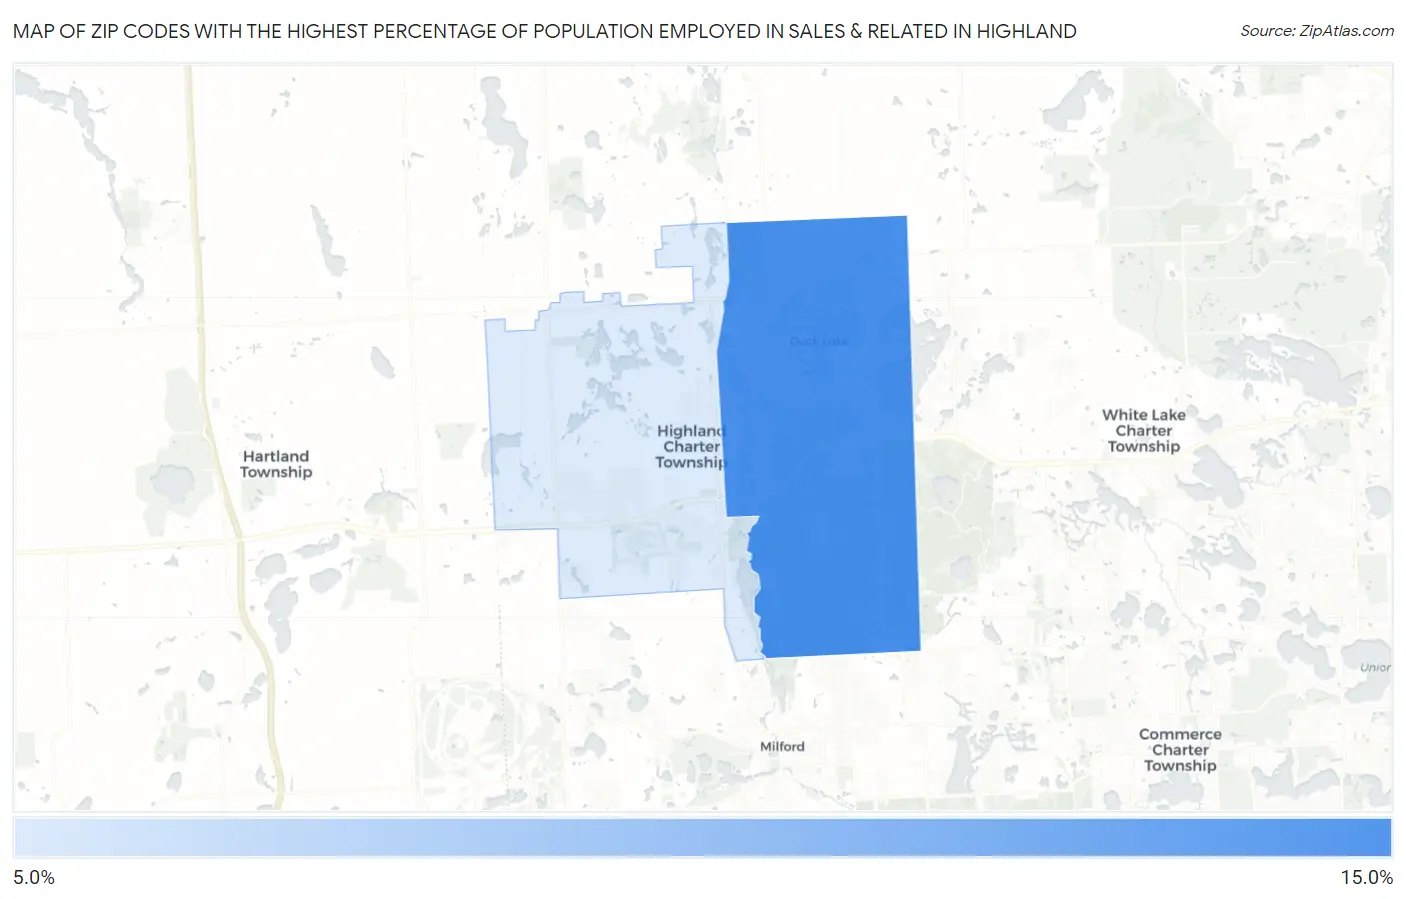
Map of Zip Codes with the Highest Percentage of Population Employed in Sales & Related in Highland
12.5%
13.4%
Zip Codes with the Highest Percentage of Population Employed in Sales & Related in Highland, MI
| Zip Code | % Employed | vs State | vs National | |
| 1. | 48356 | 13.4% | 9.1%(+4.22)#90 | 9.6%(+3.76)#4,098 |
| 2. | 48357 | 12.5% | 9.1%(+3.37)#124 | 9.6%(+2.91)#5,159 |
1
Common Questions
What are the Top Zip Codes with the Highest Percentage of Population Employed in Sales & Related in Highland, MI?
Top Zip Codes with the Highest Percentage of Population Employed in Sales & Related in Highland, MI are:
What zip code has the Highest Percentage of Population Employed in Sales & Related in Highland, MI?
48356 has the Highest Percentage of Population Employed in Sales & Related in Highland, MI with 13.4%.
What is the Percentage of Population Employed in Sales & Related in Michigan?
Percentage of Population Employed in Sales & Related in Michigan is 9.1%.
What is the Percentage of Population Employed in Sales & Related in the United States?
Percentage of Population Employed in Sales & Related in the United States is 9.6%.