Zip Codes with the Highest Percentage of Population Employed in Arts, Entertainment & Recreation in Highland, MI
RELATED REPORTS & OPTIONS
Arts, Entertainment & Recreation
Highland
Compare Zip Codes
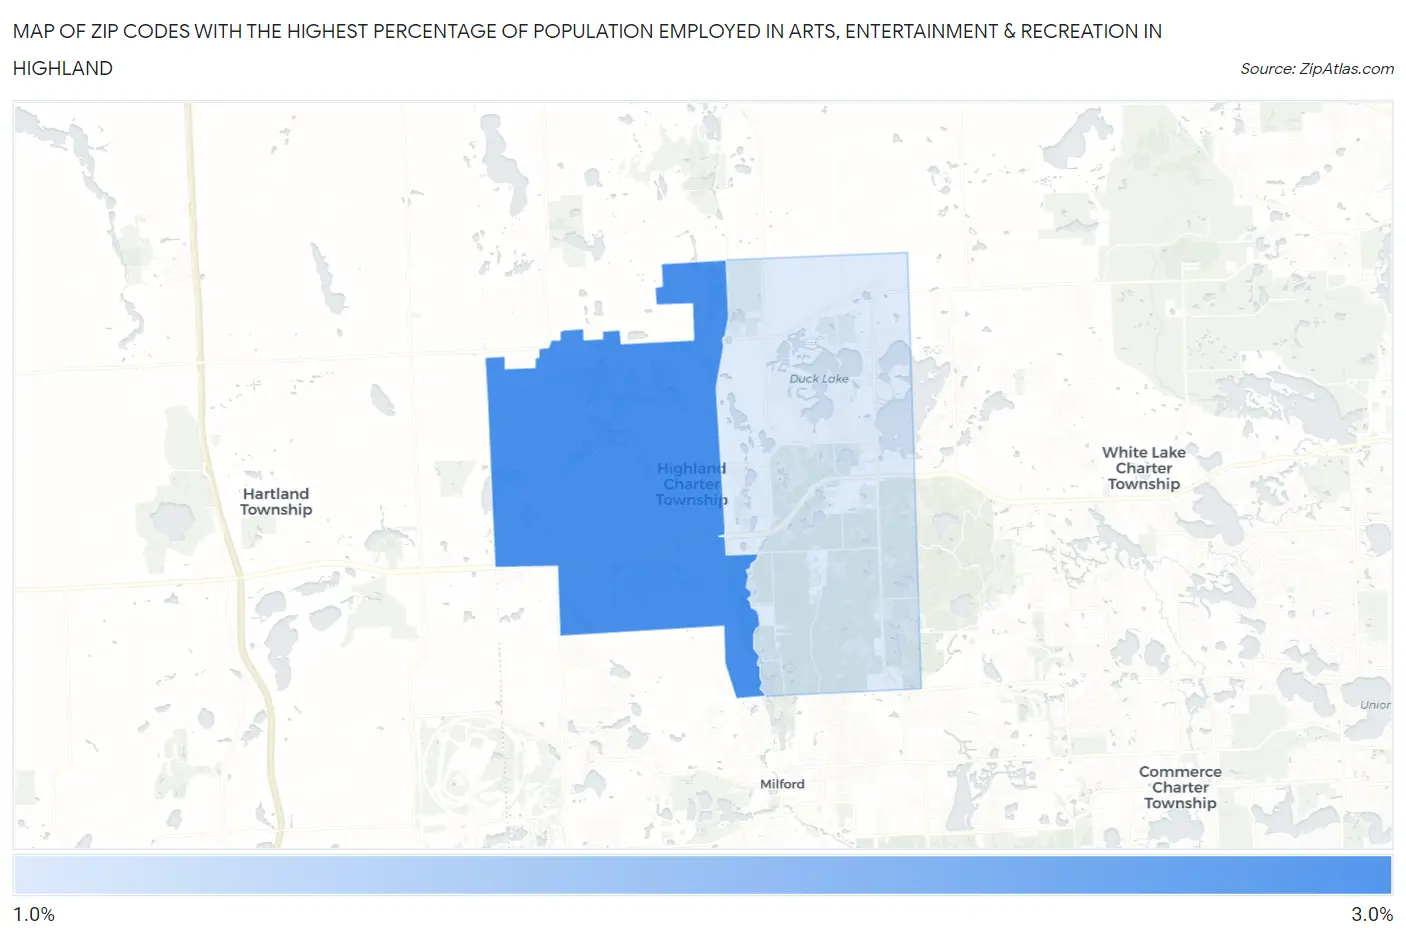
Map of Zip Codes with the Highest Percentage of Population Employed in Arts, Entertainment & Recreation in Highland
0.0%
3.0%
Zip Codes with the Highest Percentage of Population Employed in Arts, Entertainment & Recreation in Highland, MI
| Zip Code | % Employed | vs State | vs National | |
| 1. | 48357 | 2.8% | 1.8%(+1.03)#163 | 2.1%(+0.733)#5,937 |
| 2. | 48356 | 1.1% | 1.8%(-0.722)#591 | 2.1%(-1.02)#16,507 |
1
Common Questions
What are the Top Zip Codes with the Highest Percentage of Population Employed in Arts, Entertainment & Recreation in Highland, MI?
Top Zip Codes with the Highest Percentage of Population Employed in Arts, Entertainment & Recreation in Highland, MI are:
What zip code has the Highest Percentage of Population Employed in Arts, Entertainment & Recreation in Highland, MI?
48357 has the Highest Percentage of Population Employed in Arts, Entertainment & Recreation in Highland, MI with 2.8%.
What is the Percentage of Population Employed in Arts, Entertainment & Recreation in Michigan?
Percentage of Population Employed in Arts, Entertainment & Recreation in Michigan is 1.8%.
What is the Percentage of Population Employed in Arts, Entertainment & Recreation in the United States?
Percentage of Population Employed in Arts, Entertainment & Recreation in the United States is 2.1%.