Zip Codes with the Highest Percentage of Population Employed in Agriculture, Fishing & Hunting in Highland, MI
RELATED REPORTS & OPTIONS
Agriculture, Fishing & Hunting
Highland
Compare Zip Codes
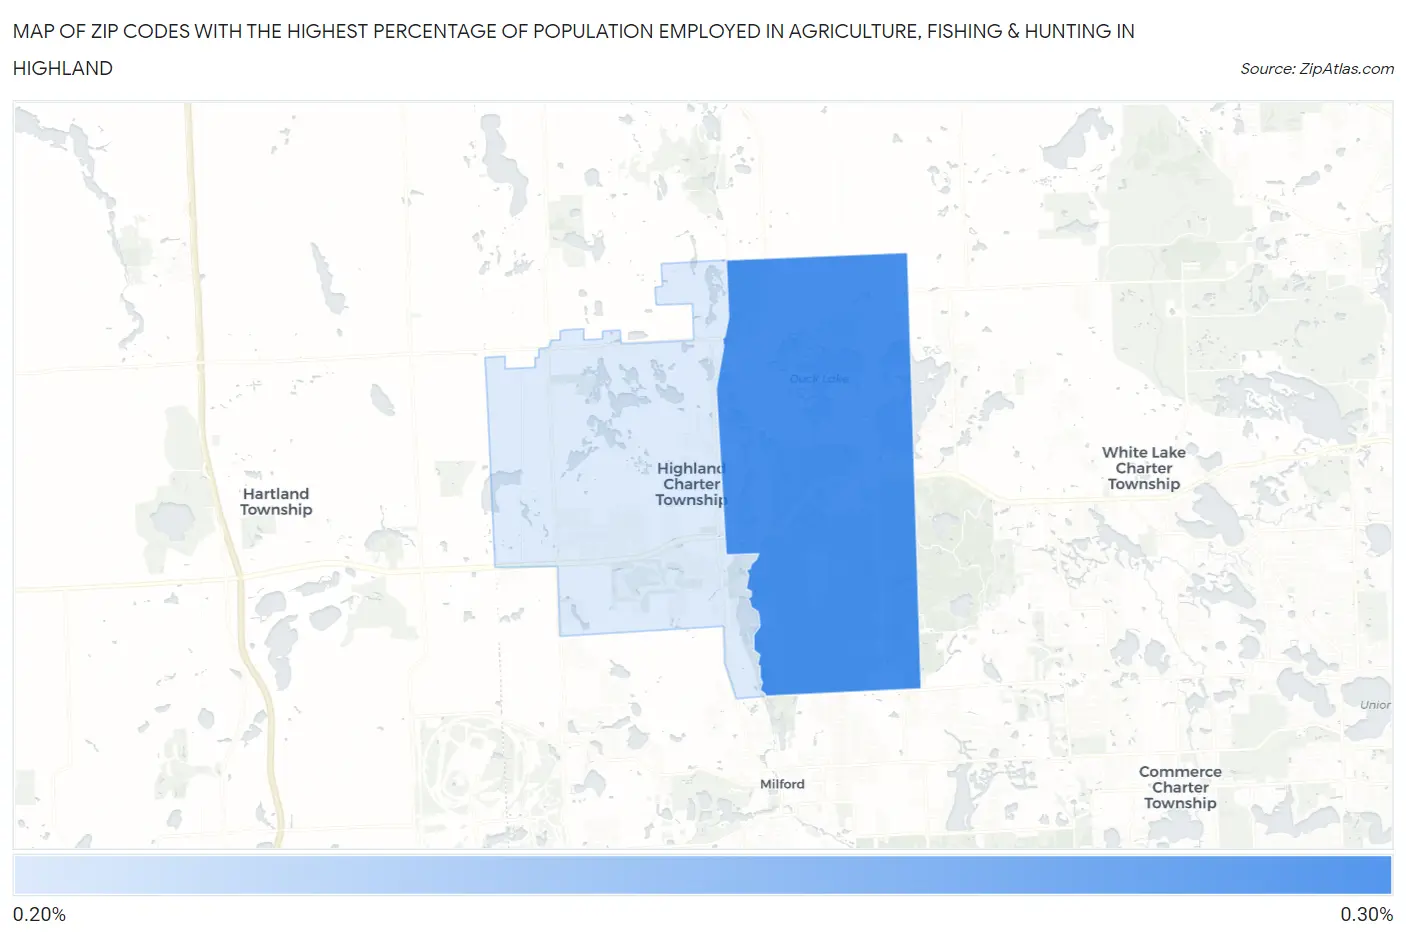
Map of Zip Codes with the Highest Percentage of Population Employed in Agriculture, Fishing & Hunting in Highland
0.0%
0.30%
Zip Codes with the Highest Percentage of Population Employed in Agriculture, Fishing & Hunting in Highland, MI
| Zip Code | % Employed | vs State | vs National | |
| 1. | 48356 | 0.28% | 0.98%(-0.706)#712 | 1.2%(-0.922)#21,439 |
| 2. | 48357 | 0.27% | 0.98%(-0.710)#714 | 1.2%(-0.925)#21,483 |
1
Common Questions
What are the Top Zip Codes with the Highest Percentage of Population Employed in Agriculture, Fishing & Hunting in Highland, MI?
Top Zip Codes with the Highest Percentage of Population Employed in Agriculture, Fishing & Hunting in Highland, MI are:
What zip code has the Highest Percentage of Population Employed in Agriculture, Fishing & Hunting in Highland, MI?
48356 has the Highest Percentage of Population Employed in Agriculture, Fishing & Hunting in Highland, MI with 0.28%.
What is the Percentage of Population Employed in Agriculture, Fishing & Hunting in Michigan?
Percentage of Population Employed in Agriculture, Fishing & Hunting in Michigan is 0.98%.
What is the Percentage of Population Employed in Agriculture, Fishing & Hunting in the United States?
Percentage of Population Employed in Agriculture, Fishing & Hunting in the United States is 1.2%.