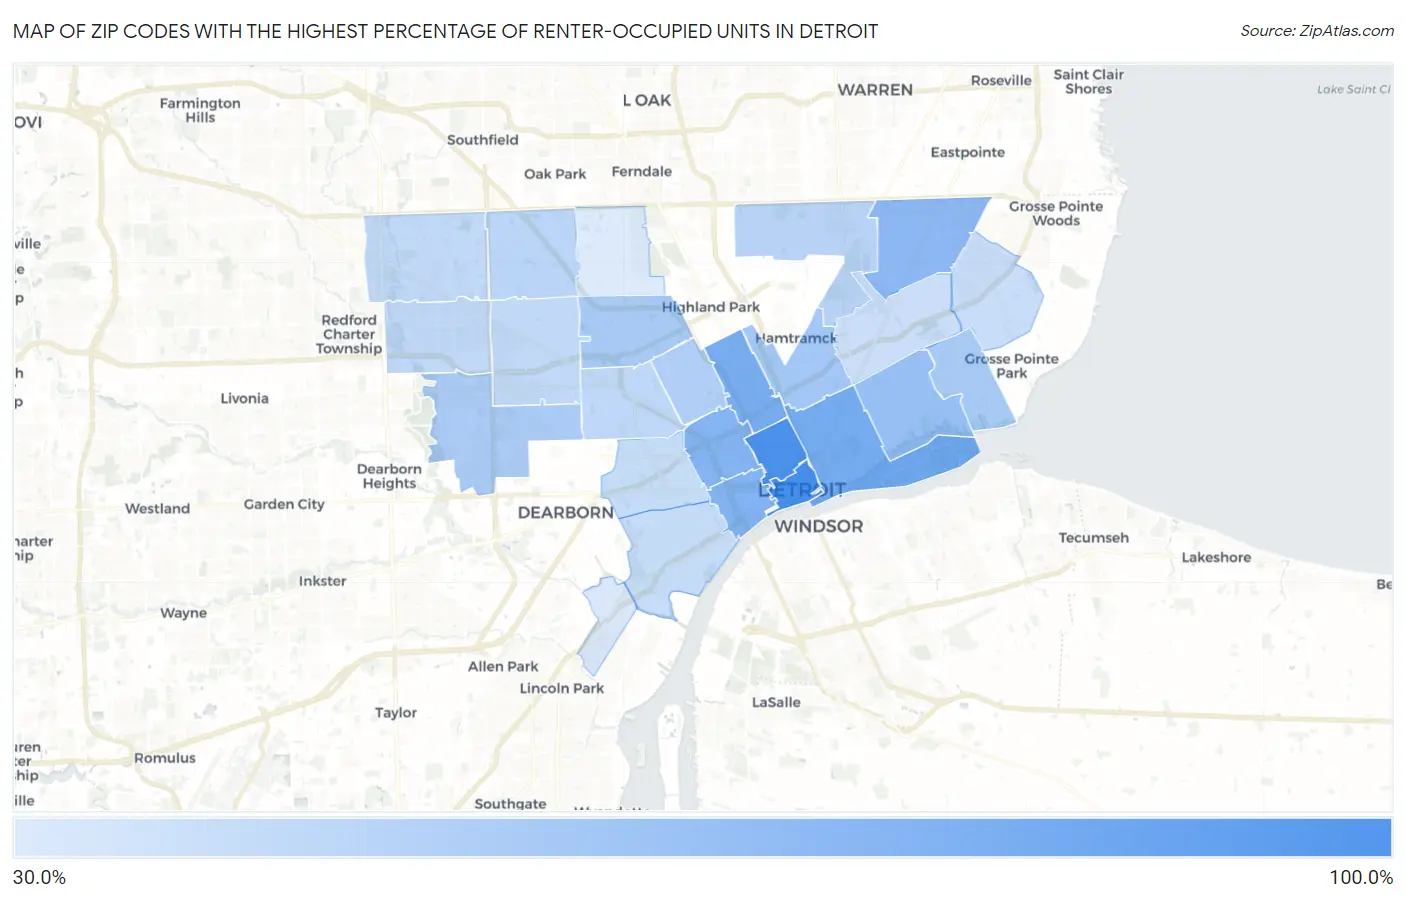
Zip Codes with the Highest Percentage of Renter-Occupied Units in Detroit, MI
RELATED REPORTS & OPTIONS
Highest Renter-Occupied
Detroit
Compare Zip Codes
Map of Zip Codes with the Highest Percentage of Renter-Occupied Units in Detroit
0.0%
100.0%
Zip Codes with the Highest Percentage of Renter-Occupied Units in Detroit, MI
| Zip Code | % Renter-Occupied | vs State | vs National | |
| 1. | 48226 | 90.2% | 27.5%(+62.7)#6 | 35.2%(+55.1)#460 |
| 2. | 48201 | 88.6% | 27.5%(+61.1)#8 | 35.2%(+53.4)#502 |
| 3. | 48207 | 71.9% | 27.5%(+44.4)#13 | 35.2%(+36.7)#961 |
| 4. | 48202 | 70.7% | 27.5%(+43.2)#14 | 35.2%(+35.5)#1,031 |
| 5. | 48216 | 67.1% | 27.5%(+39.6)#16 | 35.2%(+31.9)#1,232 |
| 6. | 48208 | 66.3% | 27.5%(+38.8)#17 | 35.2%(+31.1)#1,284 |
| 7. | 48205 | 63.2% | 27.5%(+35.7)#21 | 35.2%(+28.0)#1,535 |
| 8. | 48214 | 58.9% | 27.5%(+31.4)#27 | 35.2%(+23.7)#1,903 |
| 9. | 48211 | 54.8% | 27.5%(+27.3)#35 | 35.2%(+19.6)#2,365 |
| 10. | 48238 | 53.4% | 27.5%(+25.9)#37 | 35.2%(+18.2)#2,563 |
| 11. | 48215 | 53.1% | 27.5%(+25.6)#38 | 35.2%(+17.9)#2,604 |
| 12. | 48228 | 52.1% | 27.5%(+24.6)#40 | 35.2%(+16.9)#2,747 |
| 13. | 48206 | 49.9% | 27.5%(+22.4)#48 | 35.2%(+14.8)#3,104 |
| 14. | 48234 | 47.7% | 27.5%(+20.2)#52 | 35.2%(+12.5)#3,515 |
| 15. | 48235 | 46.7% | 27.5%(+19.2)#54 | 35.2%(+11.6)#3,684 |
| 16. | 48204 | 45.5% | 27.5%(+18.0)#58 | 35.2%(+10.3)#3,941 |
| 17. | 48219 | 44.8% | 27.5%(+17.3)#62 | 35.2%(+9.62)#4,112 |
| 18. | 48223 | 44.8% | 27.5%(+17.3)#63 | 35.2%(+9.62)#4,113 |
| 19. | 48227 | 44.6% | 27.5%(+17.1)#65 | 35.2%(+9.45)#4,154 |
| 20. | 48210 | 43.5% | 27.5%(+15.9)#69 | 35.2%(+8.27)#4,456 |
| 21. | 48209 | 43.1% | 27.5%(+15.6)#70 | 35.2%(+7.93)#4,548 |
| 22. | 48224 | 42.6% | 27.5%(+15.1)#74 | 35.2%(+7.45)#4,675 |
| 23. | 48213 | 41.9% | 27.5%(+14.3)#83 | 35.2%(+6.67)#4,875 |
| 24. | 48217 | 37.0% | 27.5%(+9.52)#112 | 35.2%(+1.84)#6,477 |
| 25. | 48221 | 36.0% | 27.5%(+8.53)#117 | 35.2%(+0.847)#6,884 |
1
Common Questions
What are the Top 10 Zip Codes with the Highest Percentage of Renter-Occupied Units in Detroit, MI?
Top 10 Zip Codes with the Highest Percentage of Renter-Occupied Units in Detroit, MI are:
What zip code has the Highest Percentage of Renter-Occupied Units in Detroit, MI?
48226 has the Highest Percentage of Renter-Occupied Units in Detroit, MI with 90.2%.
What is the Percentage of Renter-Occupied Units in Detroit, MI?
Percentage of Renter-Occupied Units in Detroit is 51.2%.
What is the Percentage of Renter-Occupied Units in Michigan?
Percentage of Renter-Occupied Units in Michigan is 27.5%.
What is the Percentage of Renter-Occupied Units in the United States?
Percentage of Renter-Occupied Units in the United States is 35.2%.