Zip Codes with the Highest Percentage of Population Employed in Construction & Extraction in Detroit, MI
RELATED REPORTS & OPTIONS
Construction & Extraction
Detroit
Compare Zip Codes
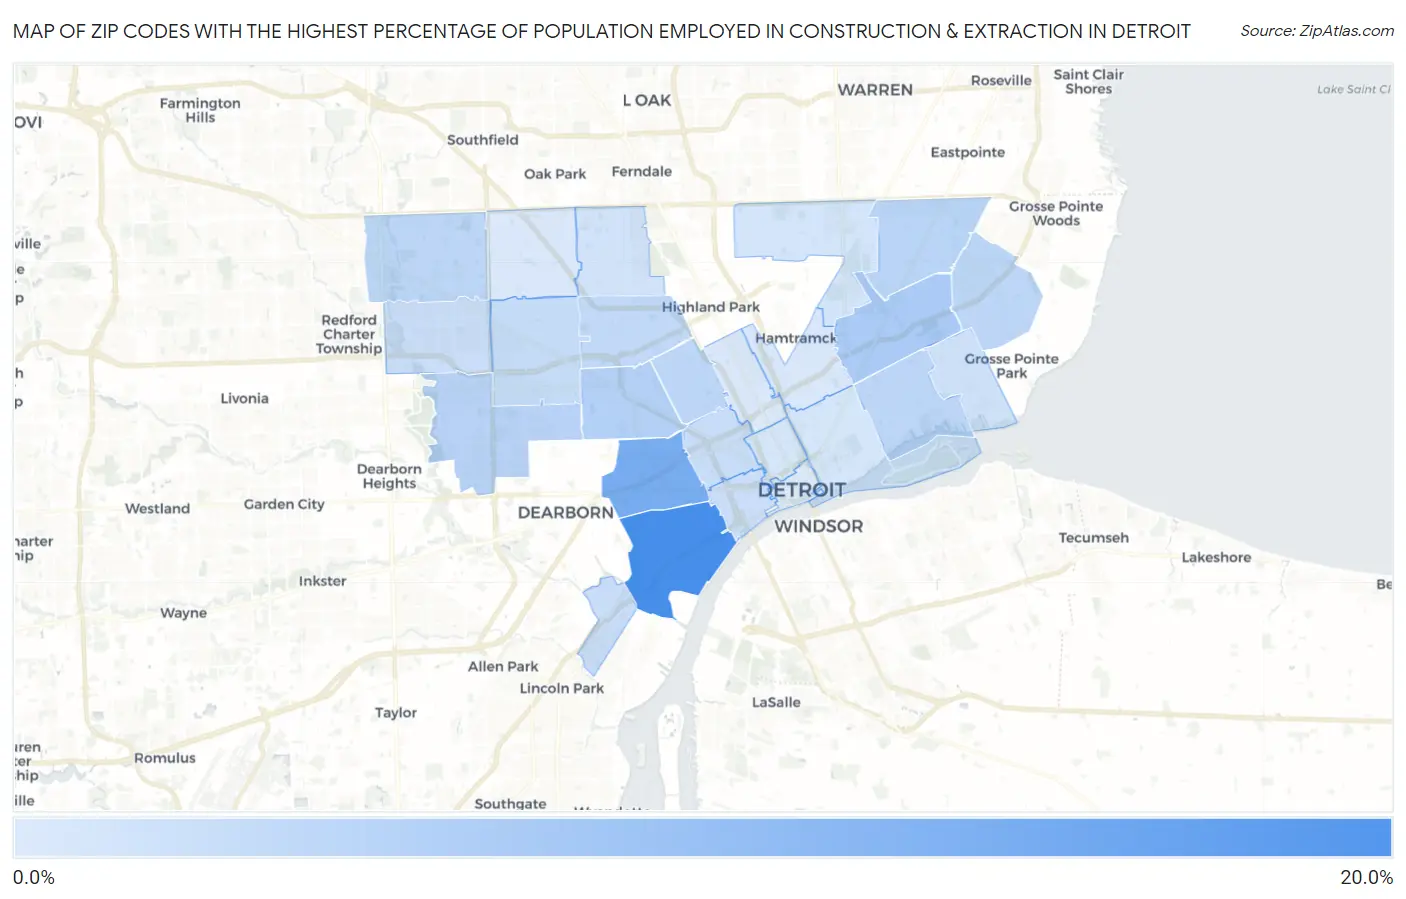
Map of Zip Codes with the Highest Percentage of Population Employed in Construction & Extraction in Detroit
0.0%
20.0%
Zip Codes with the Highest Percentage of Population Employed in Construction & Extraction in Detroit, MI
| Zip Code | % Employed | vs State | vs National | |
| 1. | 48209 | 17.1% | 4.4%(+12.7)#19 | 5.0%(+12.1)#1,448 |
| 2. | 48210 | 11.5% | 4.4%(+7.13)#65 | 5.0%(+6.50)#3,959 |
| 3. | 48213 | 5.9% | 4.4%(+1.52)#402 | 5.0%(+0.897)#13,795 |
| 4. | 48204 | 5.0% | 4.4%(+0.589)#530 | 5.0%(-0.039)#16,916 |
| 5. | 48228 | 4.5% | 4.4%(+0.090)#600 | 5.0%(-0.538)#18,676 |
| 6. | 48205 | 4.2% | 4.4%(-0.210)#647 | 5.0%(-0.838)#19,776 |
| 7. | 48214 | 3.9% | 4.4%(-0.417)#678 | 5.0%(-1.04)#20,522 |
| 8. | 48206 | 3.9% | 4.4%(-0.424)#680 | 5.0%(-1.05)#20,557 |
| 9. | 48219 | 3.9% | 4.4%(-0.472)#689 | 5.0%(-1.10)#20,709 |
| 10. | 48224 | 3.9% | 4.4%(-0.472)#690 | 5.0%(-1.10)#20,710 |
| 11. | 48238 | 3.4% | 4.4%(-0.927)#746 | 5.0%(-1.55)#22,197 |
| 12. | 48227 | 3.0% | 4.4%(-1.36)#781 | 5.0%(-1.99)#23,590 |
| 13. | 48217 | 2.7% | 4.4%(-1.62)#800 | 5.0%(-2.25)#24,360 |
| 14. | 48208 | 2.7% | 4.4%(-1.65)#804 | 5.0%(-2.28)#24,447 |
| 15. | 48216 | 2.4% | 4.4%(-1.98)#835 | 5.0%(-2.61)#25,330 |
| 16. | 48223 | 2.4% | 4.4%(-2.00)#838 | 5.0%(-2.63)#25,395 |
| 17. | 48215 | 1.9% | 4.4%(-2.47)#871 | 5.0%(-3.10)#26,590 |
| 18. | 48221 | 1.7% | 4.4%(-2.62)#885 | 5.0%(-3.25)#26,909 |
| 19. | 48234 | 1.5% | 4.4%(-2.82)#893 | 5.0%(-3.45)#27,333 |
| 20. | 48207 | 1.3% | 4.4%(-3.07)#904 | 5.0%(-3.70)#27,837 |
| 21. | 48201 | 1.2% | 4.4%(-3.21)#909 | 5.0%(-3.84)#28,045 |
| 22. | 48211 | 0.97% | 4.4%(-3.39)#920 | 5.0%(-4.02)#28,352 |
| 23. | 48202 | 0.73% | 4.4%(-3.64)#928 | 5.0%(-4.26)#28,689 |
| 24. | 48235 | 0.68% | 4.4%(-3.68)#930 | 5.0%(-4.31)#28,750 |
| 25. | 48226 | 0.49% | 4.4%(-3.88)#933 | 5.0%(-4.51)#28,932 |
1
Common Questions
What are the Top 10 Zip Codes with the Highest Percentage of Population Employed in Construction & Extraction in Detroit, MI?
Top 10 Zip Codes with the Highest Percentage of Population Employed in Construction & Extraction in Detroit, MI are:
What zip code has the Highest Percentage of Population Employed in Construction & Extraction in Detroit, MI?
48209 has the Highest Percentage of Population Employed in Construction & Extraction in Detroit, MI with 17.1%.
What is the Percentage of Population Employed in Construction & Extraction in Detroit, MI?
Percentage of Population Employed in Construction & Extraction in Detroit is 3.9%.
What is the Percentage of Population Employed in Construction & Extraction in Michigan?
Percentage of Population Employed in Construction & Extraction in Michigan is 4.4%.
What is the Percentage of Population Employed in Construction & Extraction in the United States?
Percentage of Population Employed in Construction & Extraction in the United States is 5.0%.