Zip Codes with the Highest Percentage of Population Employed in Office & Administration in Ellicott City, MD
RELATED REPORTS & OPTIONS
Office & Administration
Ellicott City
Compare Zip Codes
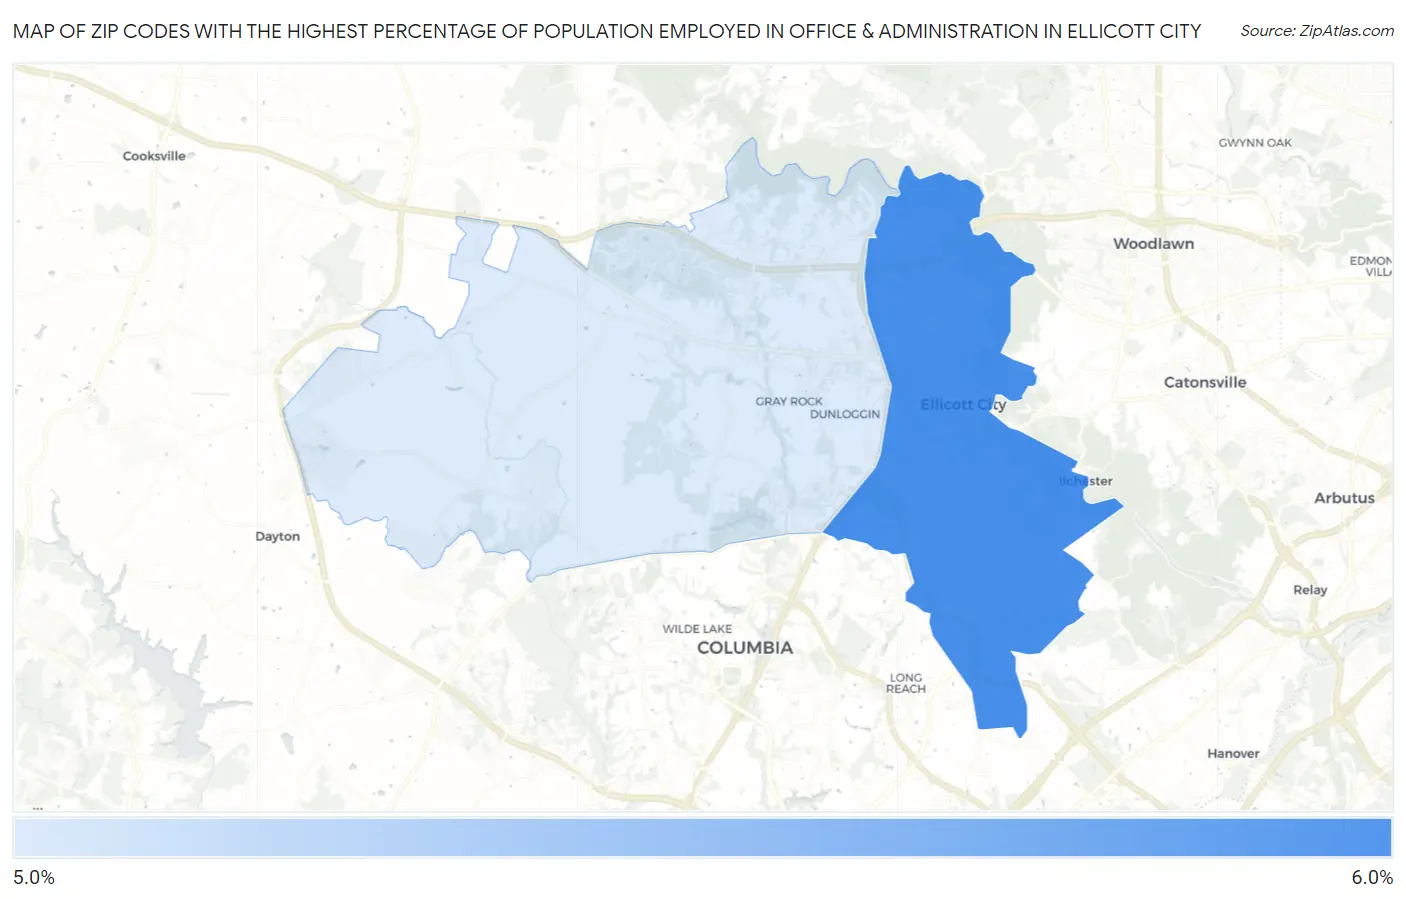
Map of Zip Codes with the Highest Percentage of Population Employed in Office & Administration in Ellicott City
5.3%
6.0%
Zip Codes with the Highest Percentage of Population Employed in Office & Administration in Ellicott City, MD
| Zip Code | % Employed | vs State | vs National | |
| 1. | 21043 | 6.0% | 10.4%(-4.43)#372 | 10.9%(-4.89)#26,894 |
| 2. | 21042 | 5.3% | 10.4%(-5.07)#390 | 10.9%(-5.53)#27,752 |
1
Common Questions
What are the Top Zip Codes with the Highest Percentage of Population Employed in Office & Administration in Ellicott City, MD?
Top Zip Codes with the Highest Percentage of Population Employed in Office & Administration in Ellicott City, MD are:
What zip code has the Highest Percentage of Population Employed in Office & Administration in Ellicott City, MD?
21043 has the Highest Percentage of Population Employed in Office & Administration in Ellicott City, MD with 6.0%.
What is the Percentage of Population Employed in Office & Administration in Ellicott City, MD?
Percentage of Population Employed in Office & Administration in Ellicott City is 5.7%.
What is the Percentage of Population Employed in Office & Administration in Maryland?
Percentage of Population Employed in Office & Administration in Maryland is 10.4%.
What is the Percentage of Population Employed in Office & Administration in the United States?
Percentage of Population Employed in Office & Administration in the United States is 10.9%.