Zip Codes with the Highest Percentage of Renter-Occupied Units in Chicopee, MA
RELATED REPORTS & OPTIONS
Highest Renter-Occupied
Chicopee
Compare Zip Codes
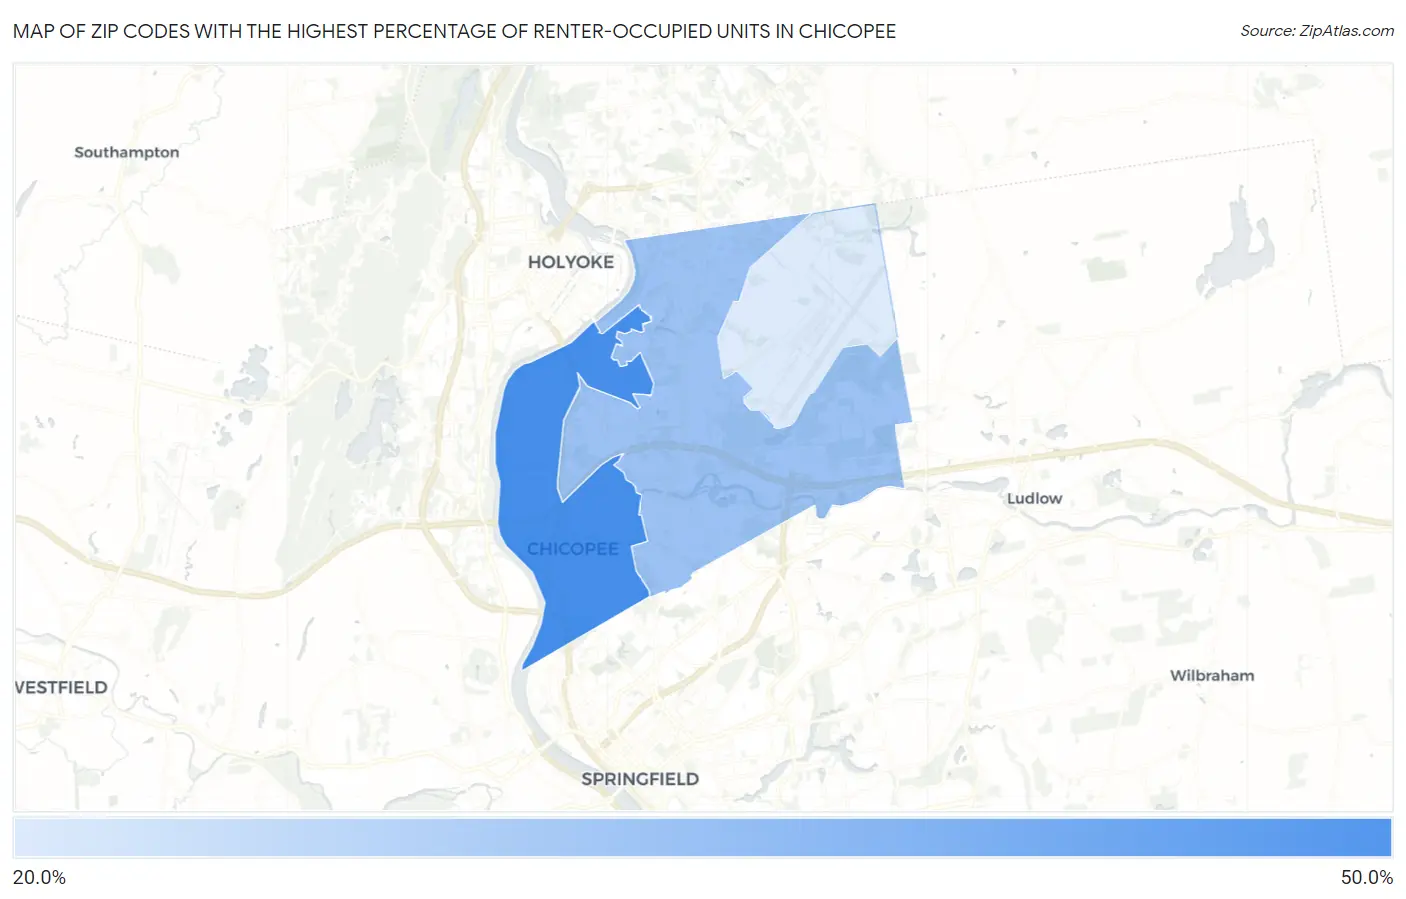
Map of Zip Codes with the Highest Percentage of Renter-Occupied Units in Chicopee
0.0%
50.0%
Zip Codes with the Highest Percentage of Renter-Occupied Units in Chicopee, MA
| Zip Code | % Renter-Occupied | vs State | vs National | |
| 1. | 01013 | 48.6% | 37.6%(+11.0)#93 | 35.2%(+13.4)#3,346 |
| 2. | 01020 | 36.7% | 37.6%(-0.866)#137 | 35.2%(+1.52)#6,623 |
| 3. | 01022 | 28.4% | 37.6%(-9.15)#187 | 35.2%(-6.77)#11,105 |
1
Common Questions
What are the Top Zip Codes with the Highest Percentage of Renter-Occupied Units in Chicopee, MA?
Top Zip Codes with the Highest Percentage of Renter-Occupied Units in Chicopee, MA are:
What zip code has the Highest Percentage of Renter-Occupied Units in Chicopee, MA?
01013 has the Highest Percentage of Renter-Occupied Units in Chicopee, MA with 48.6%.
What is the Percentage of Renter-Occupied Units in Chicopee, MA?
Percentage of Renter-Occupied Units in Chicopee is 41.0%.
What is the Percentage of Renter-Occupied Units in Massachusetts?
Percentage of Renter-Occupied Units in Massachusetts is 37.6%.
What is the Percentage of Renter-Occupied Units in the United States?
Percentage of Renter-Occupied Units in the United States is 35.2%.