Zip Codes with the Highest Percentage of Population Employed in Arts, Entertainment & Recreation in Bowling Green, KY
RELATED REPORTS & OPTIONS
Arts, Entertainment & Recreation
Bowling Green
Compare Zip Codes
Map of Zip Codes with the Highest Percentage of Population Employed in Arts, Entertainment & Recreation in Bowling Green
0.0%
2.5%
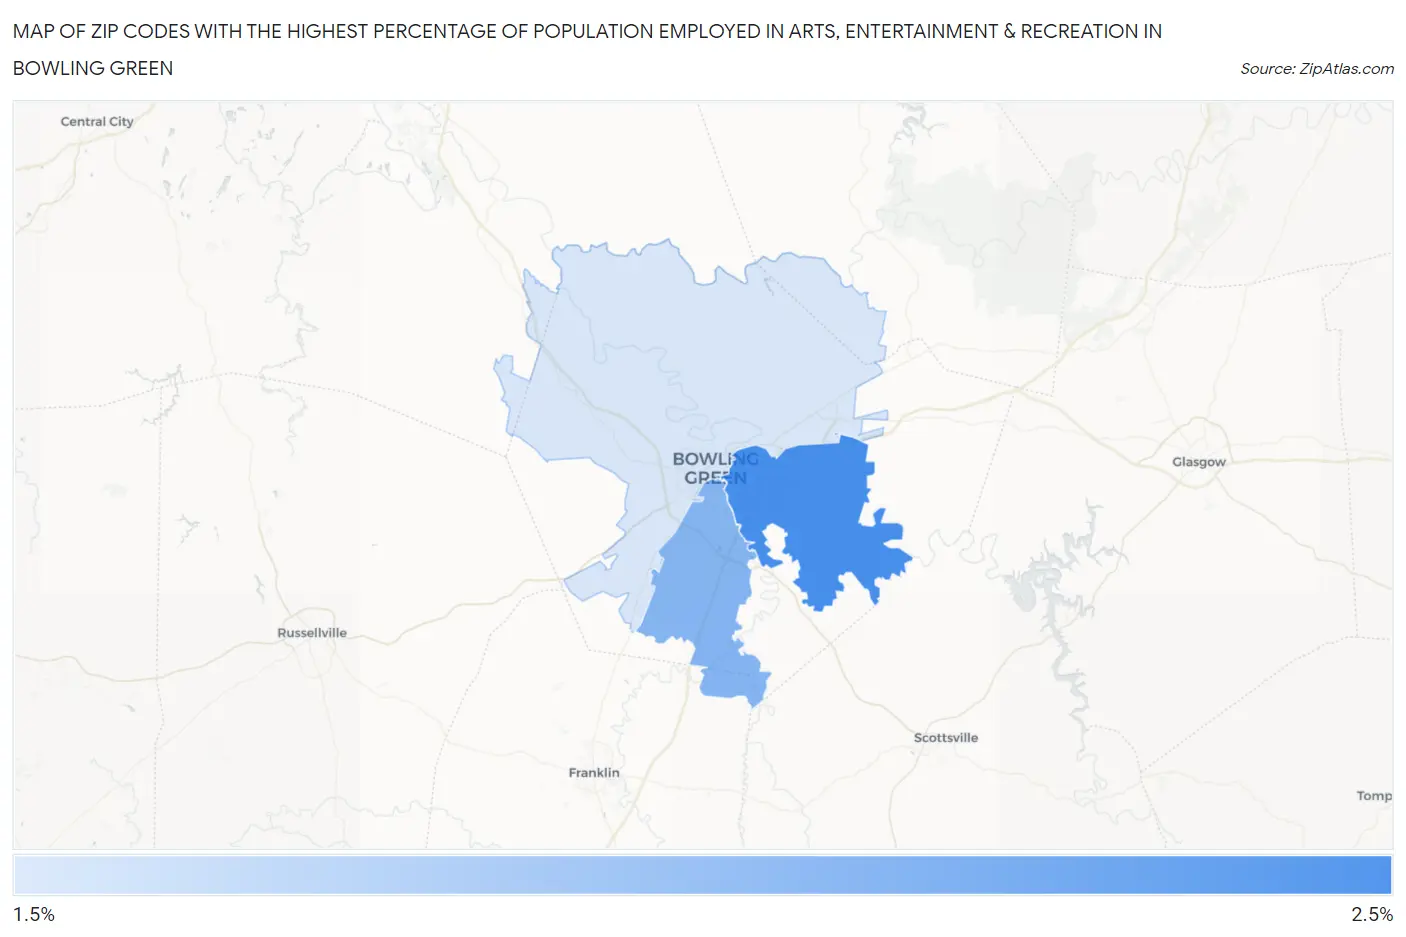
Zip Codes with the Highest Percentage of Population Employed in Arts, Entertainment & Recreation in Bowling Green, KY
| Zip Code | % Employed | vs State | vs National | |
| 1. | 42103 | 2.3% | 1.4%(+0.864)#82 | 2.1%(+0.228)#8,080 |
| 2. | 42104 | 2.0% | 1.4%(+0.523)#111 | 2.1%(-0.113)#9,955 |
| 3. | 42101 | 1.5% | 1.4%(+0.087)#149 | 2.1%(-0.549)#13,007 |
1
Common Questions
What are the Top Zip Codes with the Highest Percentage of Population Employed in Arts, Entertainment & Recreation in Bowling Green, KY?
Top Zip Codes with the Highest Percentage of Population Employed in Arts, Entertainment & Recreation in Bowling Green, KY are:
What zip code has the Highest Percentage of Population Employed in Arts, Entertainment & Recreation in Bowling Green, KY?
42103 has the Highest Percentage of Population Employed in Arts, Entertainment & Recreation in Bowling Green, KY with 2.3%.
What is the Percentage of Population Employed in Arts, Entertainment & Recreation in Bowling Green, KY?
Percentage of Population Employed in Arts, Entertainment & Recreation in Bowling Green is 2.0%.
What is the Percentage of Population Employed in Arts, Entertainment & Recreation in Kentucky?
Percentage of Population Employed in Arts, Entertainment & Recreation in Kentucky is 1.4%.
What is the Percentage of Population Employed in Arts, Entertainment & Recreation in the United States?
Percentage of Population Employed in Arts, Entertainment & Recreation in the United States is 2.1%.