Nortonville, KS Map & Demographics
Nortonville Map
Nortonville Overview
$26,197
PER CAPITA INCOME
$75,455
AVG FAMILY INCOME
$66,786
AVG HOUSEHOLD INCOME
19.6%
WAGE / INCOME GAP [ % ]
80.4¢/ $1
WAGE / INCOME GAP [ $ ]
0.35
INEQUALITY / GINI INDEX
794
TOTAL POPULATION
412
MALE POPULATION
382
FEMALE POPULATION
107.85
MALES / 100 FEMALES
92.72
FEMALES / 100 MALES
35.9
MEDIAN AGE
3.1
AVG FAMILY SIZE
2.7
AVG HOUSEHOLD SIZE
343
LABOR FORCE [ PEOPLE ]
61.7%
PERCENT IN LABOR FORCE
0.9%
UNEMPLOYMENT RATE
Nortonville Zip Codes
Nortonville Area Codes
Income in Nortonville
Income Overview in Nortonville
Per Capita Income in Nortonville is $26,197, while median incomes of families and households are $75,455 and $66,786 respectively.
| Characteristic | Number | Measure |
| Per Capita Income | 794 | $26,197 |
| Median Family Income | 212 | $75,455 |
| Mean Family Income | 212 | $77,435 |
| Median Household Income | 280 | $66,786 |
| Mean Household Income | 280 | $73,541 |
| Income Deficit | 212 | $0 |
| Wage / Income Gap (%) | 794 | 19.55% |
| Wage / Income Gap ($) | 794 | 80.45¢ per $1 |
| Gini / Inequality Index | 794 | 0.35 |
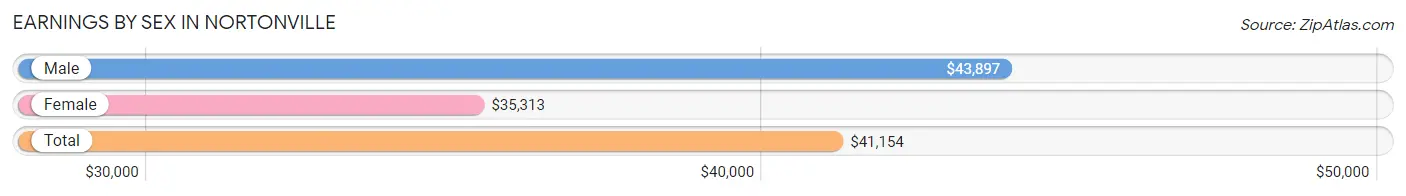
Earnings by Sex in Nortonville
Average Earnings in Nortonville are $41,154, $43,897 for men and $35,313 for women, a difference of 19.6%.
| Sex | Number | Average Earnings |
| Male | 223 (62.6%) | $43,897 |
| Female | 133 (37.4%) | $35,313 |
| Total | 356 (100.0%) | $41,154 |
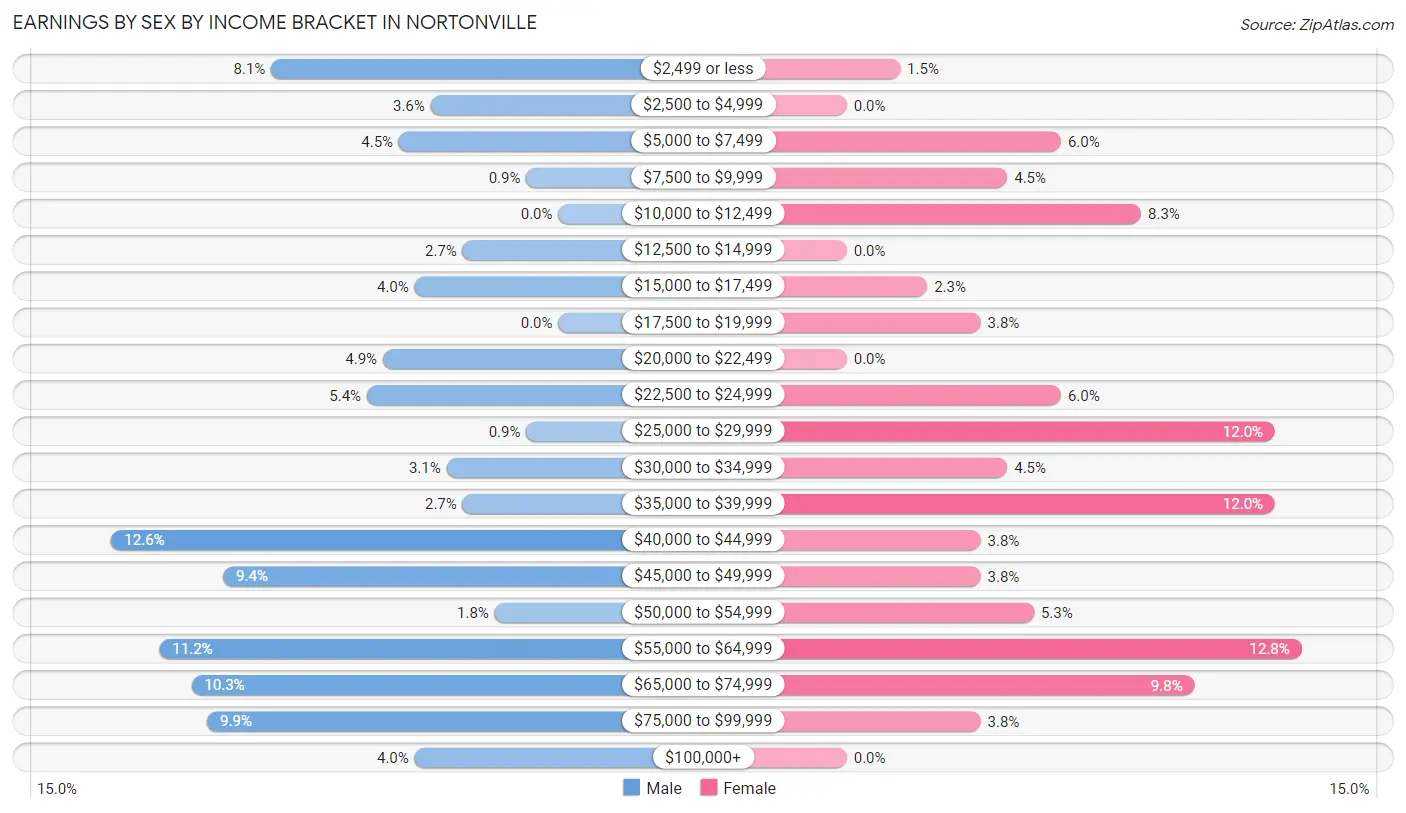
Earnings by Sex by Income Bracket in Nortonville
The most common earnings brackets in Nortonville are $40,000 to $44,999 for men (28 | 12.6%) and $55,000 to $64,999 for women (17 | 12.8%).
| Income | Male | Female |
| $2,499 or less | 18 (8.1%) | 2 (1.5%) |
| $2,500 to $4,999 | 8 (3.6%) | 0 (0.0%) |
| $5,000 to $7,499 | 10 (4.5%) | 8 (6.0%) |
| $7,500 to $9,999 | 2 (0.9%) | 6 (4.5%) |
| $10,000 to $12,499 | 0 (0.0%) | 11 (8.3%) |
| $12,500 to $14,999 | 6 (2.7%) | 0 (0.0%) |
| $15,000 to $17,499 | 9 (4.0%) | 3 (2.3%) |
| $17,500 to $19,999 | 0 (0.0%) | 5 (3.8%) |
| $20,000 to $22,499 | 11 (4.9%) | 0 (0.0%) |
| $22,500 to $24,999 | 12 (5.4%) | 8 (6.0%) |
| $25,000 to $29,999 | 2 (0.9%) | 16 (12.0%) |
| $30,000 to $34,999 | 7 (3.1%) | 6 (4.5%) |
| $35,000 to $39,999 | 6 (2.7%) | 16 (12.0%) |
| $40,000 to $44,999 | 28 (12.6%) | 5 (3.8%) |
| $45,000 to $49,999 | 21 (9.4%) | 5 (3.8%) |
| $50,000 to $54,999 | 4 (1.8%) | 7 (5.3%) |
| $55,000 to $64,999 | 25 (11.2%) | 17 (12.8%) |
| $65,000 to $74,999 | 23 (10.3%) | 13 (9.8%) |
| $75,000 to $99,999 | 22 (9.9%) | 5 (3.8%) |
| $100,000+ | 9 (4.0%) | 0 (0.0%) |
| Total | 223 (100.0%) | 133 (100.0%) |
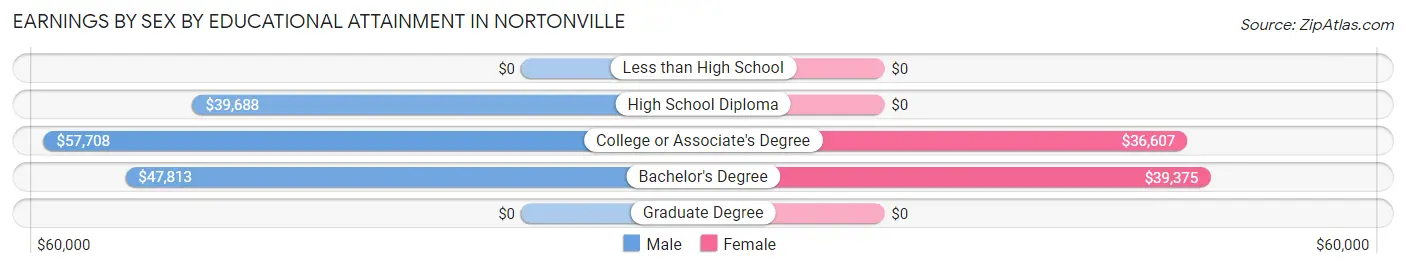
Earnings by Sex by Educational Attainment in Nortonville
Average earnings in Nortonville are $48,125 for men and $36,458 for women, a difference of 24.2%. Men with an educational attainment of college or associate's degree enjoy the highest average annual earnings of $57,708, while those with high school diploma education earn the least with $39,688. Women with an educational attainment of bachelor's degree earn the most with the average annual earnings of $39,375, while those with college or associate's degree education have the smallest earnings of $36,607.
| Educational Attainment | Male Income | Female Income |
| Less than High School | - | - |
| High School Diploma | $39,688 | $0 |
| College or Associate's Degree | $57,708 | $36,607 |
| Bachelor's Degree | $47,813 | $39,375 |
| Graduate Degree | - | - |
| Total | $48,125 | $36,458 |
Family Income in Nortonville
Family Income Brackets in Nortonville
According to the Nortonville family income data, there are 64 families falling into the $100,000 to $149,999 income range, which is the most common income bracket and makes up 30.2% of all families.
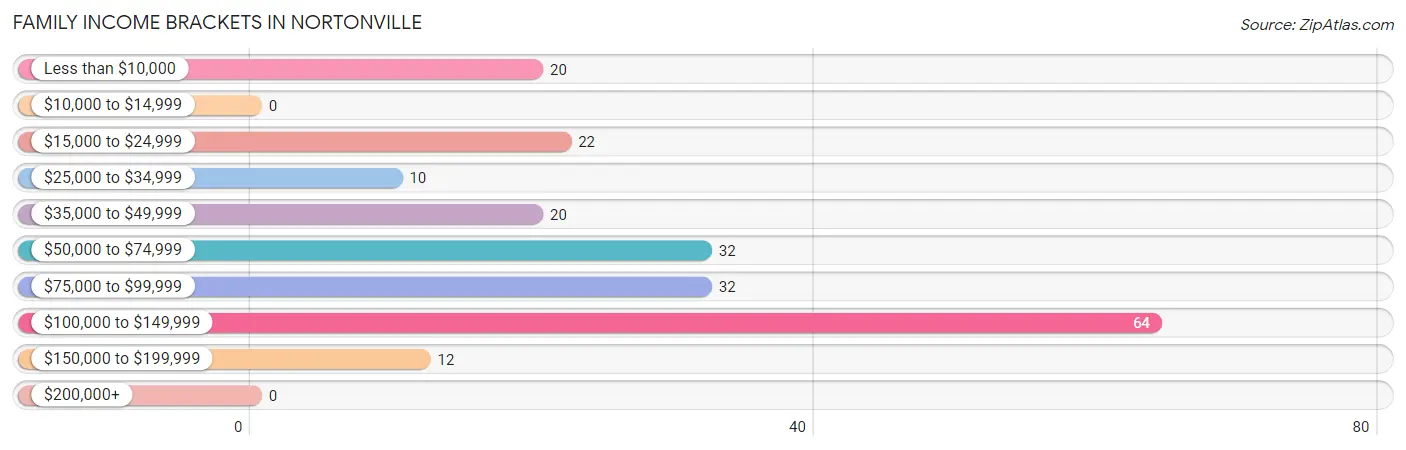
| Income Bracket | # Families | % Families |
| Less than $10,000 | 20 | 9.4% |
| $10,000 to $14,999 | 0 | 0.0% |
| $15,000 to $24,999 | 22 | 10.4% |
| $25,000 to $34,999 | 10 | 4.7% |
| $35,000 to $49,999 | 20 | 9.4% |
| $50,000 to $74,999 | 32 | 15.1% |
| $75,000 to $99,999 | 32 | 15.1% |
| $100,000 to $149,999 | 64 | 30.2% |
| $150,000 to $199,999 | 12 | 5.7% |
| $200,000+ | 0 | 0.0% |
Family Income by Famaliy Size in Nortonville
3-person families (50 | 23.6%) account for the highest median family income in Nortonville with $105,833 per family, while 3-person families (50 | 23.6%) have the highest median income of $35,278 per family member.
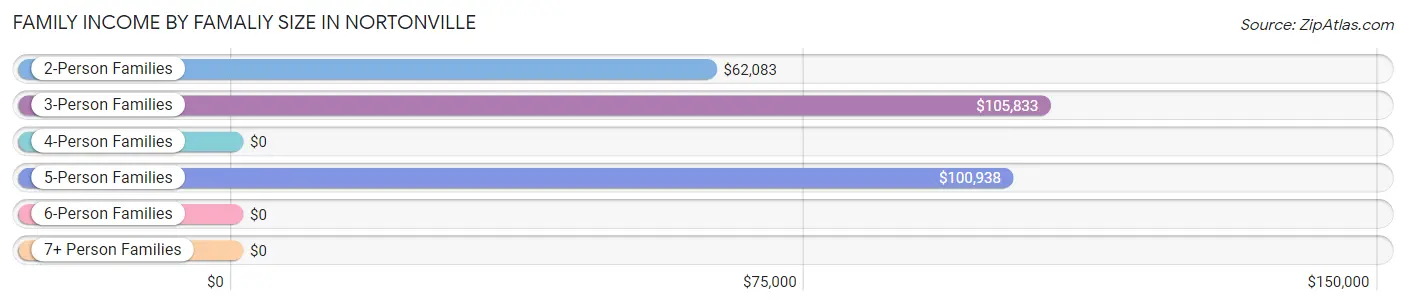
| Income Bracket | # Families | Median Income |
| 2-Person Families | 91 (42.9%) | $62,083 |
| 3-Person Families | 50 (23.6%) | $105,833 |
| 4-Person Families | 42 (19.8%) | $0 |
| 5-Person Families | 25 (11.8%) | $100,938 |
| 6-Person Families | 4 (1.9%) | $0 |
| 7+ Person Families | 0 (0.0%) | $0 |
| Total | 212 (100.0%) | $75,455 |
Family Income by Number of Earners in Nortonville
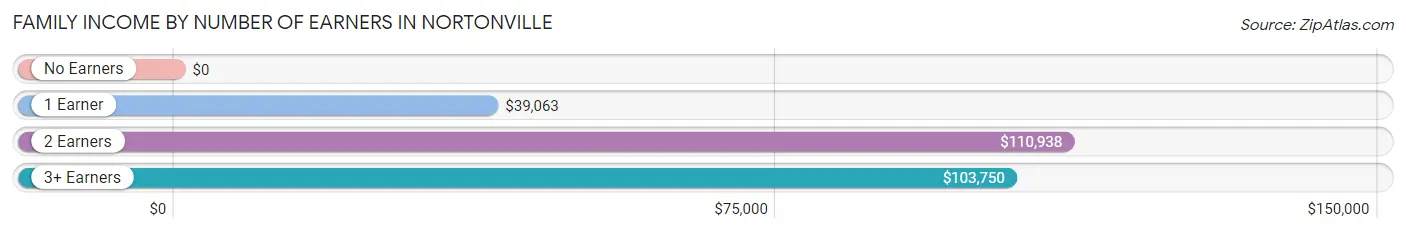
| Number of Earners | # Families | Median Income |
| No Earners | 44 (20.7%) | $0 |
| 1 Earner | 71 (33.5%) | $39,063 |
| 2 Earners | 81 (38.2%) | $110,938 |
| 3+ Earners | 16 (7.5%) | $103,750 |
| Total | 212 (100.0%) | $75,455 |
Household Income in Nortonville
Household Income Brackets in Nortonville
With 83 households falling in the category, the $100,000 to $149,999 income range is the most frequent in Nortonville, accounting for 29.6% of all households.
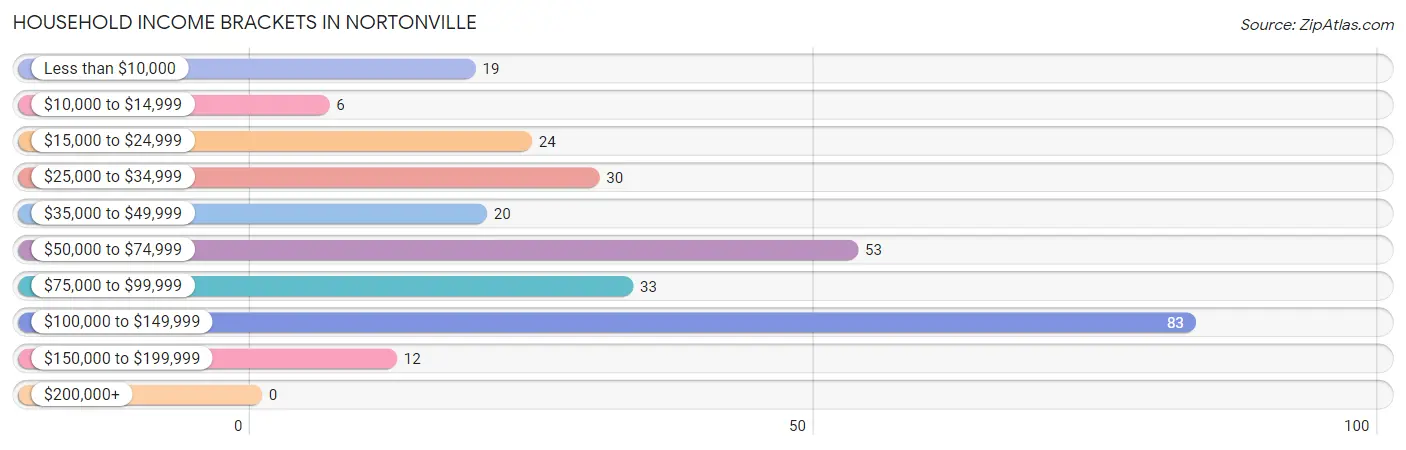
| Income Bracket | # Households | % Households |
| Less than $10,000 | 19 | 6.8% |
| $10,000 to $14,999 | 6 | 2.1% |
| $15,000 to $24,999 | 24 | 8.6% |
| $25,000 to $34,999 | 30 | 10.7% |
| $35,000 to $49,999 | 20 | 7.1% |
| $50,000 to $74,999 | 53 | 18.9% |
| $75,000 to $99,999 | 33 | 11.8% |
| $100,000 to $149,999 | 83 | 29.6% |
| $150,000 to $199,999 | 12 | 4.3% |
| $200,000+ | 0 | 0.0% |
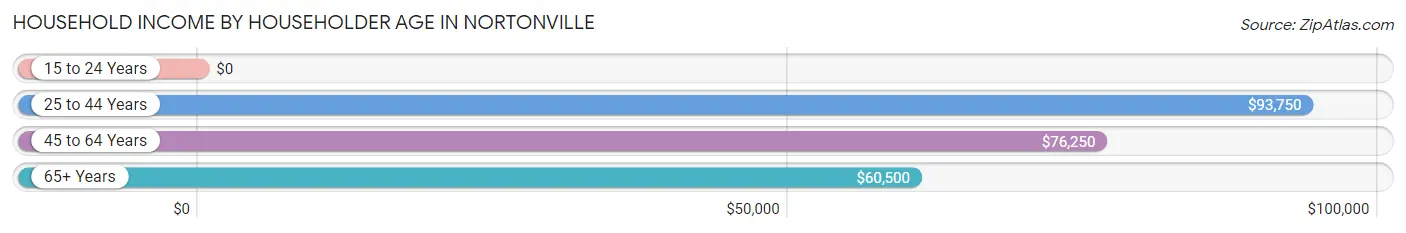
Household Income by Householder Age in Nortonville
The median household income in Nortonville is $66,786, with the highest median household income of $93,750 found in the 25 to 44 years age bracket for the primary householder. A total of 92 households (32.9%) fall into this category. Meanwhile, the 15 to 24 years age bracket for the primary householder has the lowest median household income of $0, with 25 households (8.9%) in this group.
| Income Bracket | # Households | Median Income |
| 15 to 24 Years | 25 (8.9%) | $0 |
| 25 to 44 Years | 92 (32.9%) | $93,750 |
| 45 to 64 Years | 81 (28.9%) | $76,250 |
| 65+ Years | 82 (29.3%) | $60,500 |
| Total | 280 (100.0%) | $66,786 |
Poverty in Nortonville
Income Below Poverty by Sex and Age in Nortonville
With 11.8% poverty level for males and 20.0% for females among the residents of Nortonville, 18 to 24 year old males and 5 year old females are the most vulnerable to poverty, with 15 males (62.5%) and 12 females (70.6%) in their respective age groups living below the poverty level.
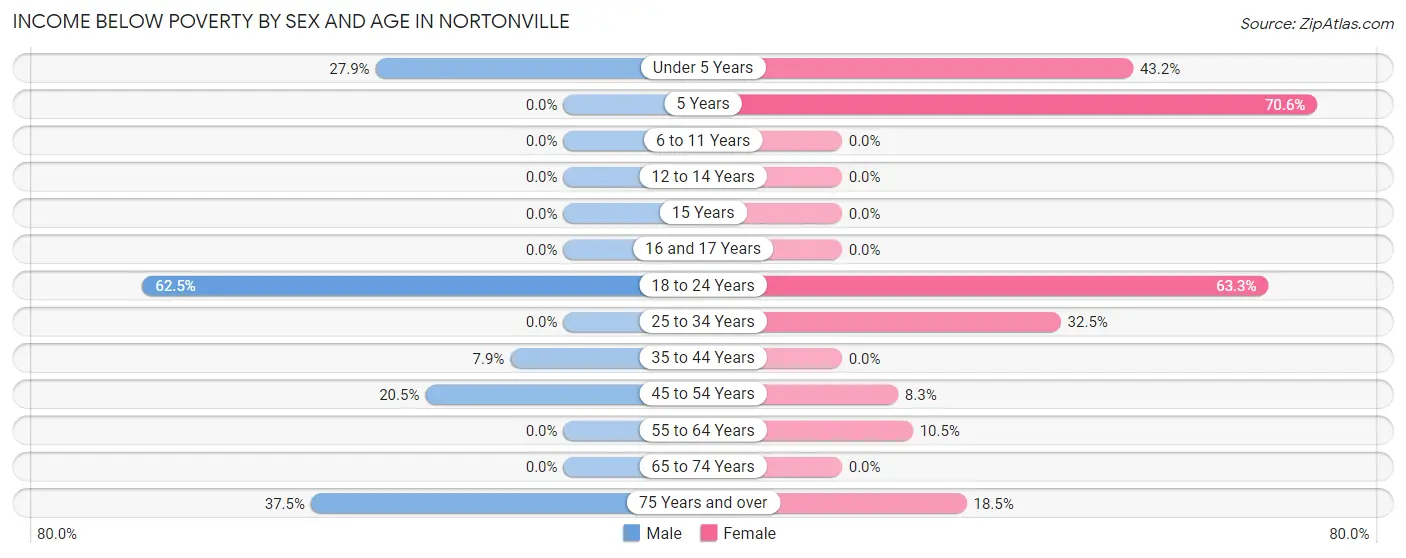
| Age Bracket | Male | Female |
| Under 5 Years | 12 (27.9%) | 16 (43.2%) |
| 5 Years | 0 (0.0%) | 12 (70.6%) |
| 6 to 11 Years | 0 (0.0%) | 0 (0.0%) |
| 12 to 14 Years | 0 (0.0%) | 0 (0.0%) |
| 15 Years | 0 (0.0%) | 0 (0.0%) |
| 16 and 17 Years | 0 (0.0%) | 0 (0.0%) |
| 18 to 24 Years | 15 (62.5%) | 19 (63.3%) |
| 25 to 34 Years | 0 (0.0%) | 13 (32.5%) |
| 35 to 44 Years | 6 (7.9%) | 0 (0.0%) |
| 45 to 54 Years | 8 (20.5%) | 3 (8.3%) |
| 55 to 64 Years | 0 (0.0%) | 4 (10.5%) |
| 65 to 74 Years | 0 (0.0%) | 0 (0.0%) |
| 75 Years and over | 6 (37.5%) | 5 (18.5%) |
| Total | 47 (11.8%) | 72 (20.0%) |
Income Above Poverty by Sex and Age in Nortonville
According to the poverty statistics in Nortonville, males aged 6 to 11 years and females aged 6 to 11 years are the age groups that are most secure financially, with 100.0% of males and 100.0% of females in these age groups living above the poverty line.
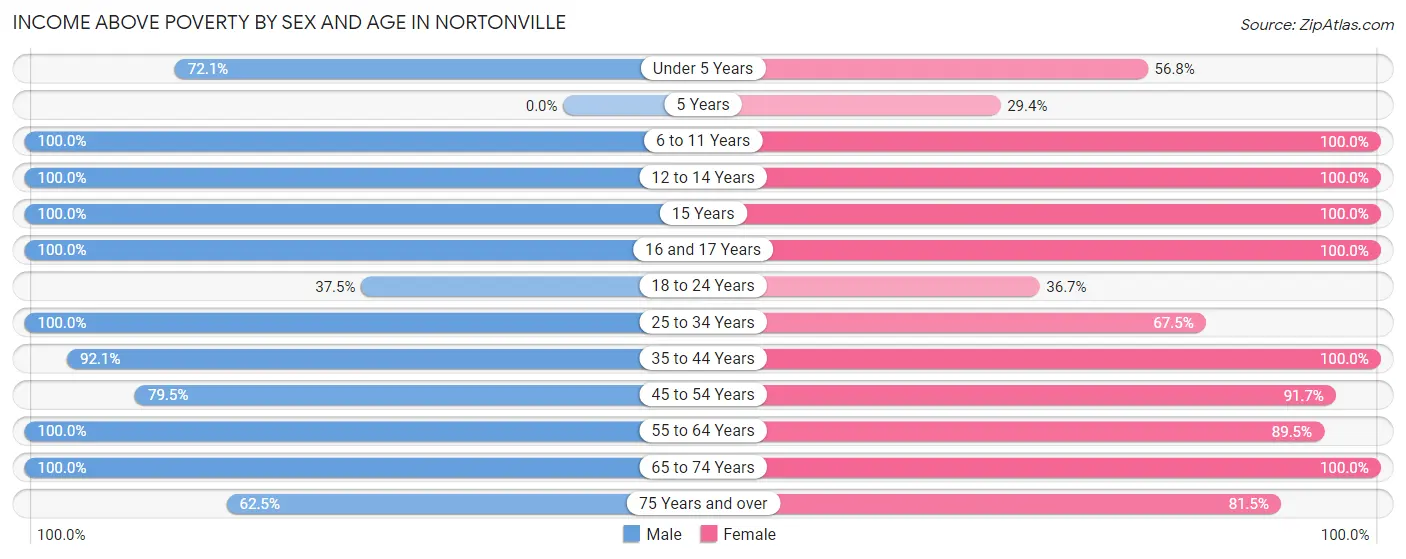
| Age Bracket | Male | Female |
| Under 5 Years | 31 (72.1%) | 21 (56.8%) |
| 5 Years | 0 (0.0%) | 5 (29.4%) |
| 6 to 11 Years | 34 (100.0%) | 50 (100.0%) |
| 12 to 14 Years | 20 (100.0%) | 12 (100.0%) |
| 15 Years | 10 (100.0%) | 8 (100.0%) |
| 16 and 17 Years | 15 (100.0%) | 5 (100.0%) |
| 18 to 24 Years | 9 (37.5%) | 11 (36.7%) |
| 25 to 34 Years | 35 (100.0%) | 27 (67.5%) |
| 35 to 44 Years | 70 (92.1%) | 42 (100.0%) |
| 45 to 54 Years | 31 (79.5%) | 33 (91.7%) |
| 55 to 64 Years | 29 (100.0%) | 34 (89.5%) |
| 65 to 74 Years | 58 (100.0%) | 18 (100.0%) |
| 75 Years and over | 10 (62.5%) | 22 (81.5%) |
| Total | 352 (88.2%) | 288 (80.0%) |
Income Below Poverty Among Married-Couple Families in Nortonville
The poverty statistics for married-couple families in Nortonville show that 13.1% or 23 of the total 175 families live below the poverty line. Families with 1 or 2 children have the highest poverty rate of 35.2%, comprising of 19 families. On the other hand, families with 3 or 4 children have the lowest poverty rate of 0.0%, which includes 0 families.
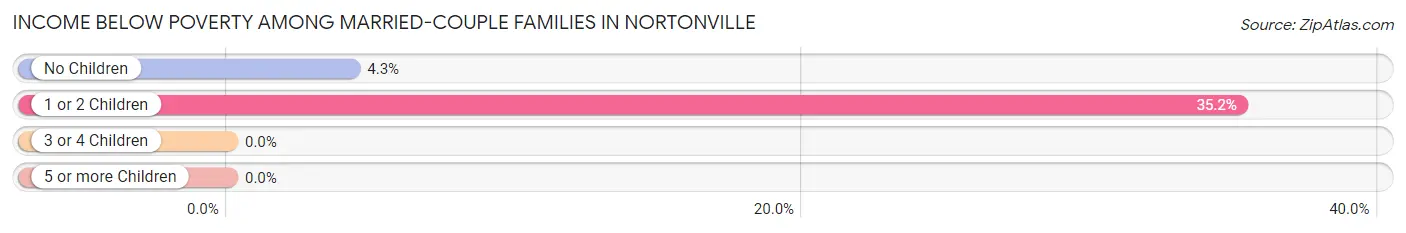
| Children | Above Poverty | Below Poverty |
| No Children | 90 (95.7%) | 4 (4.3%) |
| 1 or 2 Children | 35 (64.8%) | 19 (35.2%) |
| 3 or 4 Children | 27 (100.0%) | 0 (0.0%) |
| 5 or more Children | 0 (0.0%) | 0 (0.0%) |
| Total | 152 (86.9%) | 23 (13.1%) |
Income Below Poverty Among Single-Parent Households in Nortonville
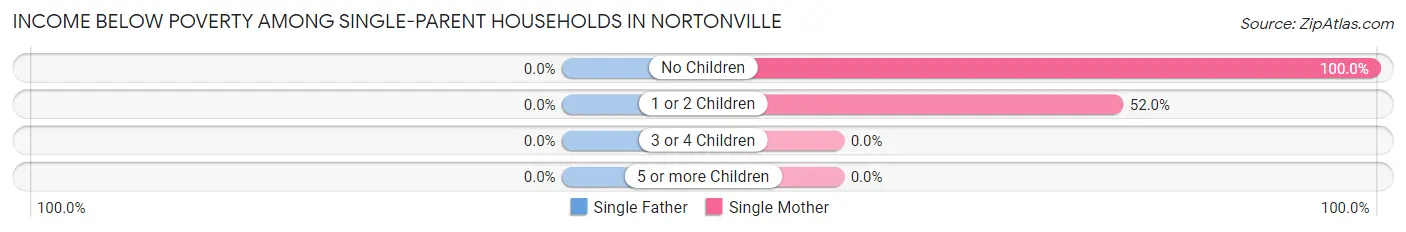
| Children | Single Father | Single Mother |
| No Children | 0 (0.0%) | 3 (100.0%) |
| 1 or 2 Children | 0 (0.0%) | 13 (52.0%) |
| 3 or 4 Children | 0 (0.0%) | 0 (0.0%) |
| 5 or more Children | 0 (0.0%) | 0 (0.0%) |
| Total | 0 (0.0%) | 16 (50.0%) |
Income Below Poverty Among Married-Couple vs Single-Parent Households in Nortonville
The poverty data for Nortonville shows that 23 of the married-couple family households (13.1%) and 16 of the single-parent households (43.2%) are living below the poverty level. Within the married-couple family households, those with 1 or 2 children have the highest poverty rate, with 19 households (35.2%) falling below the poverty line. Among the single-parent households, those with no children have the highest poverty rate, with 3 household (50.0%) living below poverty.
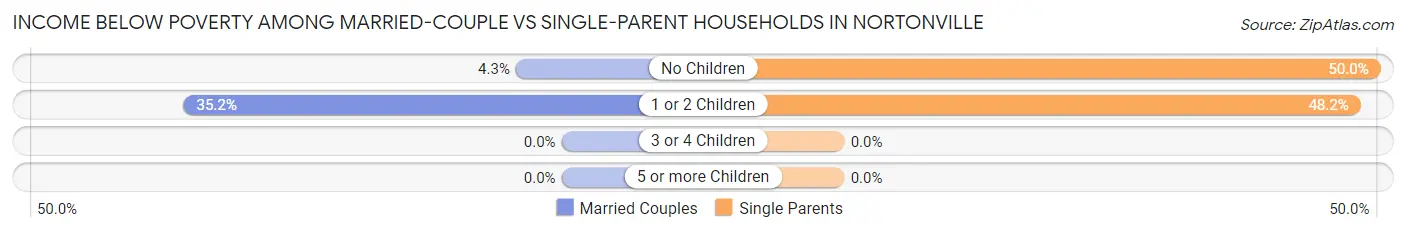
| Children | Married-Couple Families | Single-Parent Households |
| No Children | 4 (4.3%) | 3 (50.0%) |
| 1 or 2 Children | 19 (35.2%) | 13 (48.1%) |
| 3 or 4 Children | 0 (0.0%) | 0 (0.0%) |
| 5 or more Children | 0 (0.0%) | 0 (0.0%) |
| Total | 23 (13.1%) | 16 (43.2%) |
Race in Nortonville
The most populous races in Nortonville are White / Caucasian (761 | 95.8%), Two or more Races (31 | 3.9%), and Native / Alaskan (2 | 0.3%).
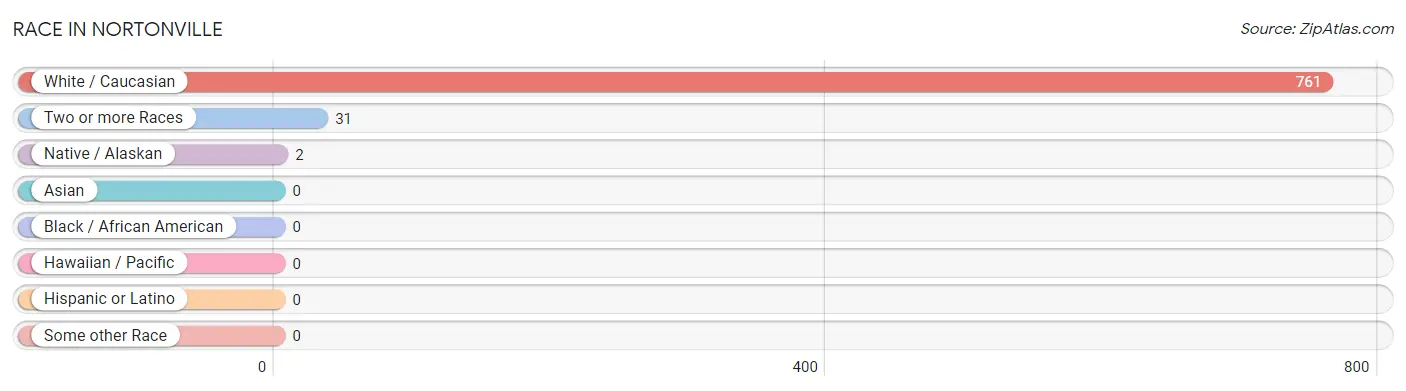
| Race | # Population | % Population |
| Asian | 0 | 0.0% |
| Black / African American | 0 | 0.0% |
| Hawaiian / Pacific | 0 | 0.0% |
| Hispanic or Latino | 0 | 0.0% |
| Native / Alaskan | 2 | 0.3% |
| White / Caucasian | 761 | 95.8% |
| Two or more Races | 31 | 3.9% |
| Some other Race | 0 | 0.0% |
| Total | 794 | 100.0% |
Ancestry in Nortonville
The most populous ancestries reported in Nortonville are German (244 | 30.7%), English (73 | 9.2%), French (67 | 8.4%), American (65 | 8.2%), and Irish (56 | 7.0%), together accounting for 63.6% of all Nortonville residents.
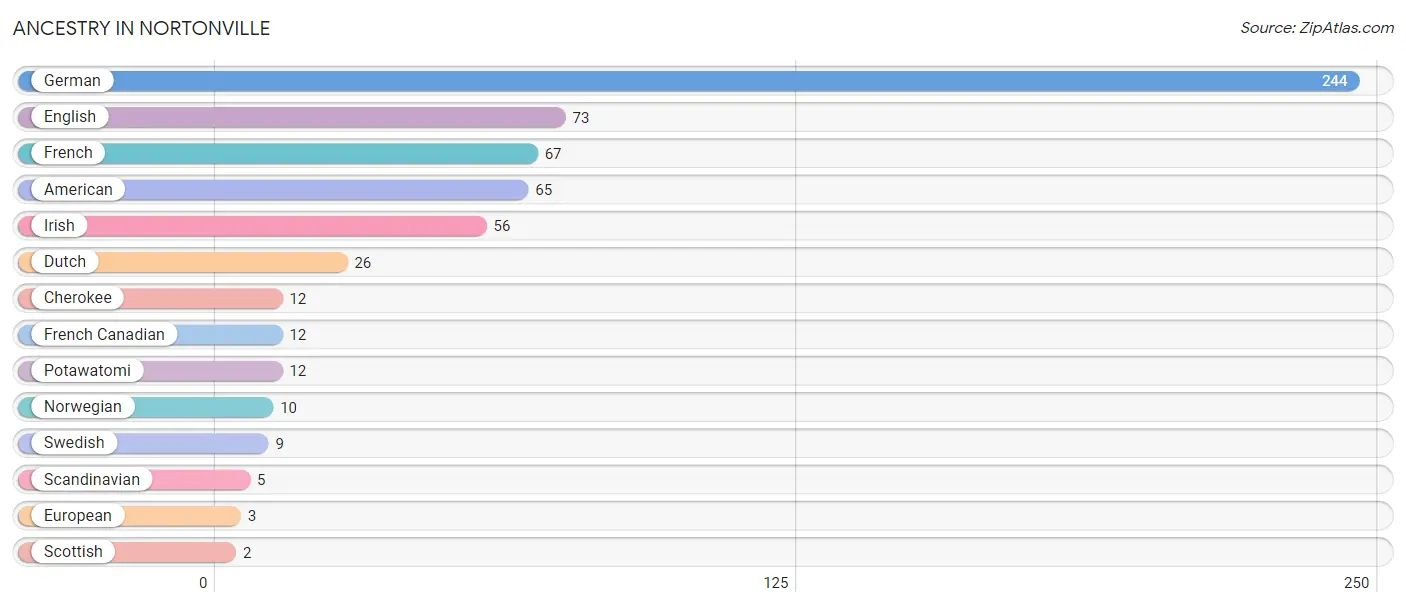
| Ancestry | # Population | % Population |
| American | 65 | 8.2% |
| Cherokee | 12 | 1.5% |
| Dutch | 26 | 3.3% |
| English | 73 | 9.2% |
| European | 3 | 0.4% |
| French | 67 | 8.4% |
| French Canadian | 12 | 1.5% |
| German | 244 | 30.7% |
| Irish | 56 | 7.0% |
| Norwegian | 10 | 1.3% |
| Potawatomi | 12 | 1.5% |
| Scandinavian | 5 | 0.6% |
| Scottish | 2 | 0.3% |
| Swedish | 9 | 1.1% | View All 14 Rows |
Immigrants in Nortonville

| Immigration Origin | # Population | % Population | View All 0 Rows |
Sex and Age in Nortonville
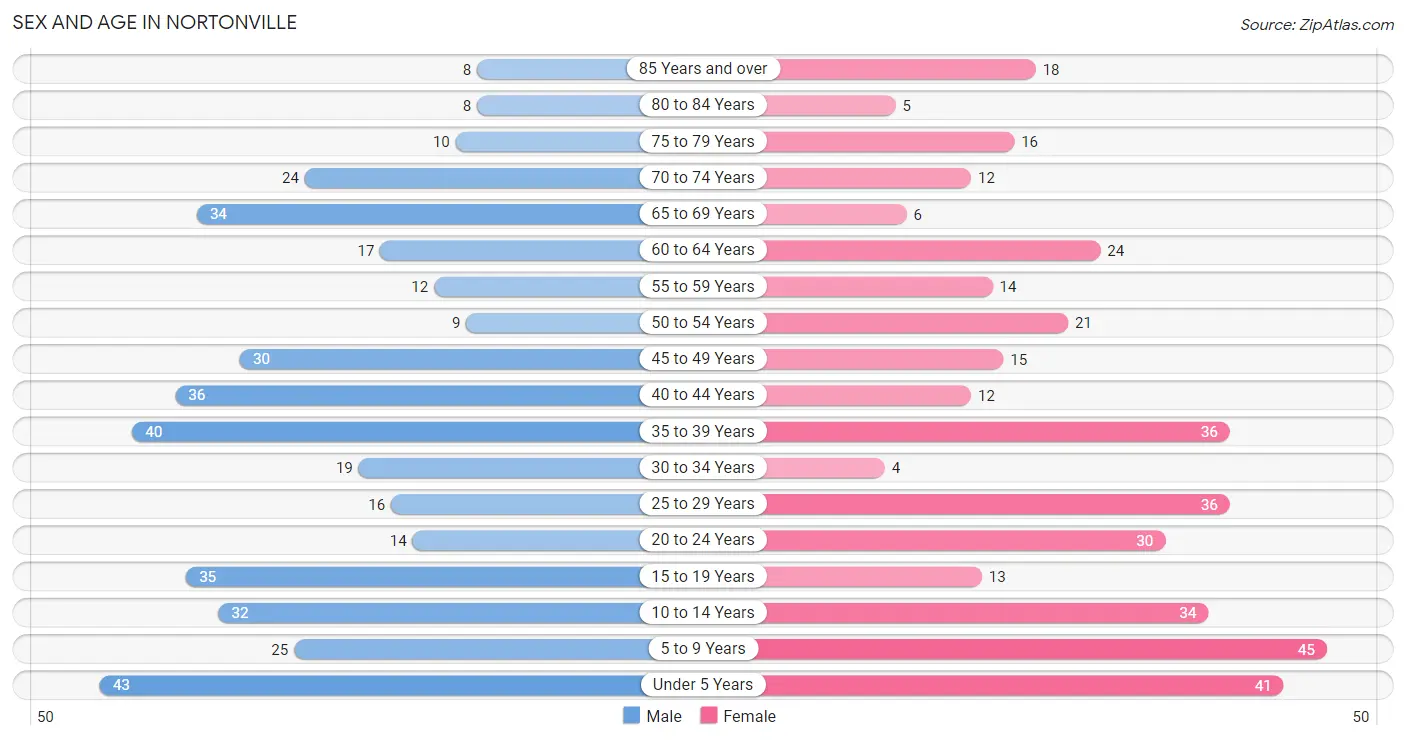
Sex and Age in Nortonville
The most populous age groups in Nortonville are Under 5 Years (43 | 10.4%) for men and 5 to 9 Years (45 | 11.8%) for women.
| Age Bracket | Male | Female |
| Under 5 Years | 43 (10.4%) | 41 (10.7%) |
| 5 to 9 Years | 25 (6.1%) | 45 (11.8%) |
| 10 to 14 Years | 32 (7.8%) | 34 (8.9%) |
| 15 to 19 Years | 35 (8.5%) | 13 (3.4%) |
| 20 to 24 Years | 14 (3.4%) | 30 (7.9%) |
| 25 to 29 Years | 16 (3.9%) | 36 (9.4%) |
| 30 to 34 Years | 19 (4.6%) | 4 (1.1%) |
| 35 to 39 Years | 40 (9.7%) | 36 (9.4%) |
| 40 to 44 Years | 36 (8.7%) | 12 (3.1%) |
| 45 to 49 Years | 30 (7.3%) | 15 (3.9%) |
| 50 to 54 Years | 9 (2.2%) | 21 (5.5%) |
| 55 to 59 Years | 12 (2.9%) | 14 (3.7%) |
| 60 to 64 Years | 17 (4.1%) | 24 (6.3%) |
| 65 to 69 Years | 34 (8.3%) | 6 (1.6%) |
| 70 to 74 Years | 24 (5.8%) | 12 (3.1%) |
| 75 to 79 Years | 10 (2.4%) | 16 (4.2%) |
| 80 to 84 Years | 8 (1.9%) | 5 (1.3%) |
| 85 Years and over | 8 (1.9%) | 18 (4.7%) |
| Total | 412 (100.0%) | 382 (100.0%) |
Families and Households in Nortonville
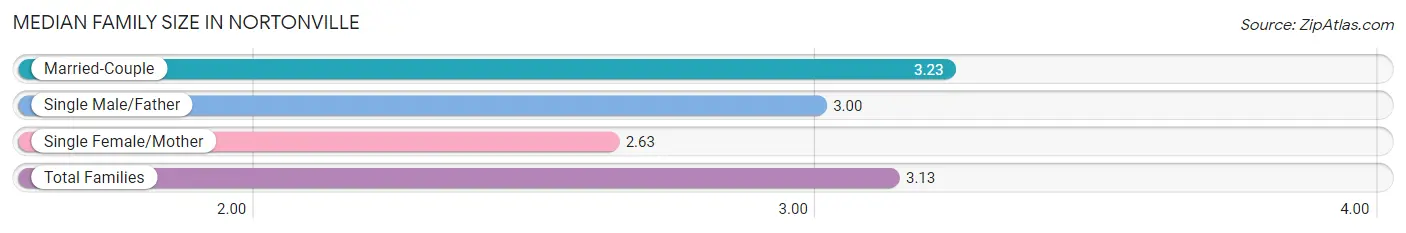
Median Family Size in Nortonville
The median family size in Nortonville is 3.13 persons per family, with married-couple families (175 | 82.6%) accounting for the largest median family size of 3.23 persons per family. On the other hand, single female/mother families (32 | 15.1%) represent the smallest median family size with 2.63 persons per family.
| Family Type | # Families | Family Size |
| Married-Couple | 175 (82.6%) | 3.23 |
| Single Male/Father | 5 (2.4%) | 3.00 |
| Single Female/Mother | 32 (15.1%) | 2.63 |
| Total Families | 212 (100.0%) | 3.13 |
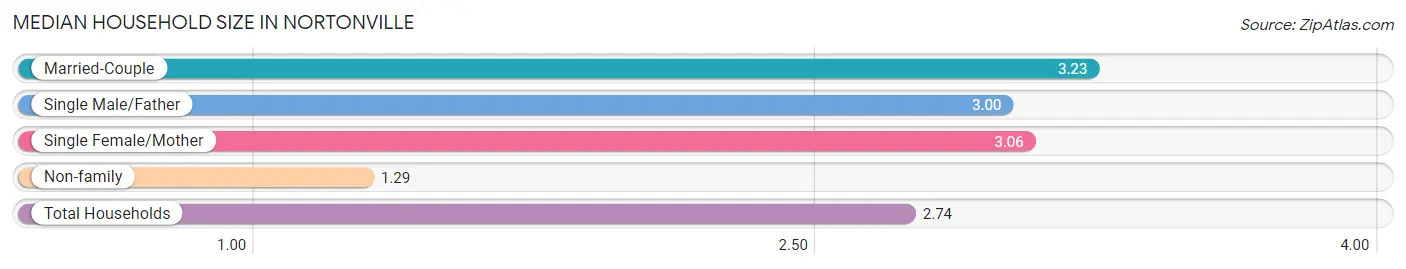
Median Household Size in Nortonville
The median household size in Nortonville is 2.74 persons per household, with married-couple households (175 | 62.5%) accounting for the largest median household size of 3.23 persons per household. non-family households (68 | 24.3%) represent the smallest median household size with 1.29 persons per household.
| Household Type | # Households | Household Size |
| Married-Couple | 175 (62.5%) | 3.23 |
| Single Male/Father | 5 (1.8%) | 3.00 |
| Single Female/Mother | 32 (11.4%) | 3.06 |
| Non-family | 68 (24.3%) | 1.29 |
| Total Households | 280 (100.0%) | 2.74 |
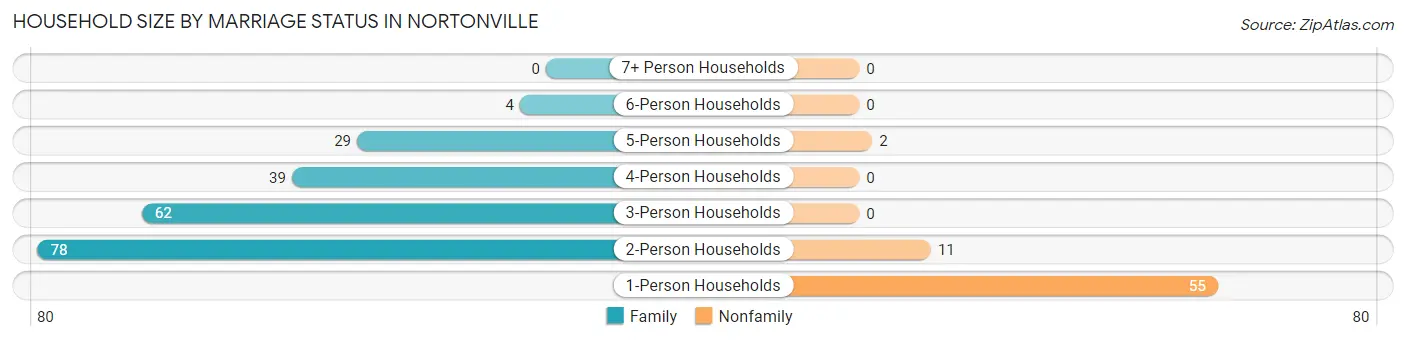
Household Size by Marriage Status in Nortonville
Out of a total of 280 households in Nortonville, 212 (75.7%) are family households, while 68 (24.3%) are nonfamily households. The most numerous type of family households are 2-person households, comprising 78, and the most common type of nonfamily households are 1-person households, comprising 55.
| Household Size | Family Households | Nonfamily Households |
| 1-Person Households | - | 55 (19.6%) |
| 2-Person Households | 78 (27.9%) | 11 (3.9%) |
| 3-Person Households | 62 (22.1%) | 0 (0.0%) |
| 4-Person Households | 39 (13.9%) | 0 (0.0%) |
| 5-Person Households | 29 (10.4%) | 2 (0.7%) |
| 6-Person Households | 4 (1.4%) | 0 (0.0%) |
| 7+ Person Households | 0 (0.0%) | 0 (0.0%) |
| Total | 212 (75.7%) | 68 (24.3%) |
Female Fertility in Nortonville
Fertility by Age in Nortonville
Average fertility rate in Nortonville is 90.0 births per 1,000 women. Women in the age bracket of 20 to 34 years have the highest fertility rate with 200.0 births per 1,000 women. Women in the age bracket of 20 to 34 years acount for 100.0% of all women with births.
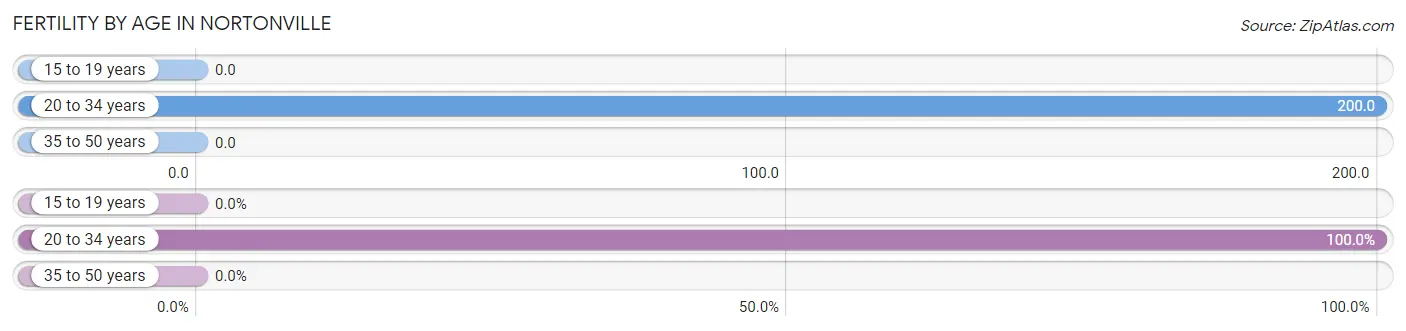
| Age Bracket | Women with Births | Births / 1,000 Women |
| 15 to 19 years | 0 (0.0%) | 0.0 |
| 20 to 34 years | 14 (100.0%) | 200.0 |
| 35 to 50 years | 0 (0.0%) | 0.0 |
| Total | 14 (100.0%) | 90.0 |
Fertility by Age by Marriage Status in Nortonville
57.1% of women with births (14) in Nortonville are married. The highest percentage of unmarried women with births falls into 20 to 34 years age bracket with 42.9% of them unmarried at the time of birth, while the lowest percentage of unmarried women with births belong to 20 to 34 years age bracket with 42.9% of them unmarried.
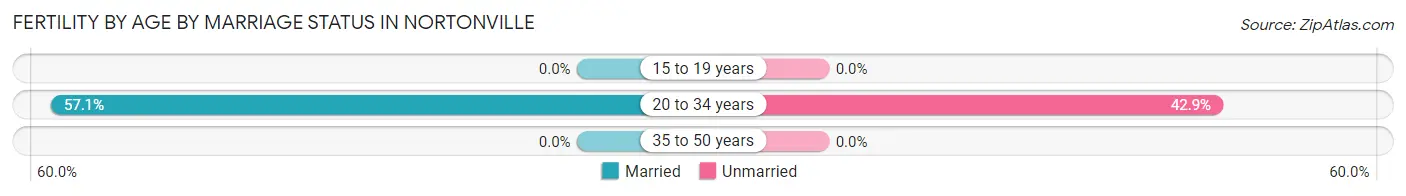
| Age Bracket | Married | Unmarried |
| 15 to 19 years | 0 (0.0%) | 0 (0.0%) |
| 20 to 34 years | 8 (57.1%) | 6 (42.9%) |
| 35 to 50 years | 0 (0.0%) | 0 (0.0%) |
| Total | 8 (57.1%) | 6 (42.9%) |
Fertility by Education in Nortonville
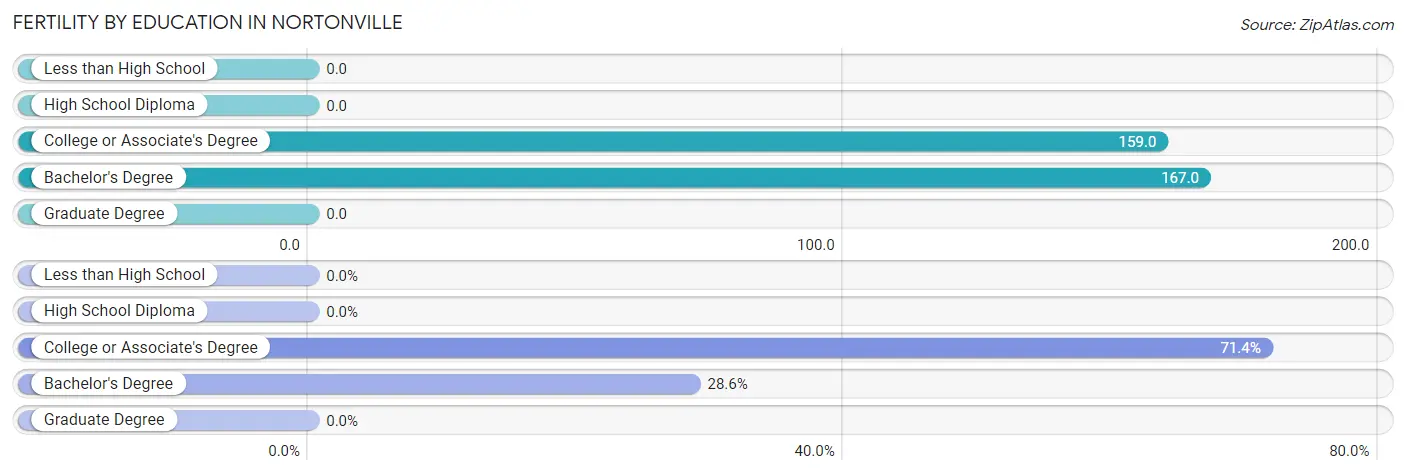
| Educational Attainment | Women with Births | Births / 1,000 Women |
| Less than High School | 0 (0.0%) | 0.0 |
| High School Diploma | 0 (0.0%) | 0.0 |
| College or Associate's Degree | 10 (71.4%) | 159.0 |
| Bachelor's Degree | 4 (28.6%) | 167.0 |
| Graduate Degree | 0 (0.0%) | 0.0 |
| Total | 14 (100.0%) | 90.0 |
Fertility by Education by Marriage Status in Nortonville
42.9% of women with births in Nortonville are unmarried. Women with the educational attainment of bachelor's degree are most likely to be married with 100.0% of them married at childbirth, while women with the educational attainment of college or associate's degree are least likely to be married with 60.0% of them unmarried at childbirth.
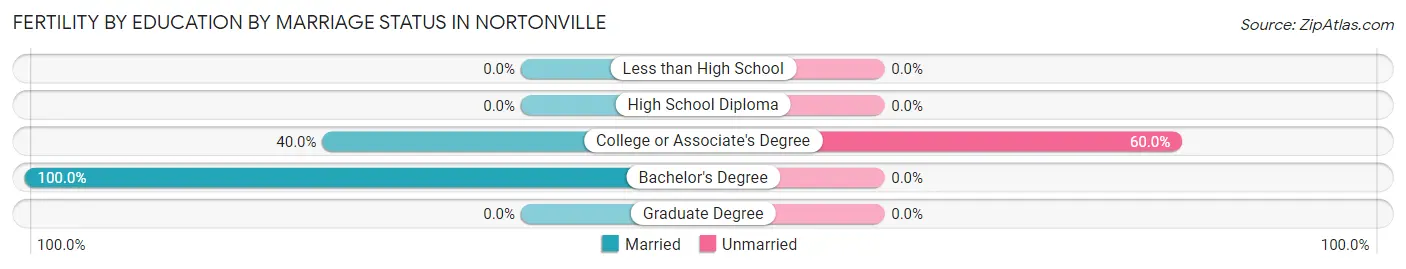
| Educational Attainment | Married | Unmarried |
| Less than High School | 0 (0.0%) | 0 (0.0%) |
| High School Diploma | 0 (0.0%) | 0 (0.0%) |
| College or Associate's Degree | 4 (40.0%) | 6 (60.0%) |
| Bachelor's Degree | 4 (100.0%) | 0 (0.0%) |
| Graduate Degree | 0 (0.0%) | 0 (0.0%) |
| Total | 8 (57.1%) | 6 (42.9%) |
Employment Characteristics in Nortonville
Employment by Class of Employer in Nortonville
Among the 338 employed individuals in Nortonville, private company employees (193 | 57.1%), federal government employees (34 | 10.1%), and local government employees (33 | 9.8%) make up the most common classes of employment.
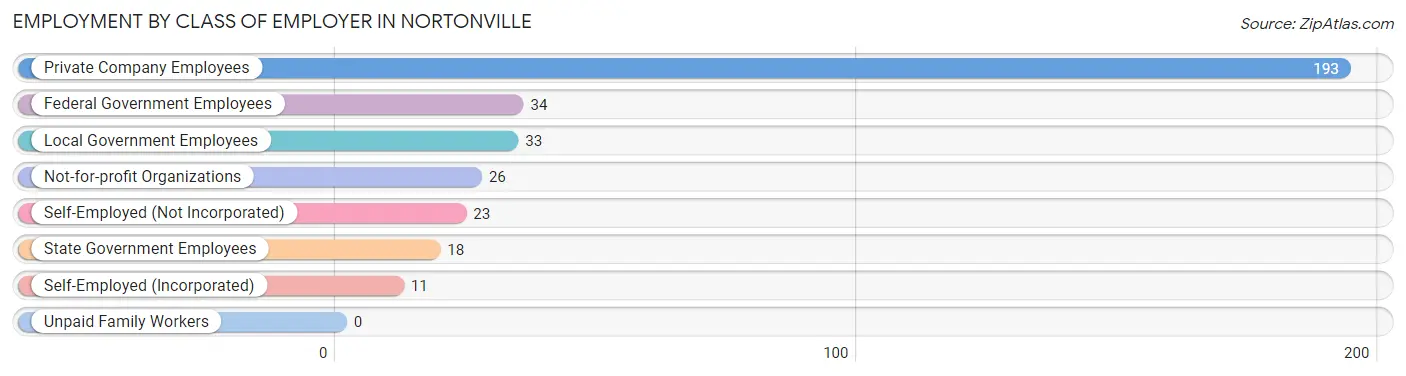
| Employer Class | # Employees | % Employees |
| Private Company Employees | 193 | 57.1% |
| Self-Employed (Incorporated) | 11 | 3.3% |
| Self-Employed (Not Incorporated) | 23 | 6.8% |
| Not-for-profit Organizations | 26 | 7.7% |
| Local Government Employees | 33 | 9.8% |
| State Government Employees | 18 | 5.3% |
| Federal Government Employees | 34 | 10.1% |
| Unpaid Family Workers | 0 | 0.0% |
| Total | 338 | 100.0% |
Employment Status by Age in Nortonville
According to the labor force statistics for Nortonville, out of the total population over 16 years of age (556), 61.7% or 343 individuals are in the labor force, with 0.9% or 3 of them unemployed. The age group with the highest labor force participation rate is 30 to 34 years, with 100.0% or 23 individuals in the labor force. Within the labor force, the 16 to 19 years age range has the highest percentage of unemployed individuals, with 16.7% or 3 of them being unemployed.
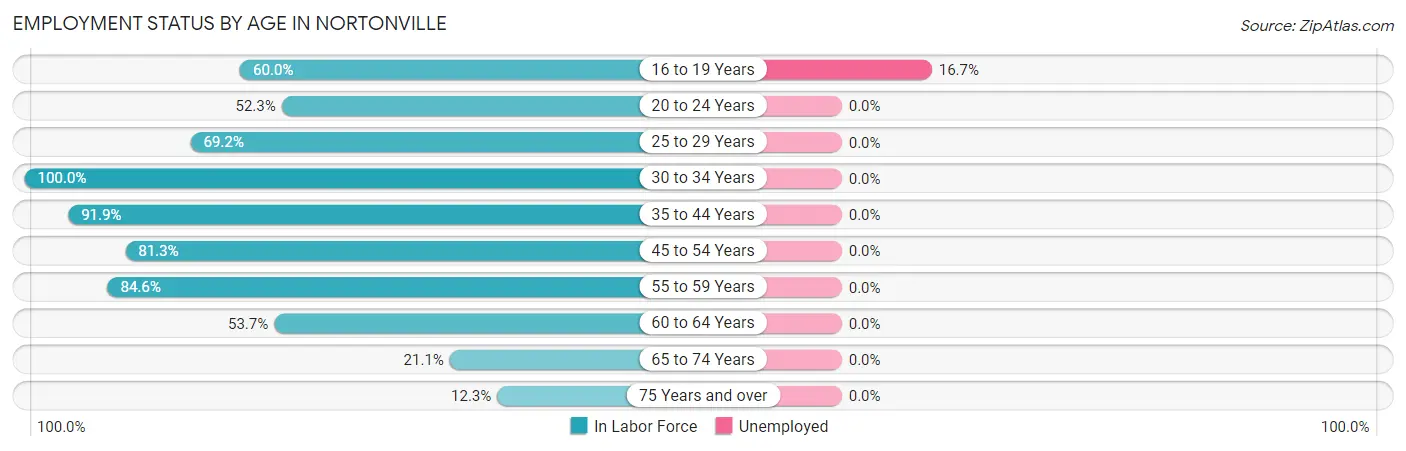
| Age Bracket | In Labor Force | Unemployed |
| 16 to 19 Years | 18 (60.0%) | 3 (16.7%) |
| 20 to 24 Years | 23 (52.3%) | 0 (0.0%) |
| 25 to 29 Years | 36 (69.2%) | 0 (0.0%) |
| 30 to 34 Years | 23 (100.0%) | 0 (0.0%) |
| 35 to 44 Years | 114 (91.9%) | 0 (0.0%) |
| 45 to 54 Years | 61 (81.3%) | 0 (0.0%) |
| 55 to 59 Years | 22 (84.6%) | 0 (0.0%) |
| 60 to 64 Years | 22 (53.7%) | 0 (0.0%) |
| 65 to 74 Years | 16 (21.1%) | 0 (0.0%) |
| 75 Years and over | 8 (12.3%) | 0 (0.0%) |
| Total | 343 (61.7%) | 3 (0.9%) |
Employment Status by Educational Attainment in Nortonville
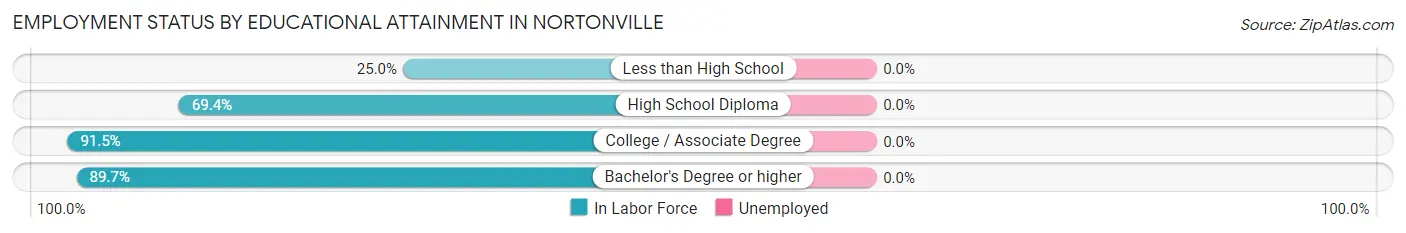
| Educational Attainment | In Labor Force | Unemployed |
| Less than High School | 2 (25.0%) | 0 (0.0%) |
| High School Diploma | 86 (69.4%) | 0 (0.0%) |
| College / Associate Degree | 129 (91.5%) | 0 (0.0%) |
| Bachelor's Degree or higher | 61 (89.7%) | 0 (0.0%) |
| Total | 278 (81.5%) | 0 (0.0%) |
Employment Occupations by Sex in Nortonville
Management, Business, Science and Arts Occupations
The most common Management, Business, Science and Arts occupations in Nortonville are Community & Social Service (22 | 6.5%), Management (20 | 5.9%), Education Instruction & Library (16 | 4.7%), Health Diagnosing & Treating (11 | 3.2%), and Computers, Engineering & Science (10 | 2.9%).
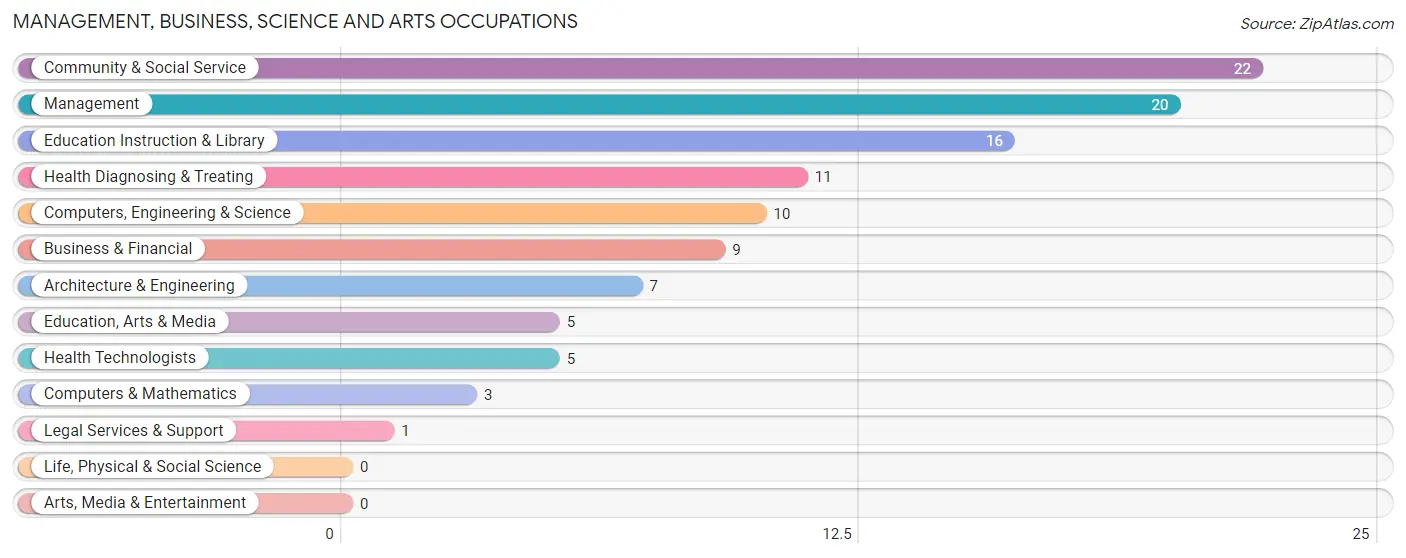
Management, Business, Science and Arts Occupations by Sex
Within the Management, Business, Science and Arts occupations in Nortonville, the most male-oriented occupations are Architecture & Engineering (100.0%), Education, Arts & Media (100.0%), and Computers, Engineering & Science (70.0%), while the most female-oriented occupations are Computers & Mathematics (100.0%), Legal Services & Support (100.0%), and Health Diagnosing & Treating (100.0%).
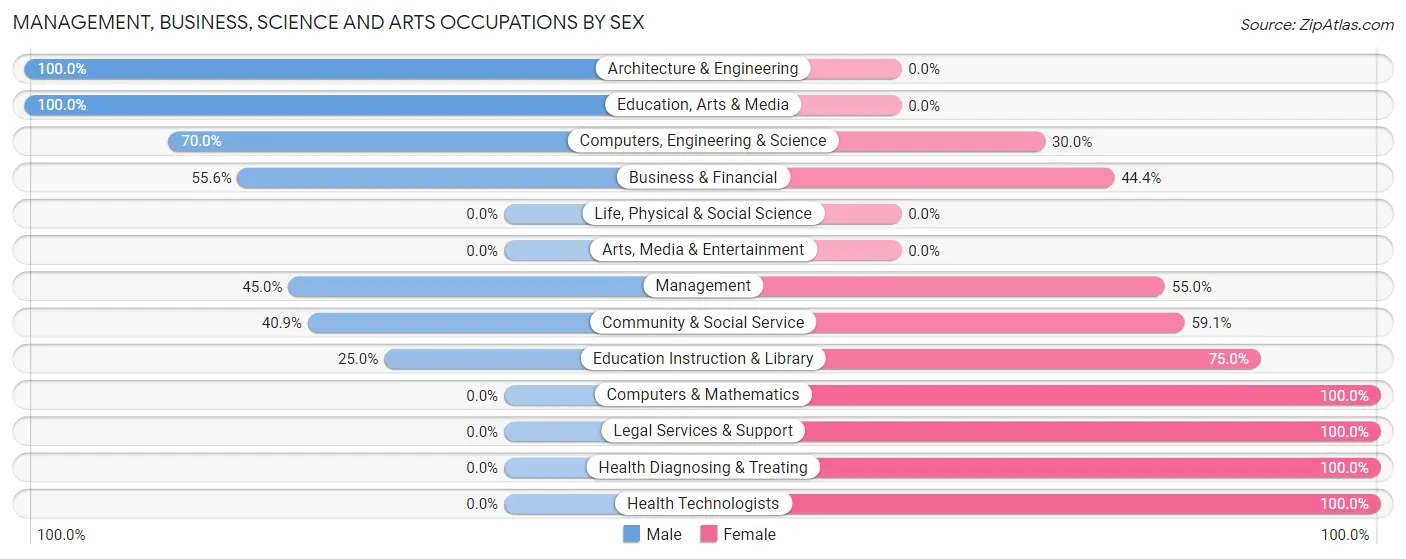
| Occupation | Male | Female |
| Management | 9 (45.0%) | 11 (55.0%) |
| Business & Financial | 5 (55.6%) | 4 (44.4%) |
| Computers, Engineering & Science | 7 (70.0%) | 3 (30.0%) |
| Computers & Mathematics | 0 (0.0%) | 3 (100.0%) |
| Architecture & Engineering | 7 (100.0%) | 0 (0.0%) |
| Life, Physical & Social Science | 0 (0.0%) | 0 (0.0%) |
| Community & Social Service | 9 (40.9%) | 13 (59.1%) |
| Education, Arts & Media | 5 (100.0%) | 0 (0.0%) |
| Legal Services & Support | 0 (0.0%) | 1 (100.0%) |
| Education Instruction & Library | 4 (25.0%) | 12 (75.0%) |
| Arts, Media & Entertainment | 0 (0.0%) | 0 (0.0%) |
| Health Diagnosing & Treating | 0 (0.0%) | 11 (100.0%) |
| Health Technologists | 0 (0.0%) | 5 (100.0%) |
| Total (Category) | 30 (41.7%) | 42 (58.3%) |
| Total (Overall) | 213 (62.6%) | 127 (37.3%) |
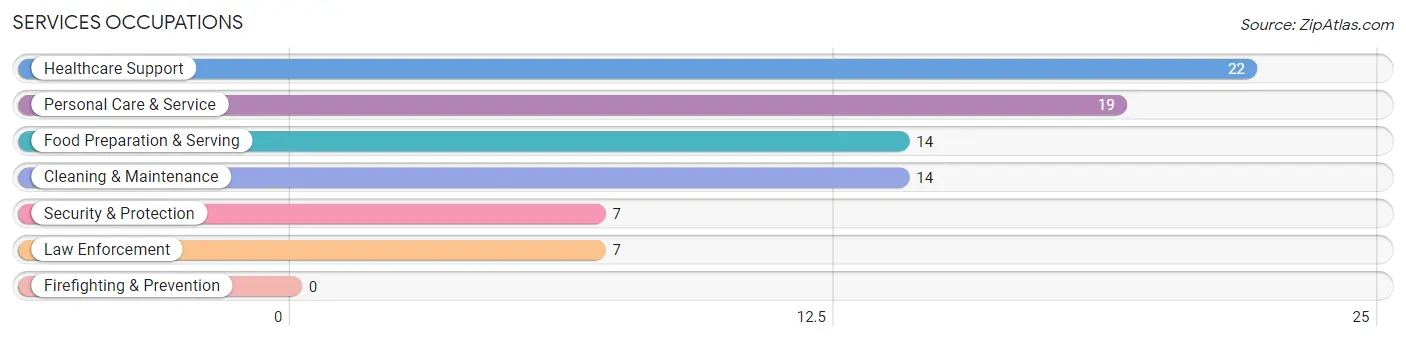
Services Occupations
The most common Services occupations in Nortonville are Healthcare Support (22 | 6.5%), Personal Care & Service (19 | 5.6%), Food Preparation & Serving (14 | 4.1%), Cleaning & Maintenance (14 | 4.1%), and Security & Protection (7 | 2.1%).
Services Occupations by Sex
Within the Services occupations in Nortonville, the most male-oriented occupations are Cleaning & Maintenance (100.0%), Healthcare Support (59.1%), and Security & Protection (42.9%), while the most female-oriented occupations are Personal Care & Service (89.5%), Food Preparation & Serving (78.6%), and Security & Protection (57.1%).
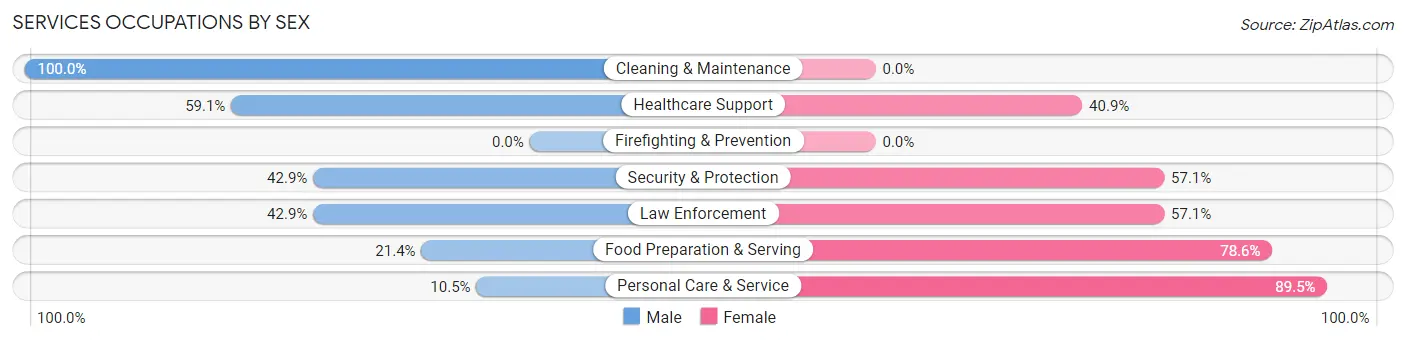
| Occupation | Male | Female |
| Healthcare Support | 13 (59.1%) | 9 (40.9%) |
| Security & Protection | 3 (42.9%) | 4 (57.1%) |
| Firefighting & Prevention | 0 (0.0%) | 0 (0.0%) |
| Law Enforcement | 3 (42.9%) | 4 (57.1%) |
| Food Preparation & Serving | 3 (21.4%) | 11 (78.6%) |
| Cleaning & Maintenance | 14 (100.0%) | 0 (0.0%) |
| Personal Care & Service | 2 (10.5%) | 17 (89.5%) |
| Total (Category) | 35 (46.1%) | 41 (53.9%) |
| Total (Overall) | 213 (62.6%) | 127 (37.3%) |
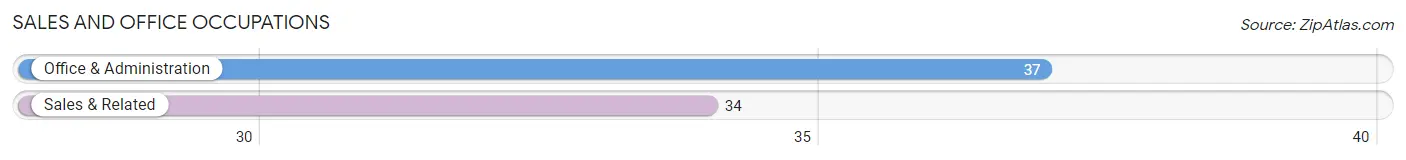
Sales and Office Occupations
The most common Sales and Office occupations in Nortonville are Office & Administration (37 | 10.9%), and Sales & Related (34 | 10.0%).
Sales and Office Occupations by Sex
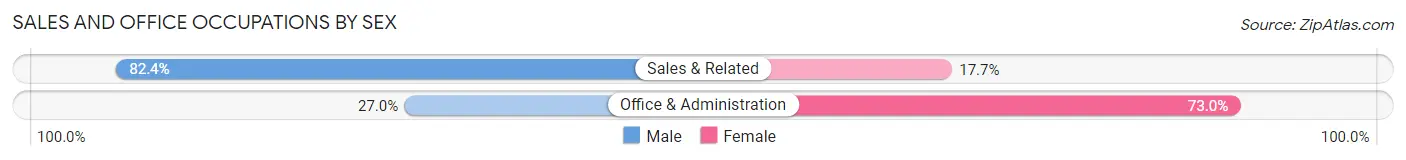
| Occupation | Male | Female |
| Sales & Related | 28 (82.4%) | 6 (17.6%) |
| Office & Administration | 10 (27.0%) | 27 (73.0%) |
| Total (Category) | 38 (53.5%) | 33 (46.5%) |
| Total (Overall) | 213 (62.6%) | 127 (37.3%) |
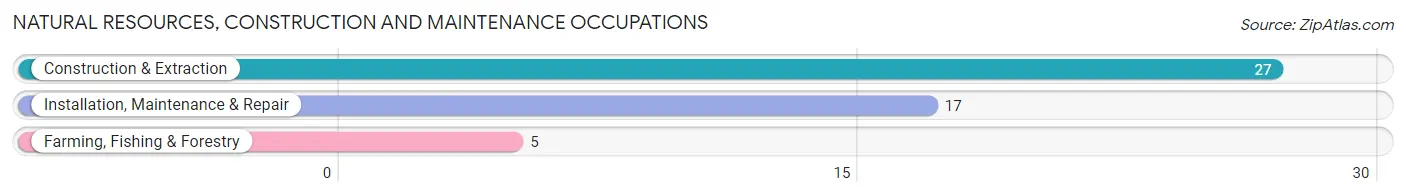
Natural Resources, Construction and Maintenance Occupations
The most common Natural Resources, Construction and Maintenance occupations in Nortonville are Construction & Extraction (27 | 7.9%), Installation, Maintenance & Repair (17 | 5.0%), and Farming, Fishing & Forestry (5 | 1.5%).
Natural Resources, Construction and Maintenance Occupations by Sex
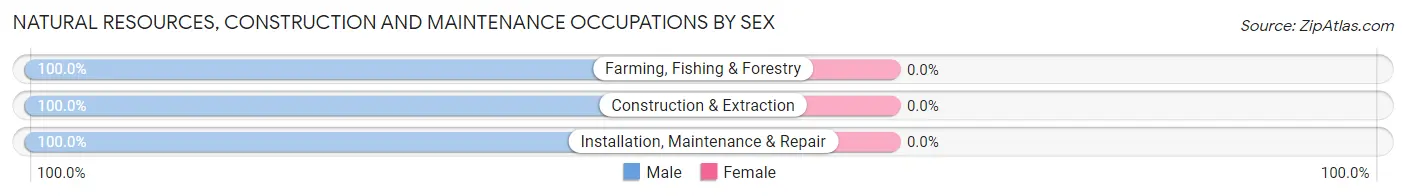
| Occupation | Male | Female |
| Farming, Fishing & Forestry | 5 (100.0%) | 0 (0.0%) |
| Construction & Extraction | 27 (100.0%) | 0 (0.0%) |
| Installation, Maintenance & Repair | 17 (100.0%) | 0 (0.0%) |
| Total (Category) | 49 (100.0%) | 0 (0.0%) |
| Total (Overall) | 213 (62.6%) | 127 (37.3%) |
Production, Transportation and Moving Occupations
The most common Production, Transportation and Moving occupations in Nortonville are Production (38 | 11.2%), Material Moving (19 | 5.6%), and Transportation (15 | 4.4%).
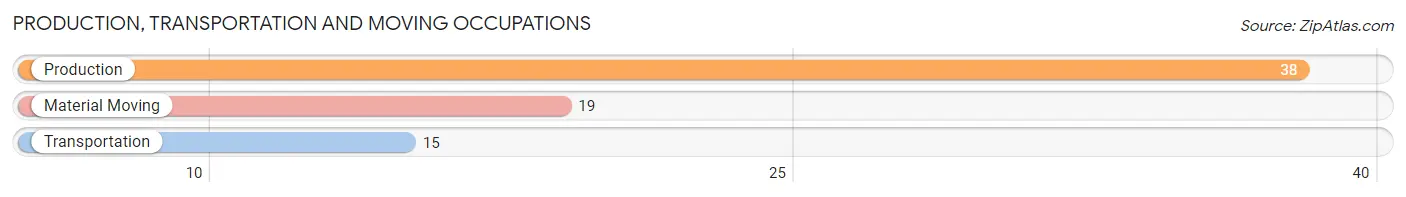
Production, Transportation and Moving Occupations by Sex
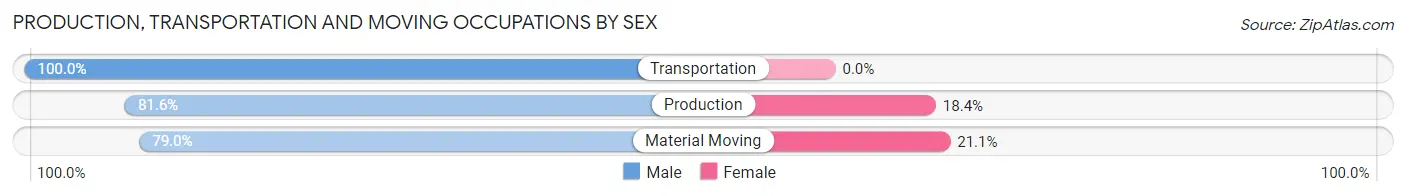
| Occupation | Male | Female |
| Production | 31 (81.6%) | 7 (18.4%) |
| Transportation | 15 (100.0%) | 0 (0.0%) |
| Material Moving | 15 (78.9%) | 4 (21.0%) |
| Total (Category) | 61 (84.7%) | 11 (15.3%) |
| Total (Overall) | 213 (62.6%) | 127 (37.3%) |
Employment Industries by Sex in Nortonville
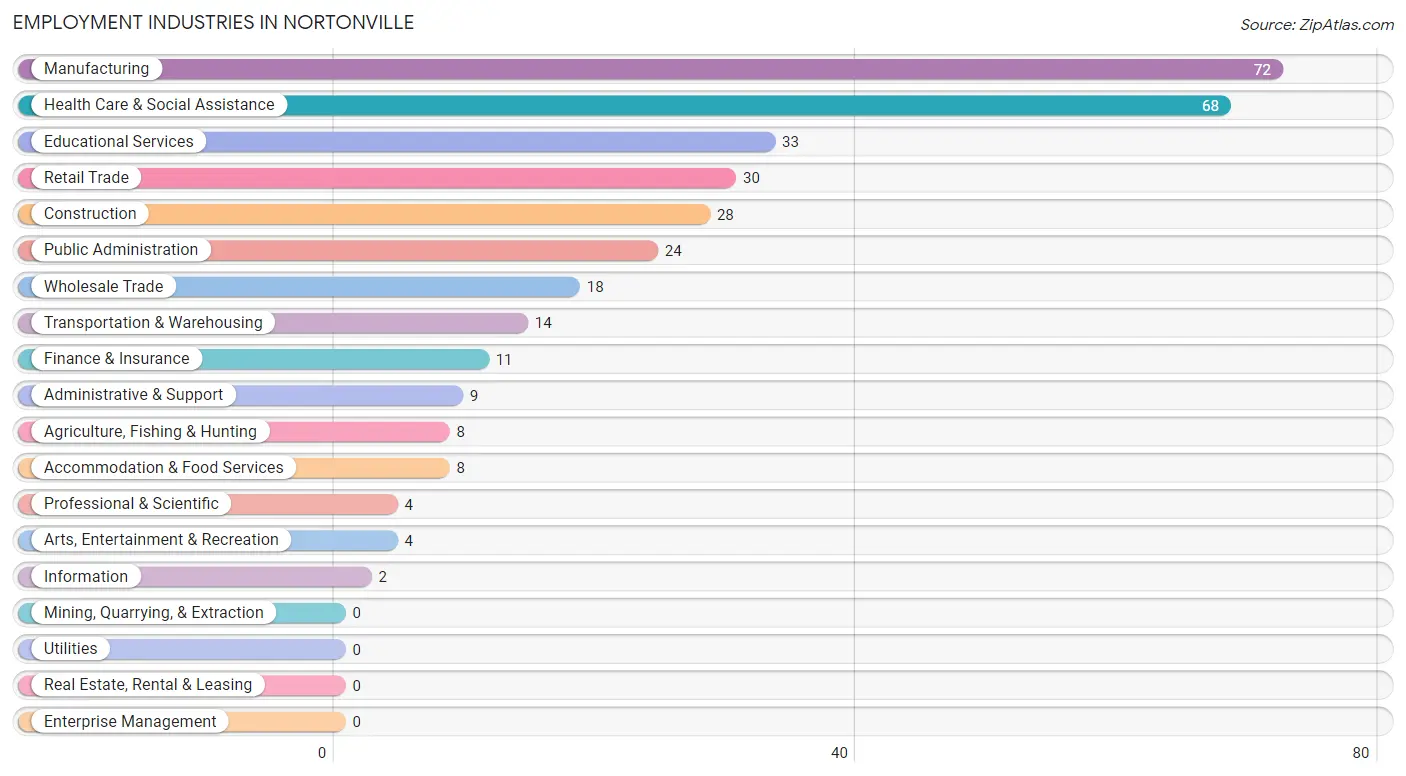
Employment Industries in Nortonville
The major employment industries in Nortonville include Manufacturing (72 | 21.2%), Health Care & Social Assistance (68 | 20.0%), Educational Services (33 | 9.7%), Retail Trade (30 | 8.8%), and Construction (28 | 8.2%).
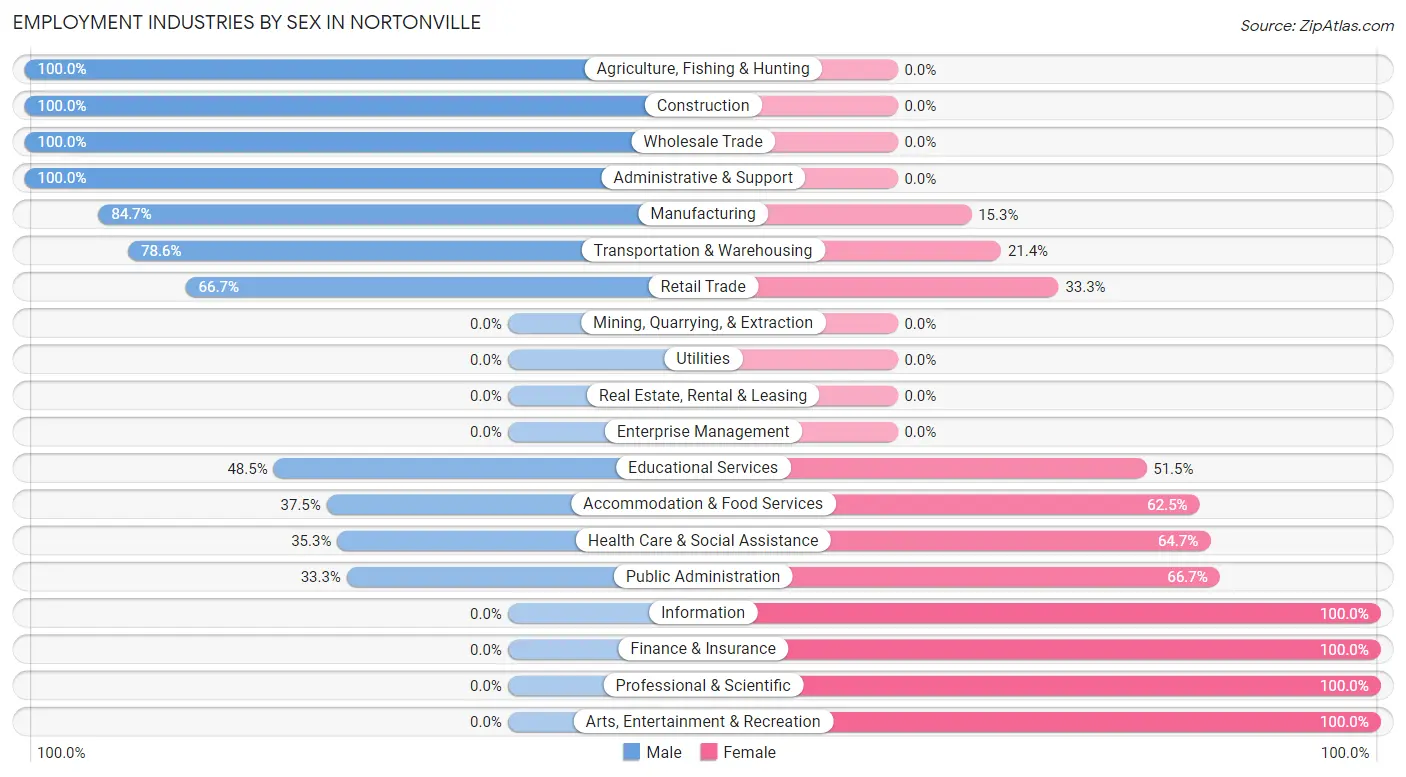
Employment Industries by Sex in Nortonville
The Nortonville industries that see more men than women are Agriculture, Fishing & Hunting (100.0%), Construction (100.0%), and Wholesale Trade (100.0%), whereas the industries that tend to have a higher number of women are Information (100.0%), Finance & Insurance (100.0%), and Professional & Scientific (100.0%).
| Industry | Male | Female |
| Agriculture, Fishing & Hunting | 8 (100.0%) | 0 (0.0%) |
| Mining, Quarrying, & Extraction | 0 (0.0%) | 0 (0.0%) |
| Construction | 28 (100.0%) | 0 (0.0%) |
| Manufacturing | 61 (84.7%) | 11 (15.3%) |
| Wholesale Trade | 18 (100.0%) | 0 (0.0%) |
| Retail Trade | 20 (66.7%) | 10 (33.3%) |
| Transportation & Warehousing | 11 (78.6%) | 3 (21.4%) |
| Utilities | 0 (0.0%) | 0 (0.0%) |
| Information | 0 (0.0%) | 2 (100.0%) |
| Finance & Insurance | 0 (0.0%) | 11 (100.0%) |
| Real Estate, Rental & Leasing | 0 (0.0%) | 0 (0.0%) |
| Professional & Scientific | 0 (0.0%) | 4 (100.0%) |
| Enterprise Management | 0 (0.0%) | 0 (0.0%) |
| Administrative & Support | 9 (100.0%) | 0 (0.0%) |
| Educational Services | 16 (48.5%) | 17 (51.5%) |
| Health Care & Social Assistance | 24 (35.3%) | 44 (64.7%) |
| Arts, Entertainment & Recreation | 0 (0.0%) | 4 (100.0%) |
| Accommodation & Food Services | 3 (37.5%) | 5 (62.5%) |
| Public Administration | 8 (33.3%) | 16 (66.7%) |
| Total | 213 (62.6%) | 127 (37.3%) |
Education in Nortonville
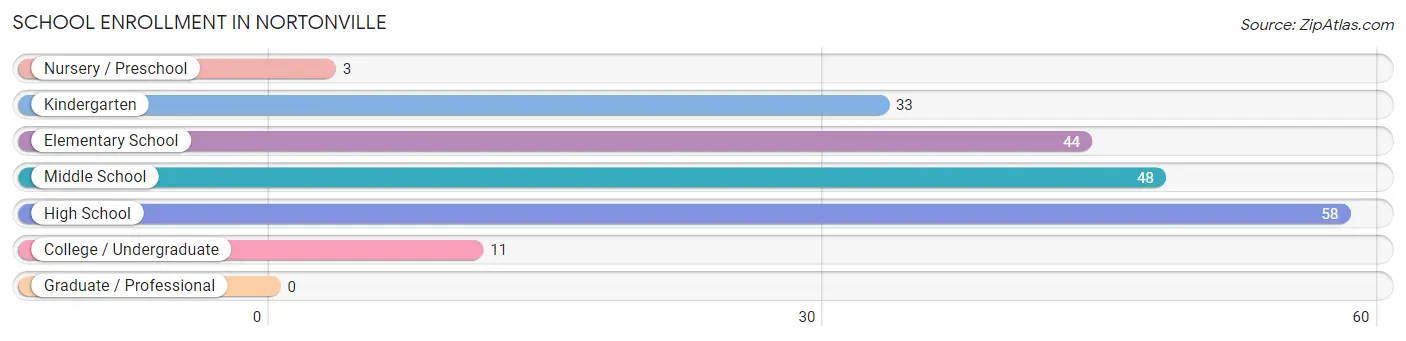
School Enrollment in Nortonville
The most common levels of schooling among the 197 students in Nortonville are high school (58 | 29.4%), middle school (48 | 24.4%), and elementary school (44 | 22.3%).
| School Level | # Students | % Students |
| Nursery / Preschool | 3 | 1.5% |
| Kindergarten | 33 | 16.8% |
| Elementary School | 44 | 22.3% |
| Middle School | 48 | 24.4% |
| High School | 58 | 29.4% |
| College / Undergraduate | 11 | 5.6% |
| Graduate / Professional | 0 | 0.0% |
| Total | 197 | 100.0% |
School Enrollment by Age by Funding Source in Nortonville
Out of a total of 197 students who are enrolled in schools in Nortonville, 16 (8.1%) attend a private institution, while the remaining 181 (91.9%) are enrolled in public schools. The age group of 20 to 24 year olds has the highest likelihood of being enrolled in private schools, with 5 (45.5% in the age bracket) enrolled. Conversely, the age group of 3 to 4 year olds has the lowest likelihood of being enrolled in a private school, with 3 (100.0% in the age bracket) attending a public institution.
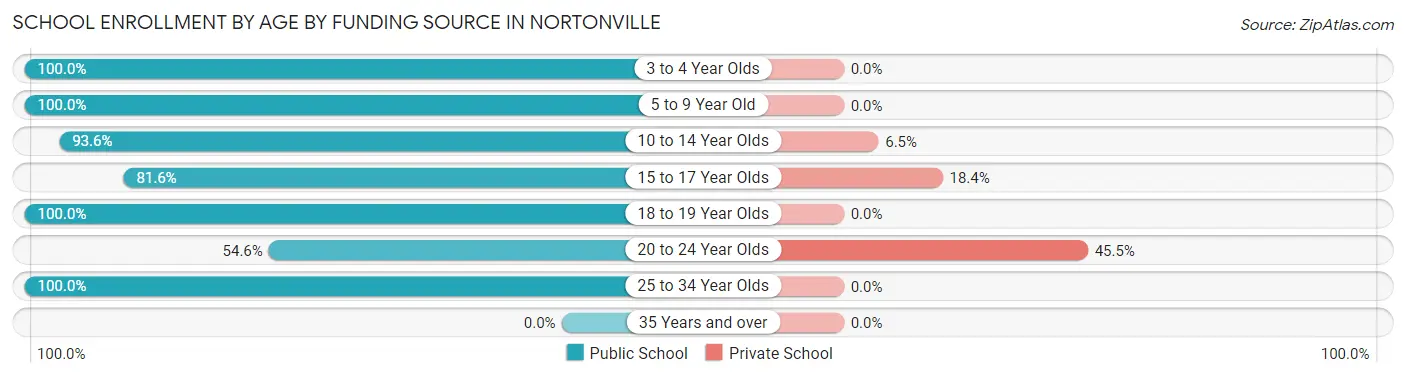
| Age Bracket | Public School | Private School |
| 3 to 4 Year Olds | 3 (100.0%) | 0 (0.0%) |
| 5 to 9 Year Old | 70 (100.0%) | 0 (0.0%) |
| 10 to 14 Year Olds | 58 (93.5%) | 4 (6.5%) |
| 15 to 17 Year Olds | 31 (81.6%) | 7 (18.4%) |
| 18 to 19 Year Olds | 10 (100.0%) | 0 (0.0%) |
| 20 to 24 Year Olds | 6 (54.5%) | 5 (45.5%) |
| 25 to 34 Year Olds | 3 (100.0%) | 0 (0.0%) |
| 35 Years and over | 0 (0.0%) | 0 (0.0%) |
| Total | 181 (91.9%) | 16 (8.1%) |
Educational Attainment by Field of Study in Nortonville
Business (24 | 25.3%), education (16 | 16.8%), science & technology (15 | 15.8%), bio, nature & agricultural (10 | 10.5%), and computers & mathematics (9 | 9.5%) are the most common fields of study among 95 individuals in Nortonville who have obtained a bachelor's degree or higher.
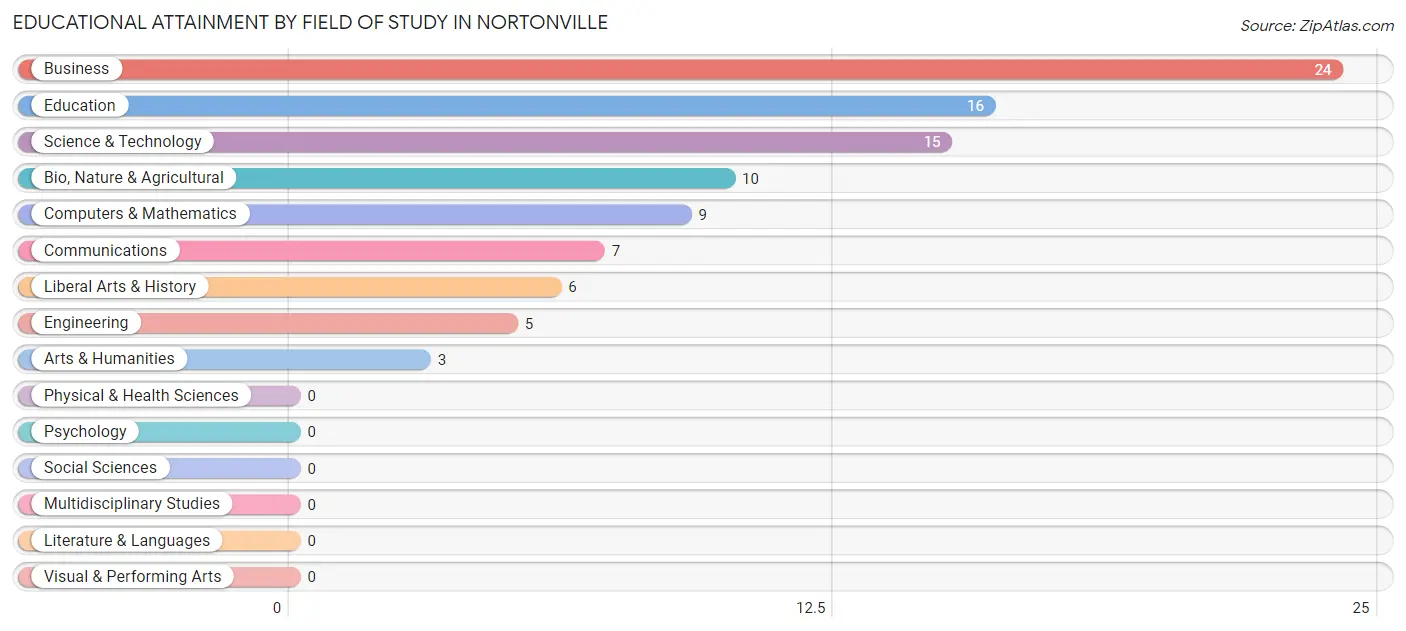
| Field of Study | # Graduates | % Graduates |
| Computers & Mathematics | 9 | 9.5% |
| Bio, Nature & Agricultural | 10 | 10.5% |
| Physical & Health Sciences | 0 | 0.0% |
| Psychology | 0 | 0.0% |
| Social Sciences | 0 | 0.0% |
| Engineering | 5 | 5.3% |
| Multidisciplinary Studies | 0 | 0.0% |
| Science & Technology | 15 | 15.8% |
| Business | 24 | 25.3% |
| Education | 16 | 16.8% |
| Literature & Languages | 0 | 0.0% |
| Liberal Arts & History | 6 | 6.3% |
| Visual & Performing Arts | 0 | 0.0% |
| Communications | 7 | 7.4% |
| Arts & Humanities | 3 | 3.2% |
| Total | 95 | 100.0% |
Transportation & Commute in Nortonville
Vehicle Availability by Sex in Nortonville
The most prevalent vehicle ownership categories in Nortonville are males with 3 vehicles (100, accounting for 47.4%) and females with 3 vehicles (59, making up 78.7%).
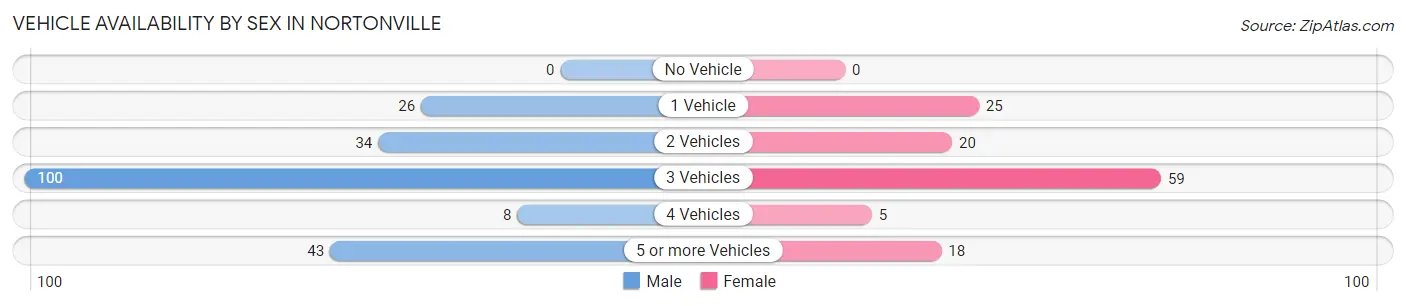
| Vehicles Available | Male | Female |
| No Vehicle | 0 (0.0%) | 0 (0.0%) |
| 1 Vehicle | 26 (12.3%) | 25 (19.7%) |
| 2 Vehicles | 34 (16.1%) | 20 (15.8%) |
| 3 Vehicles | 100 (47.4%) | 59 (46.5%) |
| 4 Vehicles | 8 (3.8%) | 5 (3.9%) |
| 5 or more Vehicles | 43 (20.4%) | 18 (14.2%) |
| Total | 211 (100.0%) | 127 (100.0%) |
Commute Time in Nortonville
The most frequently occuring commute durations in Nortonville are 45 to 59 minutes (70 commuters, 22.1%), 15 to 19 minutes (44 commuters, 13.9%), and 40 to 44 minutes (38 commuters, 12.0%).
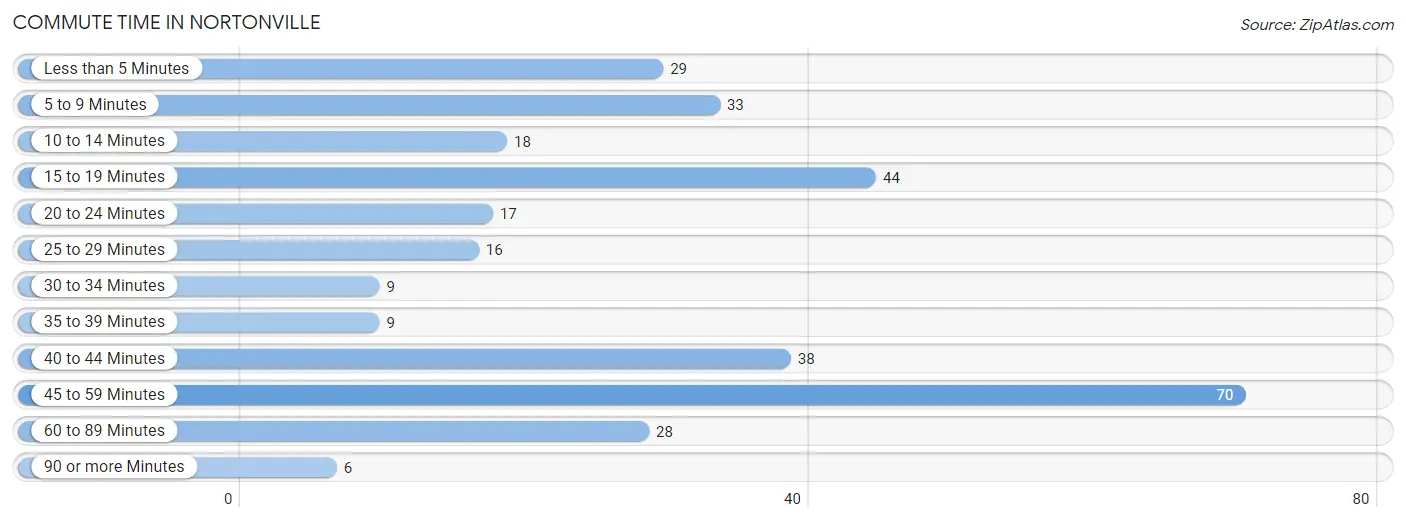
| Commute Time | # Commuters | % Commuters |
| Less than 5 Minutes | 29 | 9.1% |
| 5 to 9 Minutes | 33 | 10.4% |
| 10 to 14 Minutes | 18 | 5.7% |
| 15 to 19 Minutes | 44 | 13.9% |
| 20 to 24 Minutes | 17 | 5.4% |
| 25 to 29 Minutes | 16 | 5.1% |
| 30 to 34 Minutes | 9 | 2.8% |
| 35 to 39 Minutes | 9 | 2.8% |
| 40 to 44 Minutes | 38 | 12.0% |
| 45 to 59 Minutes | 70 | 22.1% |
| 60 to 89 Minutes | 28 | 8.8% |
| 90 or more Minutes | 6 | 1.9% |
Commute Time by Sex in Nortonville
The most common commute times in Nortonville are 45 to 59 minutes (44 commuters, 21.5%) for males and 45 to 59 minutes (26 commuters, 23.2%) for females.
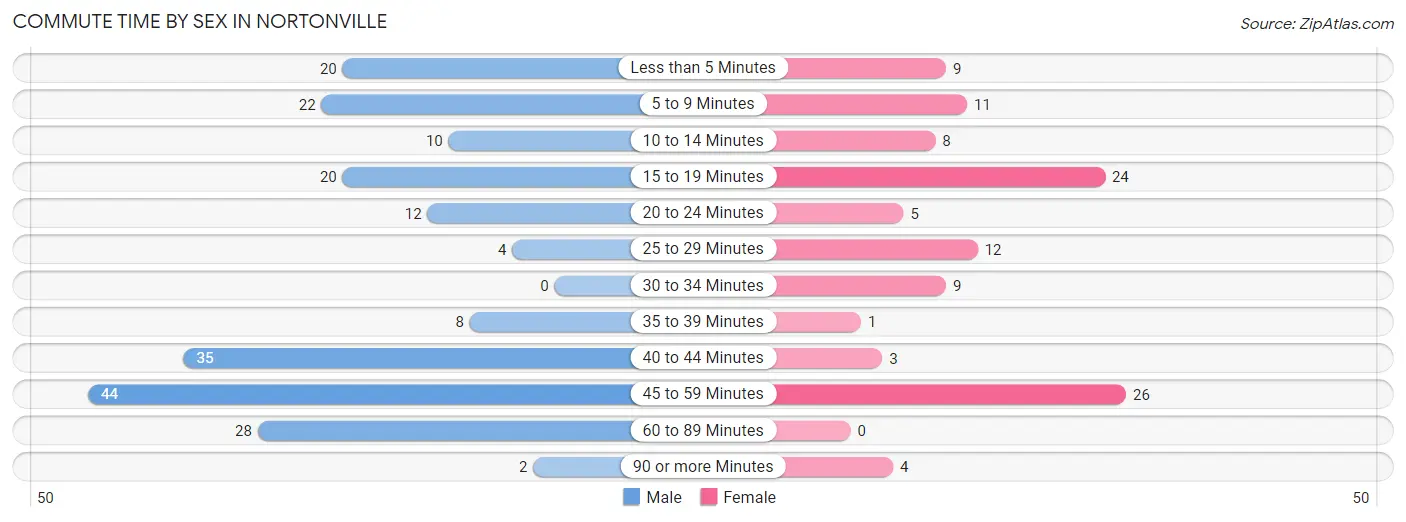
| Commute Time | Male | Female |
| Less than 5 Minutes | 20 (9.8%) | 9 (8.0%) |
| 5 to 9 Minutes | 22 (10.7%) | 11 (9.8%) |
| 10 to 14 Minutes | 10 (4.9%) | 8 (7.1%) |
| 15 to 19 Minutes | 20 (9.8%) | 24 (21.4%) |
| 20 to 24 Minutes | 12 (5.9%) | 5 (4.5%) |
| 25 to 29 Minutes | 4 (1.9%) | 12 (10.7%) |
| 30 to 34 Minutes | 0 (0.0%) | 9 (8.0%) |
| 35 to 39 Minutes | 8 (3.9%) | 1 (0.9%) |
| 40 to 44 Minutes | 35 (17.1%) | 3 (2.7%) |
| 45 to 59 Minutes | 44 (21.5%) | 26 (23.2%) |
| 60 to 89 Minutes | 28 (13.7%) | 0 (0.0%) |
| 90 or more Minutes | 2 (1.0%) | 4 (3.6%) |
Time of Departure to Work by Sex in Nortonville
The most frequent times of departure to work in Nortonville are 5:00 AM to 5:29 AM (35, 17.1%) for males and 7:00 AM to 7:29 AM (28, 25.0%) for females.
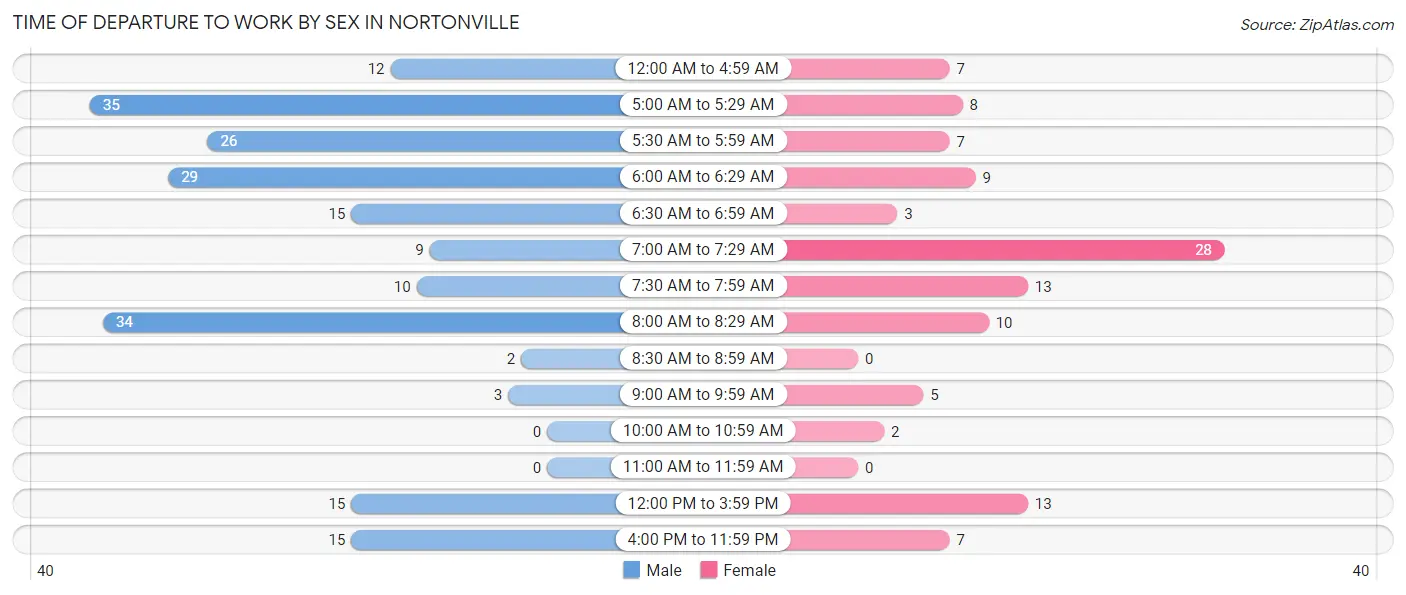
| Time of Departure | Male | Female |
| 12:00 AM to 4:59 AM | 12 (5.9%) | 7 (6.2%) |
| 5:00 AM to 5:29 AM | 35 (17.1%) | 8 (7.1%) |
| 5:30 AM to 5:59 AM | 26 (12.7%) | 7 (6.2%) |
| 6:00 AM to 6:29 AM | 29 (14.1%) | 9 (8.0%) |
| 6:30 AM to 6:59 AM | 15 (7.3%) | 3 (2.7%) |
| 7:00 AM to 7:29 AM | 9 (4.4%) | 28 (25.0%) |
| 7:30 AM to 7:59 AM | 10 (4.9%) | 13 (11.6%) |
| 8:00 AM to 8:29 AM | 34 (16.6%) | 10 (8.9%) |
| 8:30 AM to 8:59 AM | 2 (1.0%) | 0 (0.0%) |
| 9:00 AM to 9:59 AM | 3 (1.5%) | 5 (4.5%) |
| 10:00 AM to 10:59 AM | 0 (0.0%) | 2 (1.8%) |
| 11:00 AM to 11:59 AM | 0 (0.0%) | 0 (0.0%) |
| 12:00 PM to 3:59 PM | 15 (7.3%) | 13 (11.6%) |
| 4:00 PM to 11:59 PM | 15 (7.3%) | 7 (6.2%) |
| Total | 205 (100.0%) | 112 (100.0%) |
Housing Occupancy in Nortonville
Occupancy by Ownership in Nortonville
Of the total 280 dwellings in Nortonville, owner-occupied units account for 211 (75.4%), while renter-occupied units make up 69 (24.6%).
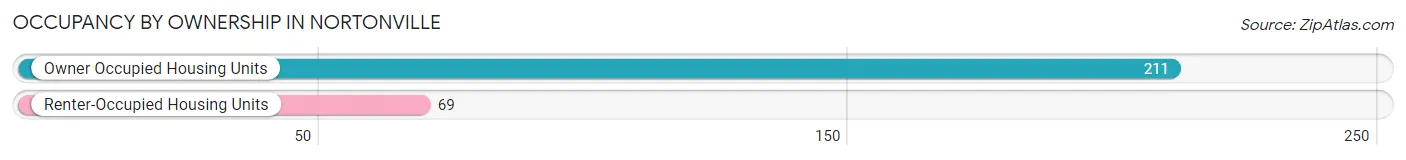
| Occupancy | # Housing Units | % Housing Units |
| Owner Occupied Housing Units | 211 | 75.4% |
| Renter-Occupied Housing Units | 69 | 24.6% |
| Total Occupied Housing Units | 280 | 100.0% |
Occupancy by Household Size in Nortonville
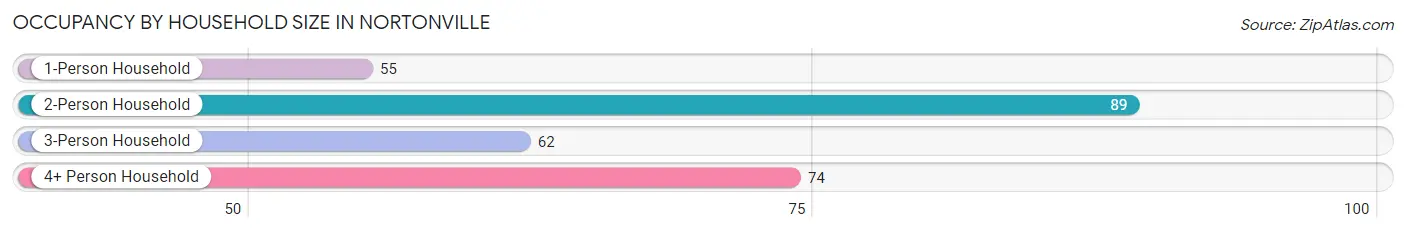
| Household Size | # Housing Units | % Housing Units |
| 1-Person Household | 55 | 19.6% |
| 2-Person Household | 89 | 31.8% |
| 3-Person Household | 62 | 22.1% |
| 4+ Person Household | 74 | 26.4% |
| Total Housing Units | 280 | 100.0% |
Occupancy by Ownership by Household Size in Nortonville
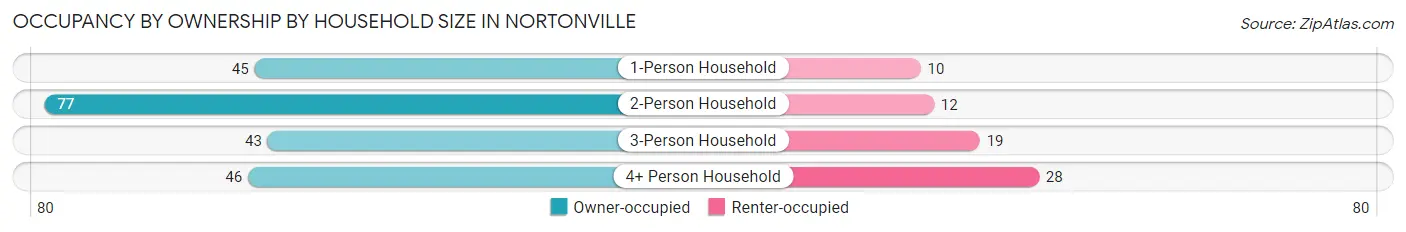
| Household Size | Owner-occupied | Renter-occupied |
| 1-Person Household | 45 (81.8%) | 10 (18.2%) |
| 2-Person Household | 77 (86.5%) | 12 (13.5%) |
| 3-Person Household | 43 (69.4%) | 19 (30.6%) |
| 4+ Person Household | 46 (62.2%) | 28 (37.8%) |
| Total Housing Units | 211 (75.4%) | 69 (24.6%) |
Occupancy by Educational Attainment in Nortonville
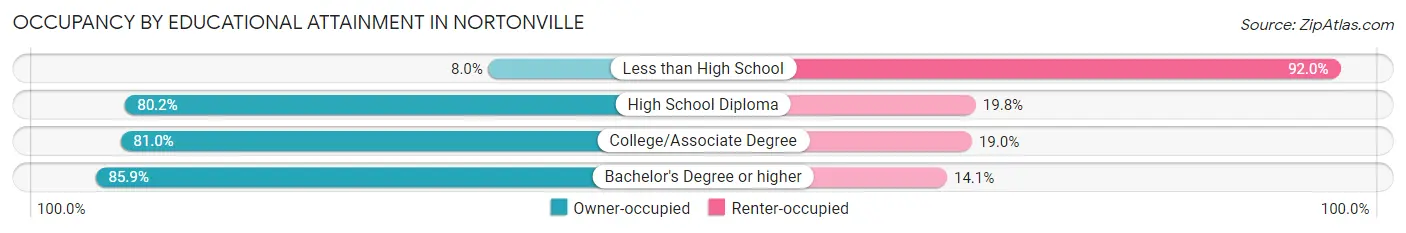
| Household Size | Owner-occupied | Renter-occupied |
| Less than High School | 2 (8.0%) | 23 (92.0%) |
| High School Diploma | 73 (80.2%) | 18 (19.8%) |
| College/Associate Degree | 81 (81.0%) | 19 (19.0%) |
| Bachelor's Degree or higher | 55 (85.9%) | 9 (14.1%) |
Occupancy by Age of Householder in Nortonville
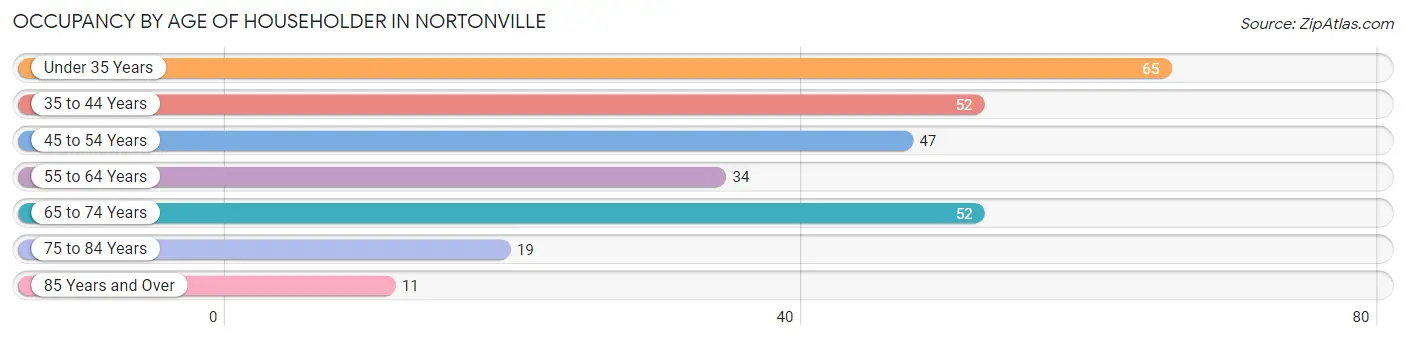
| Age Bracket | # Households | % Households |
| Under 35 Years | 65 | 23.2% |
| 35 to 44 Years | 52 | 18.6% |
| 45 to 54 Years | 47 | 16.8% |
| 55 to 64 Years | 34 | 12.1% |
| 65 to 74 Years | 52 | 18.6% |
| 75 to 84 Years | 19 | 6.8% |
| 85 Years and Over | 11 | 3.9% |
| Total | 280 | 100.0% |
Housing Finances in Nortonville
Median Income by Occupancy in Nortonville
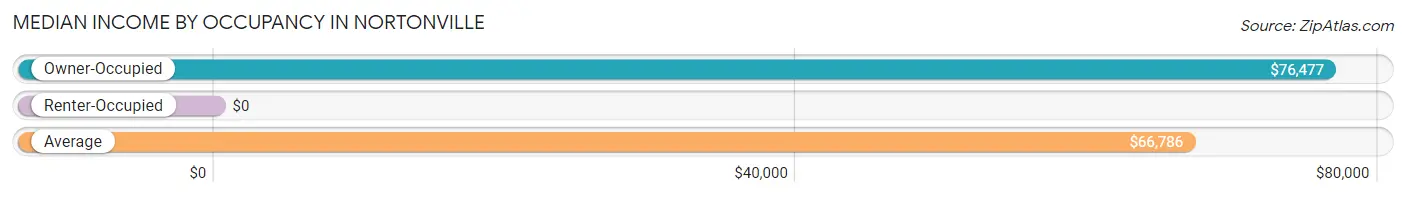
| Occupancy Type | # Households | Median Income |
| Owner-Occupied | 211 (75.4%) | $76,477 |
| Renter-Occupied | 69 (24.6%) | $0 |
| Average | 280 (100.0%) | $66,786 |
Occupancy by Householder Income Bracket in Nortonville
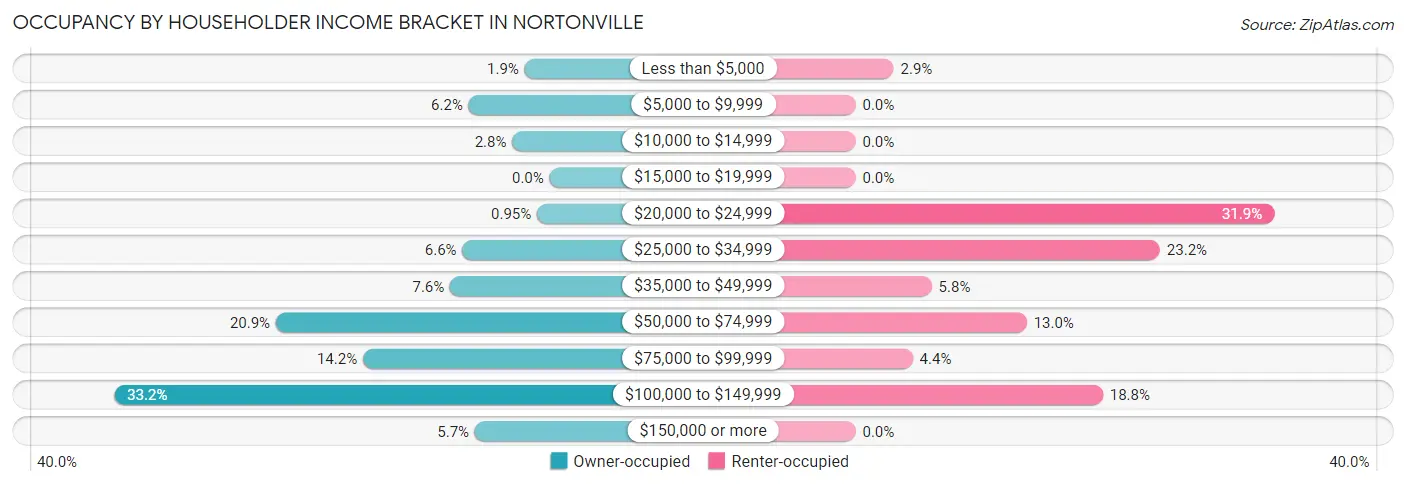
| Income Bracket | Owner-occupied | Renter-occupied |
| Less than $5,000 | 4 (1.9%) | 2 (2.9%) |
| $5,000 to $9,999 | 13 (6.2%) | 0 (0.0%) |
| $10,000 to $14,999 | 6 (2.8%) | 0 (0.0%) |
| $15,000 to $19,999 | 0 (0.0%) | 0 (0.0%) |
| $20,000 to $24,999 | 2 (0.9%) | 22 (31.9%) |
| $25,000 to $34,999 | 14 (6.6%) | 16 (23.2%) |
| $35,000 to $49,999 | 16 (7.6%) | 4 (5.8%) |
| $50,000 to $74,999 | 44 (20.8%) | 9 (13.0%) |
| $75,000 to $99,999 | 30 (14.2%) | 3 (4.3%) |
| $100,000 to $149,999 | 70 (33.2%) | 13 (18.8%) |
| $150,000 or more | 12 (5.7%) | 0 (0.0%) |
| Total | 211 (100.0%) | 69 (100.0%) |
Monthly Housing Cost Tiers in Nortonville
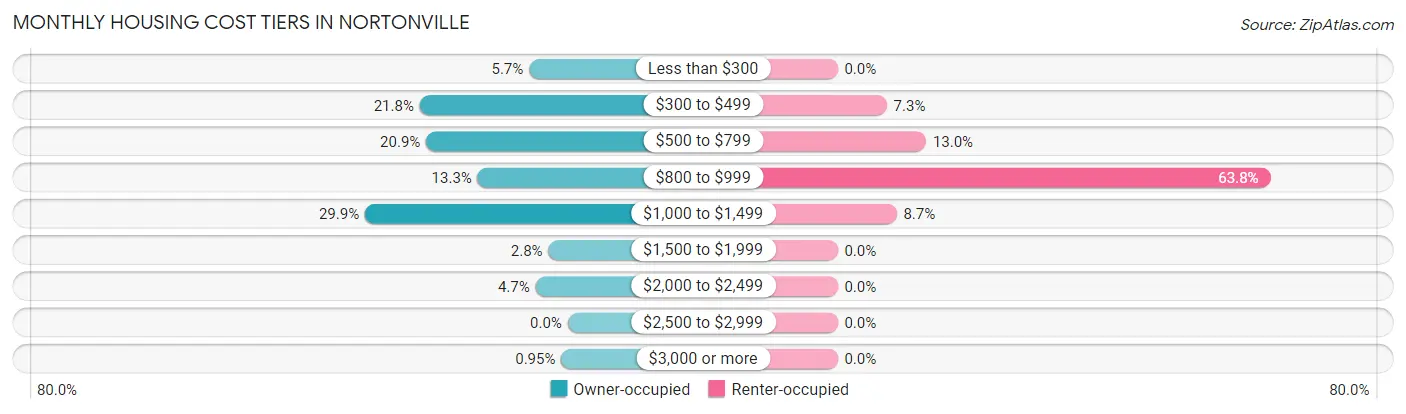
| Monthly Cost | Owner-occupied | Renter-occupied |
| Less than $300 | 12 (5.7%) | 0 (0.0%) |
| $300 to $499 | 46 (21.8%) | 5 (7.2%) |
| $500 to $799 | 44 (20.8%) | 9 (13.0%) |
| $800 to $999 | 28 (13.3%) | 44 (63.8%) |
| $1,000 to $1,499 | 63 (29.9%) | 6 (8.7%) |
| $1,500 to $1,999 | 6 (2.8%) | 0 (0.0%) |
| $2,000 to $2,499 | 10 (4.7%) | 0 (0.0%) |
| $2,500 to $2,999 | 0 (0.0%) | 0 (0.0%) |
| $3,000 or more | 2 (0.9%) | 0 (0.0%) |
| Total | 211 (100.0%) | 69 (100.0%) |
Physical Housing Characteristics in Nortonville
Housing Structures in Nortonville
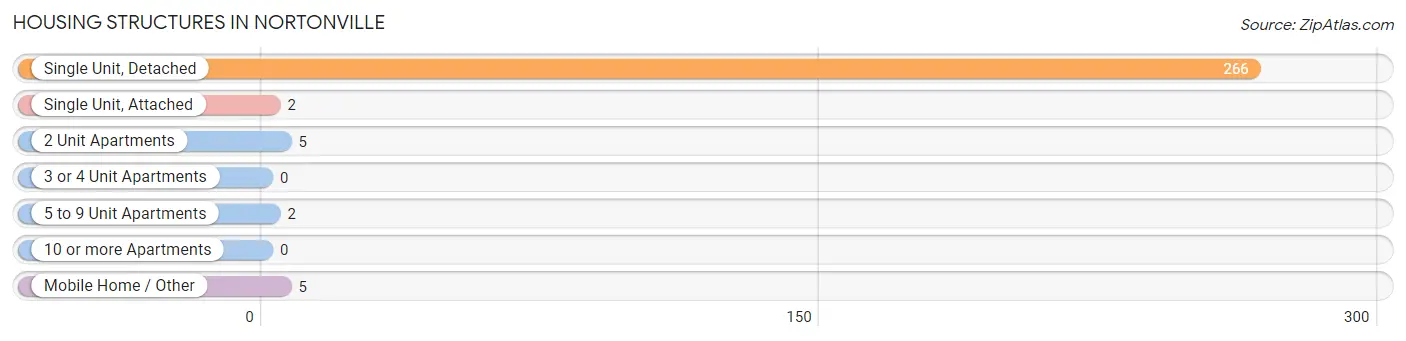
| Structure Type | # Housing Units | % Housing Units |
| Single Unit, Detached | 266 | 95.0% |
| Single Unit, Attached | 2 | 0.7% |
| 2 Unit Apartments | 5 | 1.8% |
| 3 or 4 Unit Apartments | 0 | 0.0% |
| 5 to 9 Unit Apartments | 2 | 0.7% |
| 10 or more Apartments | 0 | 0.0% |
| Mobile Home / Other | 5 | 1.8% |
| Total | 280 | 100.0% |
Housing Structures by Occupancy in Nortonville
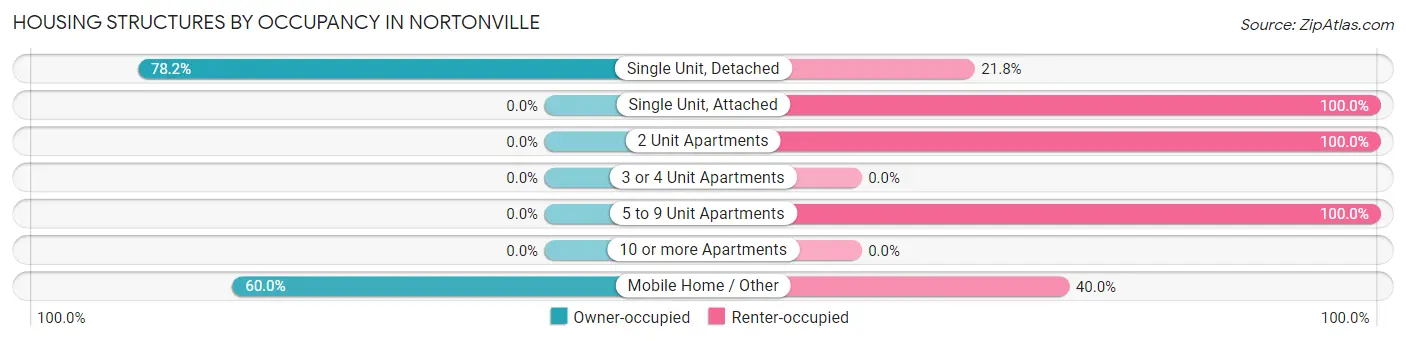
| Structure Type | Owner-occupied | Renter-occupied |
| Single Unit, Detached | 208 (78.2%) | 58 (21.8%) |
| Single Unit, Attached | 0 (0.0%) | 2 (100.0%) |
| 2 Unit Apartments | 0 (0.0%) | 5 (100.0%) |
| 3 or 4 Unit Apartments | 0 (0.0%) | 0 (0.0%) |
| 5 to 9 Unit Apartments | 0 (0.0%) | 2 (100.0%) |
| 10 or more Apartments | 0 (0.0%) | 0 (0.0%) |
| Mobile Home / Other | 3 (60.0%) | 2 (40.0%) |
| Total | 211 (75.4%) | 69 (24.6%) |
Housing Structures by Number of Rooms in Nortonville
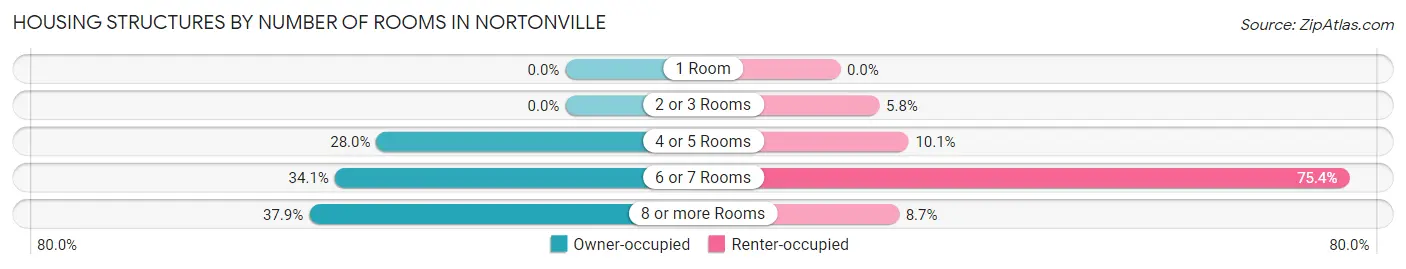
| Number of Rooms | Owner-occupied | Renter-occupied |
| 1 Room | 0 (0.0%) | 0 (0.0%) |
| 2 or 3 Rooms | 0 (0.0%) | 4 (5.8%) |
| 4 or 5 Rooms | 59 (28.0%) | 7 (10.1%) |
| 6 or 7 Rooms | 72 (34.1%) | 52 (75.4%) |
| 8 or more Rooms | 80 (37.9%) | 6 (8.7%) |
| Total | 211 (100.0%) | 69 (100.0%) |
Housing Structure by Heating Type in Nortonville
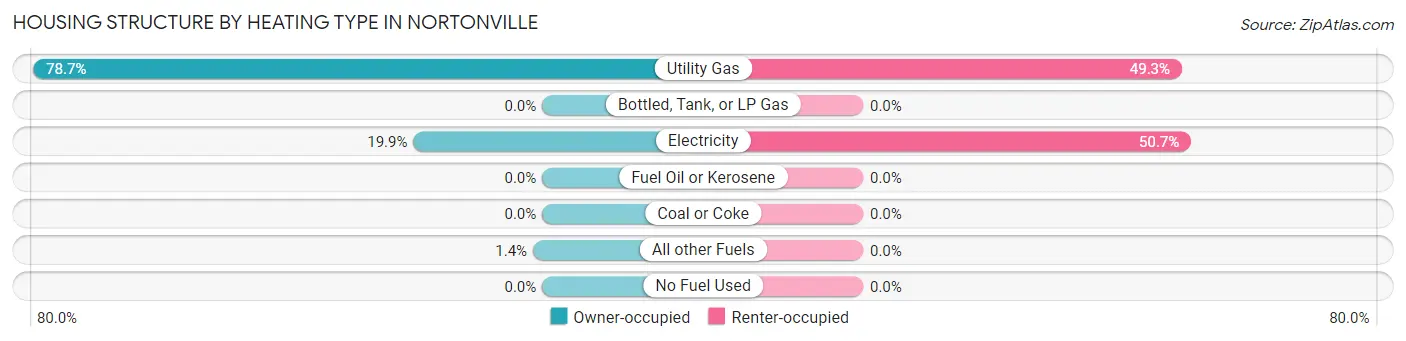
| Heating Type | Owner-occupied | Renter-occupied |
| Utility Gas | 166 (78.7%) | 34 (49.3%) |
| Bottled, Tank, or LP Gas | 0 (0.0%) | 0 (0.0%) |
| Electricity | 42 (19.9%) | 35 (50.7%) |
| Fuel Oil or Kerosene | 0 (0.0%) | 0 (0.0%) |
| Coal or Coke | 0 (0.0%) | 0 (0.0%) |
| All other Fuels | 3 (1.4%) | 0 (0.0%) |
| No Fuel Used | 0 (0.0%) | 0 (0.0%) |
| Total | 211 (100.0%) | 69 (100.0%) |
Household Vehicle Usage in Nortonville
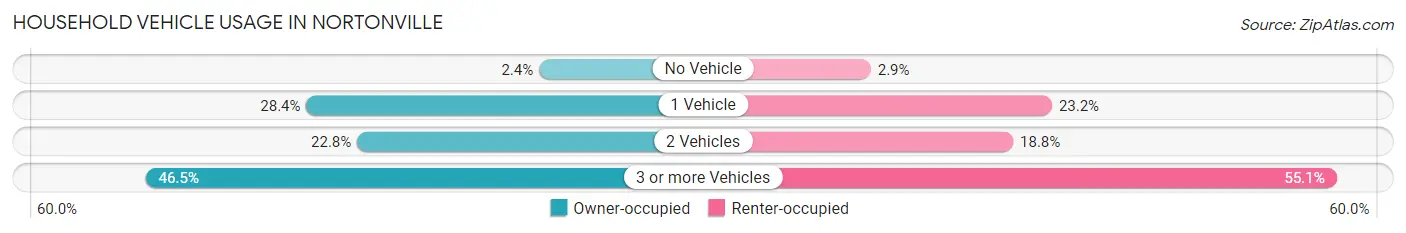
| Vehicles per Household | Owner-occupied | Renter-occupied |
| No Vehicle | 5 (2.4%) | 2 (2.9%) |
| 1 Vehicle | 60 (28.4%) | 16 (23.2%) |
| 2 Vehicles | 48 (22.8%) | 13 (18.8%) |
| 3 or more Vehicles | 98 (46.5%) | 38 (55.1%) |
| Total | 211 (100.0%) | 69 (100.0%) |
Real Estate & Mortgages in Nortonville
Real Estate and Mortgage Overview in Nortonville
| Characteristic | Without Mortgage | With Mortgage |
| Housing Units | 88 | 123 |
| Median Property Value | $74,800 | $94,800 |
| Median Household Income | $61,667 | $10 |
| Monthly Housing Costs | $450 | $0 |
| Real Estate Taxes | $1,162 | $0 |
Property Value by Mortgage Status in Nortonville
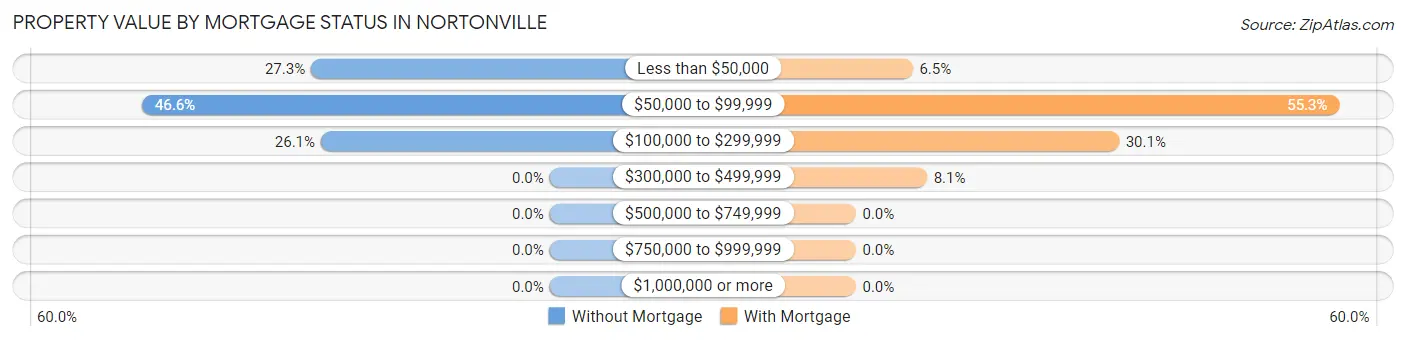
| Property Value | Without Mortgage | With Mortgage |
| Less than $50,000 | 24 (27.3%) | 8 (6.5%) |
| $50,000 to $99,999 | 41 (46.6%) | 68 (55.3%) |
| $100,000 to $299,999 | 23 (26.1%) | 37 (30.1%) |
| $300,000 to $499,999 | 0 (0.0%) | 10 (8.1%) |
| $500,000 to $749,999 | 0 (0.0%) | 0 (0.0%) |
| $750,000 to $999,999 | 0 (0.0%) | 0 (0.0%) |
| $1,000,000 or more | 0 (0.0%) | 0 (0.0%) |
| Total | 88 (100.0%) | 123 (100.0%) |
Household Income by Mortgage Status in Nortonville
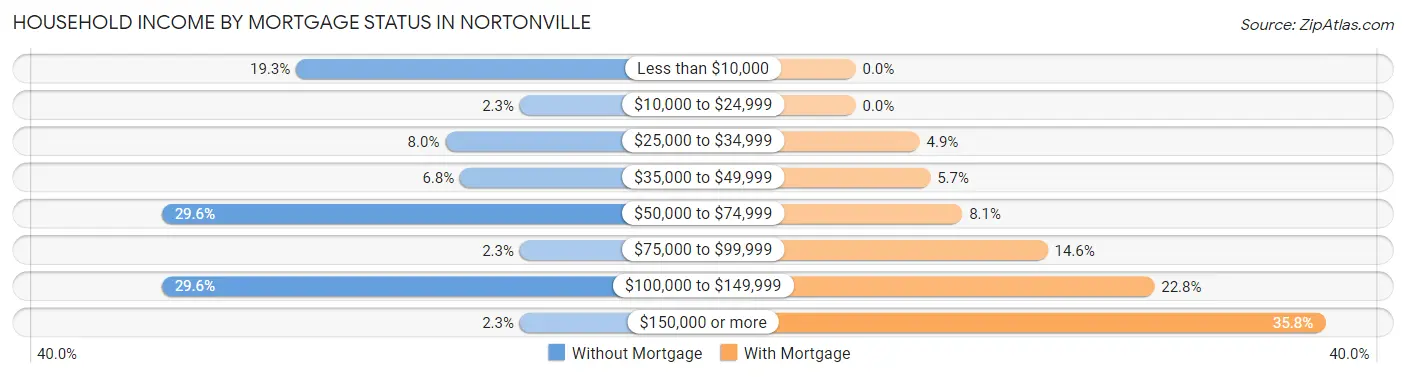
| Household Income | Without Mortgage | With Mortgage |
| Less than $10,000 | 17 (19.3%) | 0 (0.0%) |
| $10,000 to $24,999 | 2 (2.3%) | 0 (0.0%) |
| $25,000 to $34,999 | 7 (8.0%) | 6 (4.9%) |
| $35,000 to $49,999 | 6 (6.8%) | 7 (5.7%) |
| $50,000 to $74,999 | 26 (29.5%) | 10 (8.1%) |
| $75,000 to $99,999 | 2 (2.3%) | 18 (14.6%) |
| $100,000 to $149,999 | 26 (29.5%) | 28 (22.8%) |
| $150,000 or more | 2 (2.3%) | 44 (35.8%) |
| Total | 88 (100.0%) | 123 (100.0%) |
Property Value to Household Income Ratio in Nortonville
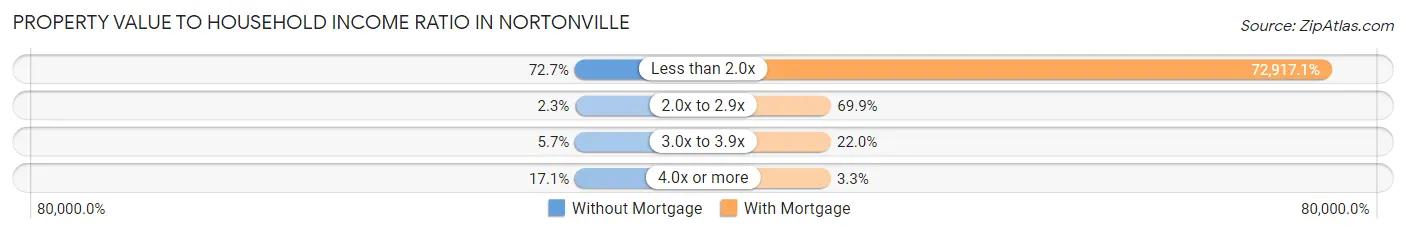
| Value-to-Income Ratio | Without Mortgage | With Mortgage |
| Less than 2.0x | 64 (72.7%) | 89,688 (72,917.1%) |
| 2.0x to 2.9x | 2 (2.3%) | 86 (69.9%) |
| 3.0x to 3.9x | 5 (5.7%) | 27 (22.0%) |
| 4.0x or more | 15 (17.1%) | 4 (3.3%) |
| Total | 88 (100.0%) | 123 (100.0%) |
Real Estate Taxes by Mortgage Status in Nortonville
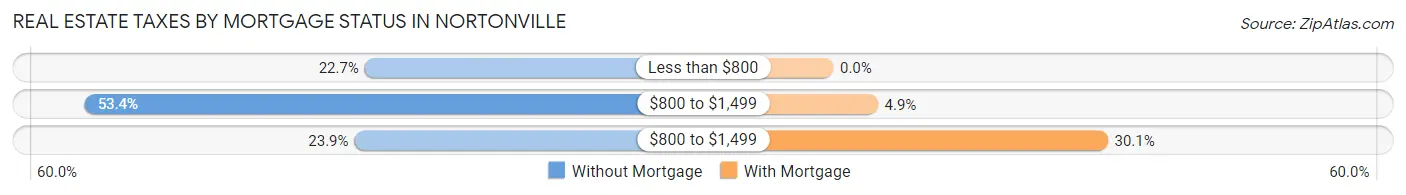
| Property Taxes | Without Mortgage | With Mortgage |
| Less than $800 | 20 (22.7%) | 0 (0.0%) |
| $800 to $1,499 | 47 (53.4%) | 6 (4.9%) |
| $800 to $1,499 | 21 (23.9%) | 37 (30.1%) |
| Total | 88 (100.0%) | 123 (100.0%) |
Health & Disability in Nortonville
Health Insurance Coverage by Age in Nortonville
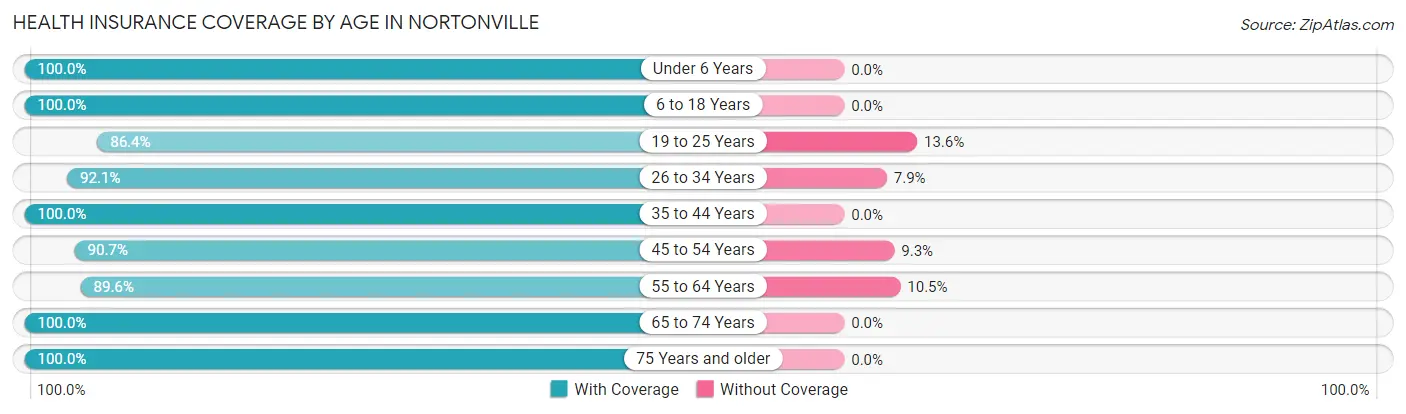
| Age Bracket | With Coverage | Without Coverage |
| Under 6 Years | 101 (100.0%) | 0 (0.0%) |
| 6 to 18 Years | 164 (100.0%) | 0 (0.0%) |
| 19 to 25 Years | 51 (86.4%) | 8 (13.6%) |
| 26 to 34 Years | 58 (92.1%) | 5 (7.9%) |
| 35 to 44 Years | 118 (100.0%) | 0 (0.0%) |
| 45 to 54 Years | 68 (90.7%) | 7 (9.3%) |
| 55 to 64 Years | 60 (89.5%) | 7 (10.4%) |
| 65 to 74 Years | 76 (100.0%) | 0 (0.0%) |
| 75 Years and older | 43 (100.0%) | 0 (0.0%) |
| Total | 739 (96.5%) | 27 (3.5%) |
Health Insurance Coverage by Citizenship Status in Nortonville
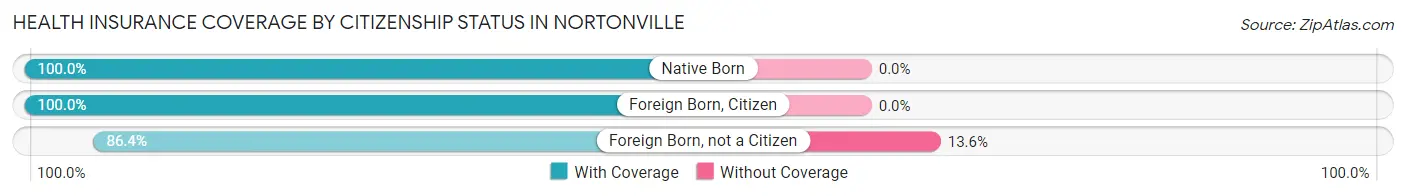
| Citizenship Status | With Coverage | Without Coverage |
| Native Born | 101 (100.0%) | 0 (0.0%) |
| Foreign Born, Citizen | 164 (100.0%) | 0 (0.0%) |
| Foreign Born, not a Citizen | 51 (86.4%) | 8 (13.6%) |
Health Insurance Coverage by Household Income in Nortonville
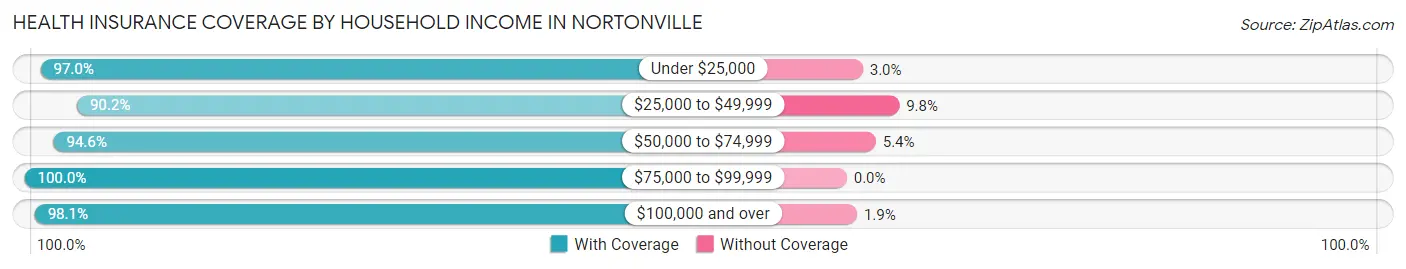
| Household Income | With Coverage | Without Coverage |
| Under $25,000 | 97 (97.0%) | 3 (3.0%) |
| $25,000 to $49,999 | 101 (90.2%) | 11 (9.8%) |
| $50,000 to $74,999 | 122 (94.6%) | 7 (5.4%) |
| $75,000 to $99,999 | 111 (100.0%) | 0 (0.0%) |
| $100,000 and over | 308 (98.1%) | 6 (1.9%) |
Public vs Private Health Insurance Coverage by Age in Nortonville
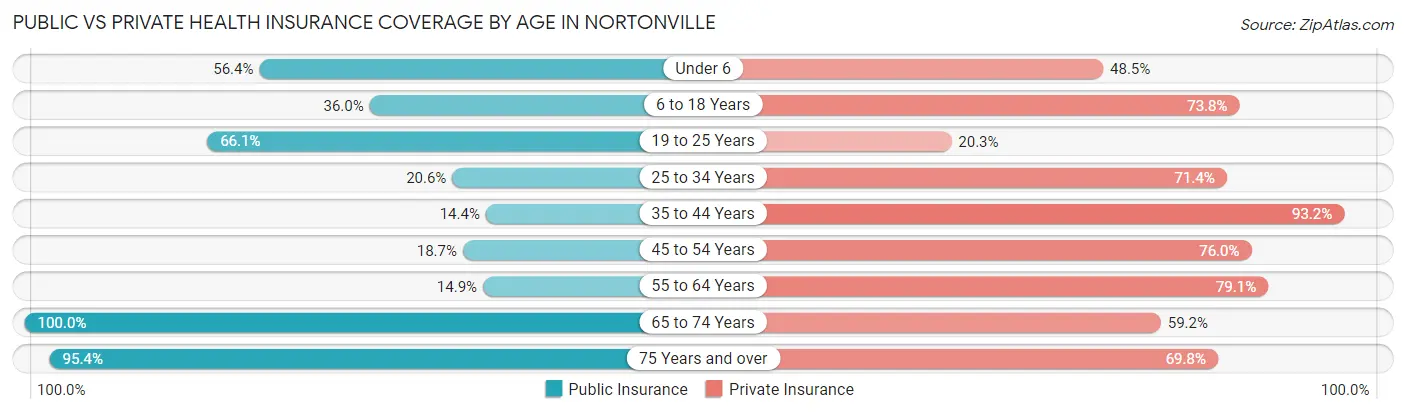
| Age Bracket | Public Insurance | Private Insurance |
| Under 6 | 57 (56.4%) | 49 (48.5%) |
| 6 to 18 Years | 59 (36.0%) | 121 (73.8%) |
| 19 to 25 Years | 39 (66.1%) | 12 (20.3%) |
| 25 to 34 Years | 13 (20.6%) | 45 (71.4%) |
| 35 to 44 Years | 17 (14.4%) | 110 (93.2%) |
| 45 to 54 Years | 14 (18.7%) | 57 (76.0%) |
| 55 to 64 Years | 10 (14.9%) | 53 (79.1%) |
| 65 to 74 Years | 76 (100.0%) | 45 (59.2%) |
| 75 Years and over | 41 (95.4%) | 30 (69.8%) |
| Total | 326 (42.6%) | 522 (68.1%) |
Disability Status by Sex by Age in Nortonville
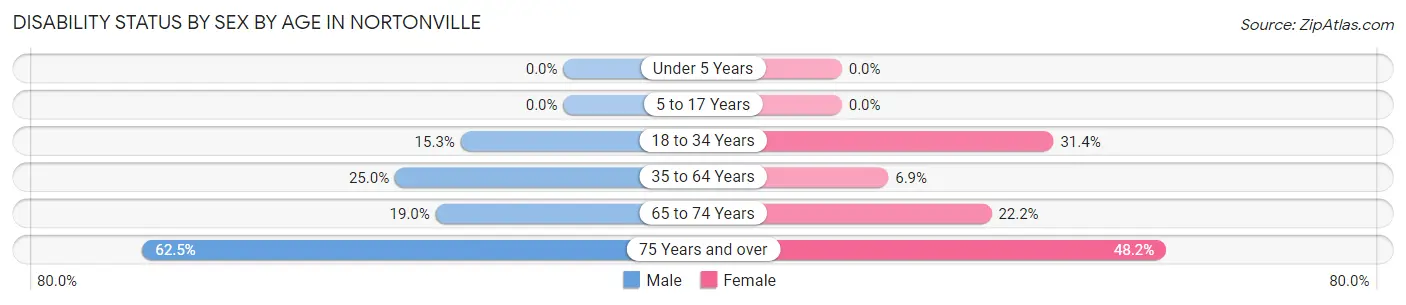
| Age Bracket | Male | Female |
| Under 5 Years | 0 (0.0%) | 0 (0.0%) |
| 5 to 17 Years | 0 (0.0%) | 0 (0.0%) |
| 18 to 34 Years | 9 (15.2%) | 22 (31.4%) |
| 35 to 64 Years | 36 (25.0%) | 8 (6.9%) |
| 65 to 74 Years | 11 (19.0%) | 4 (22.2%) |
| 75 Years and over | 10 (62.5%) | 13 (48.1%) |
Disability Class by Sex by Age in Nortonville
Disability Class: Hearing Difficulty
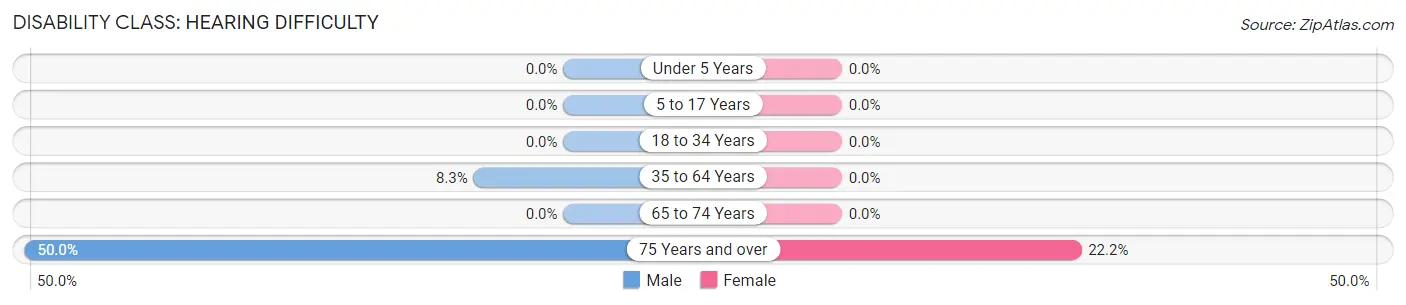
| Age Bracket | Male | Female |
| Under 5 Years | 0 (0.0%) | 0 (0.0%) |
| 5 to 17 Years | 0 (0.0%) | 0 (0.0%) |
| 18 to 34 Years | 0 (0.0%) | 0 (0.0%) |
| 35 to 64 Years | 12 (8.3%) | 0 (0.0%) |
| 65 to 74 Years | 0 (0.0%) | 0 (0.0%) |
| 75 Years and over | 8 (50.0%) | 6 (22.2%) |
Disability Class: Vision Difficulty
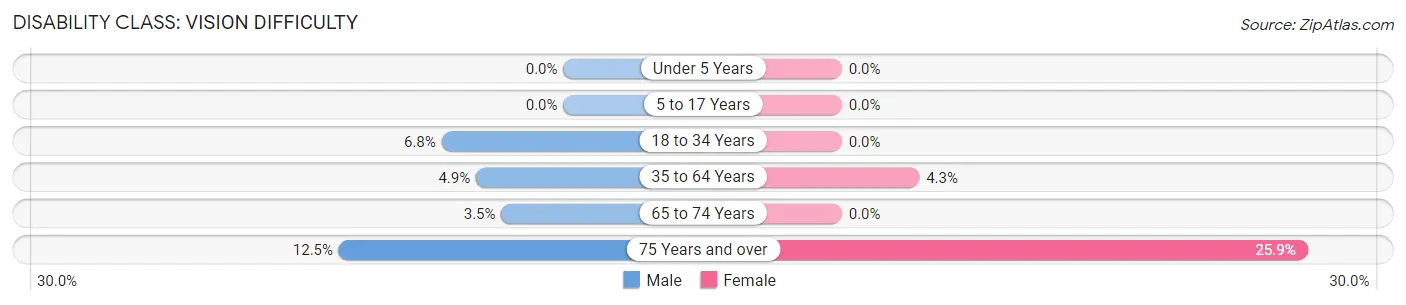
| Age Bracket | Male | Female |
| Under 5 Years | 0 (0.0%) | 0 (0.0%) |
| 5 to 17 Years | 0 (0.0%) | 0 (0.0%) |
| 18 to 34 Years | 4 (6.8%) | 0 (0.0%) |
| 35 to 64 Years | 7 (4.9%) | 5 (4.3%) |
| 65 to 74 Years | 2 (3.5%) | 0 (0.0%) |
| 75 Years and over | 2 (12.5%) | 7 (25.9%) |
Disability Class: Cognitive Difficulty
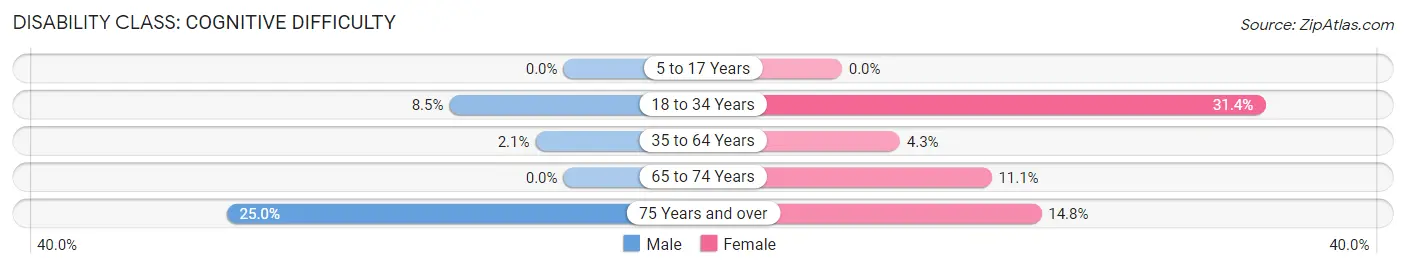
| Age Bracket | Male | Female |
| 5 to 17 Years | 0 (0.0%) | 0 (0.0%) |
| 18 to 34 Years | 5 (8.5%) | 22 (31.4%) |
| 35 to 64 Years | 3 (2.1%) | 5 (4.3%) |
| 65 to 74 Years | 0 (0.0%) | 2 (11.1%) |
| 75 Years and over | 4 (25.0%) | 4 (14.8%) |
Disability Class: Ambulatory Difficulty
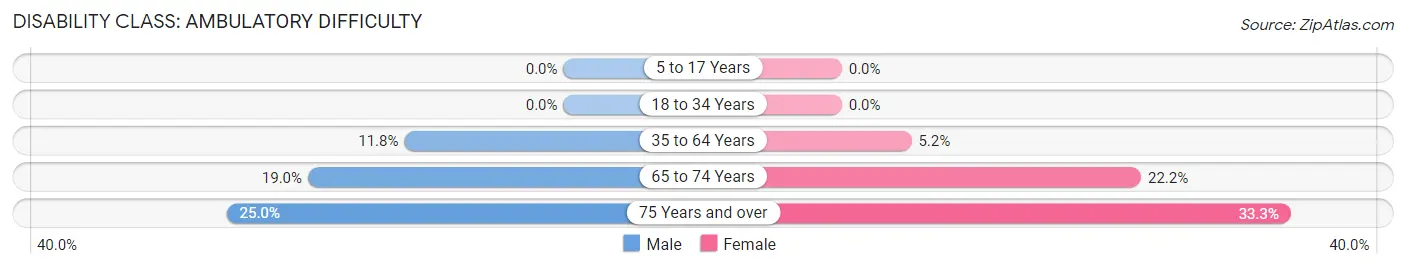
| Age Bracket | Male | Female |
| 5 to 17 Years | 0 (0.0%) | 0 (0.0%) |
| 18 to 34 Years | 0 (0.0%) | 0 (0.0%) |
| 35 to 64 Years | 17 (11.8%) | 6 (5.2%) |
| 65 to 74 Years | 11 (19.0%) | 4 (22.2%) |
| 75 Years and over | 4 (25.0%) | 9 (33.3%) |
Disability Class: Self-Care Difficulty
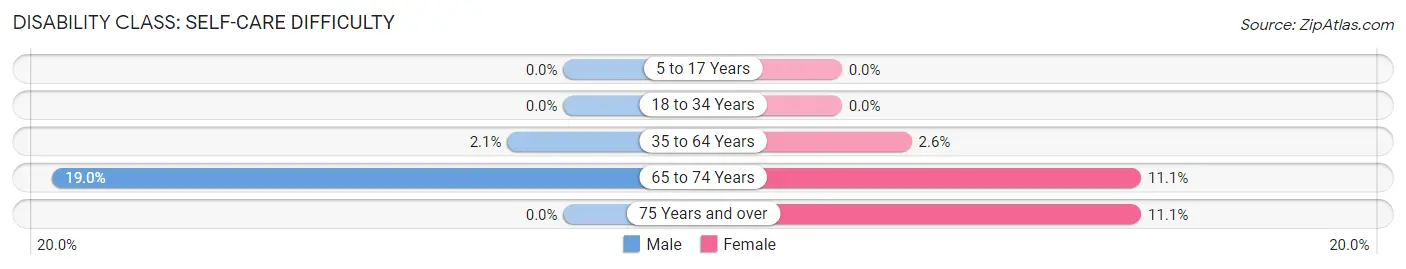
| Age Bracket | Male | Female |
| 5 to 17 Years | 0 (0.0%) | 0 (0.0%) |
| 18 to 34 Years | 0 (0.0%) | 0 (0.0%) |
| 35 to 64 Years | 3 (2.1%) | 3 (2.6%) |
| 65 to 74 Years | 11 (19.0%) | 2 (11.1%) |
| 75 Years and over | 0 (0.0%) | 3 (11.1%) |
Technology Access in Nortonville
Computing Device Access in Nortonville
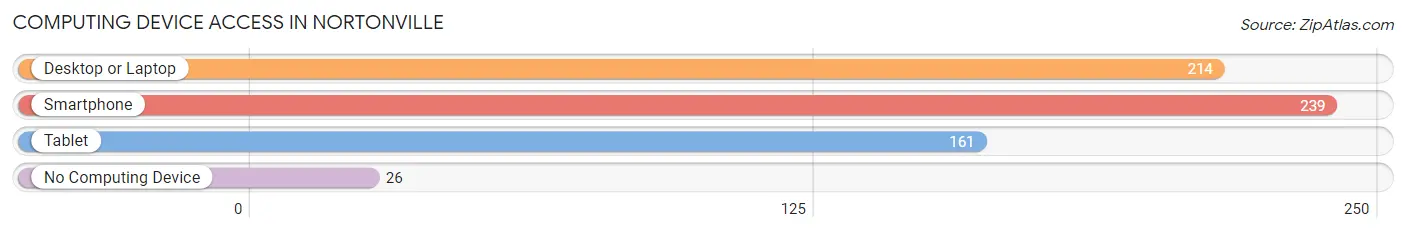
| Device Type | # Households | % Households |
| Desktop or Laptop | 214 | 76.4% |
| Smartphone | 239 | 85.4% |
| Tablet | 161 | 57.5% |
| No Computing Device | 26 | 9.3% |
| Total | 280 | 100.0% |
Internet Access in Nortonville
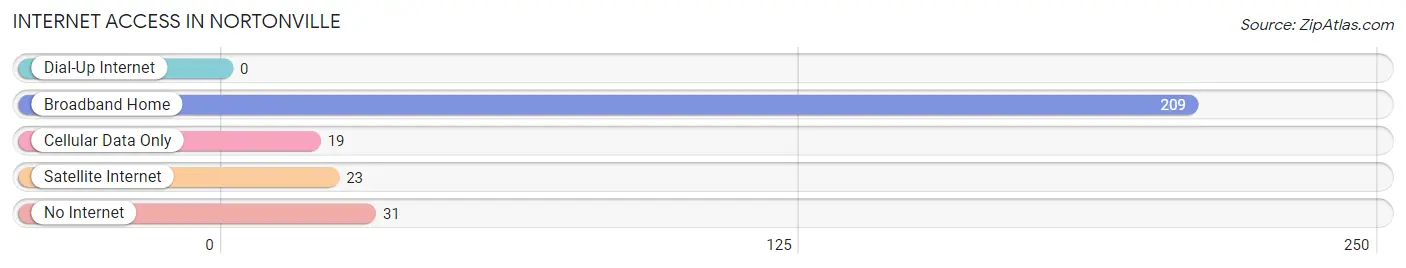
| Internet Type | # Households | % Households |
| Dial-Up Internet | 0 | 0.0% |
| Broadband Home | 209 | 74.6% |
| Cellular Data Only | 19 | 6.8% |
| Satellite Internet | 23 | 8.2% |
| No Internet | 31 | 11.1% |
| Total | 280 | 100.0% |
Nortonville Summary
Nortonville, Kansas is a small town located in Jefferson County, Kansas. It is situated on the banks of the Missouri River, approximately 25 miles south of Topeka. The population of Nortonville was estimated to be 545 in 2020.
History
Nortonville was founded in 1854 by William Norton, a settler from Ohio. He named the town after himself and it quickly became a thriving community. The town was incorporated in 1857 and soon became a major stop on the Santa Fe Trail. In the late 1800s, Nortonville was a major shipping point for grain, livestock, and other goods.
The town was also home to a number of businesses, including a flour mill, a sawmill, a blacksmith shop, and a hotel. In the early 1900s, Nortonville was a popular destination for tourists, who came to enjoy the town’s natural beauty and its many recreational activities.
Geography
Nortonville is located in the rolling hills of eastern Kansas. The town is situated on the banks of the Missouri River, approximately 25 miles south of Topeka. The town is surrounded by farmland and is bordered by the cities of Oskaloosa and Valley Falls.
The climate in Nortonville is typical of the Midwest, with hot summers and cold winters. The average temperature in July is 82°F and the average temperature in January is 28°F. The town receives an average of 36 inches of precipitation per year.
Economy
Nortonville’s economy is largely based on agriculture. The town is home to several farms, which produce corn, soybeans, wheat, and other crops. The town is also home to a number of small businesses, including a grocery store, a hardware store, and a restaurant.
Demographics
Nortonville is a predominantly white town, with a population that is 97.3% white and 2.7% other. The median household income in Nortonville is $45,000, and the median age is 44. The town has a low unemployment rate of 3.2%.
Conclusion
Nortonville, Kansas is a small town located in Jefferson County, Kansas. It is situated on the banks of the Missouri River, approximately 25 miles south of Topeka. The town was founded in 1854 and has a population of 545. The town’s economy is largely based on agriculture, and it is home to several small businesses. The town is predominantly white, with a median household income of $45,000 and a median age of 44.
Common Questions
What is Per Capita Income in Nortonville?
Per Capita income in Nortonville is $26,197.
What is the Median Family Income in Nortonville?
Median Family Income in Nortonville is $75,455.
What is the Median Household income in Nortonville?
Median Household Income in Nortonville is $66,786.
What is Income or Wage Gap in Nortonville?
Income or Wage Gap in Nortonville is 19.6%.
Women in Nortonville earn 80.4 cents for every dollar earned by a man.
What is Inequality or Gini Index in Nortonville?
Inequality or Gini Index in Nortonville is 0.35.
What is the Total Population of Nortonville?
Total Population of Nortonville is 794.
What is the Total Male Population of Nortonville?
Total Male Population of Nortonville is 412.
What is the Total Female Population of Nortonville?
Total Female Population of Nortonville is 382.
What is the Ratio of Males per 100 Females in Nortonville?
There are 107.85 Males per 100 Females in Nortonville.
What is the Ratio of Females per 100 Males in Nortonville?
There are 92.72 Females per 100 Males in Nortonville.
What is the Median Population Age in Nortonville?
Median Population Age in Nortonville is 35.9 Years.
What is the Average Family Size in Nortonville
Average Family Size in Nortonville is 3.1 People.
What is the Average Household Size in Nortonville
Average Household Size in Nortonville is 2.7 People.
How Large is the Labor Force in Nortonville?
There are 343 People in the Labor Forcein in Nortonville.
What is the Percentage of People in the Labor Force in Nortonville?
61.7% of People are in the Labor Force in Nortonville.
What is the Unemployment Rate in Nortonville?
Unemployment Rate in Nortonville is 0.9%.