Zip Codes with the Highest Percentage of Population Employed in Agriculture, Fishing & Hunting in Mission, KS
RELATED REPORTS & OPTIONS
Select to Compare
Select to Compare
Compare Zip Codes
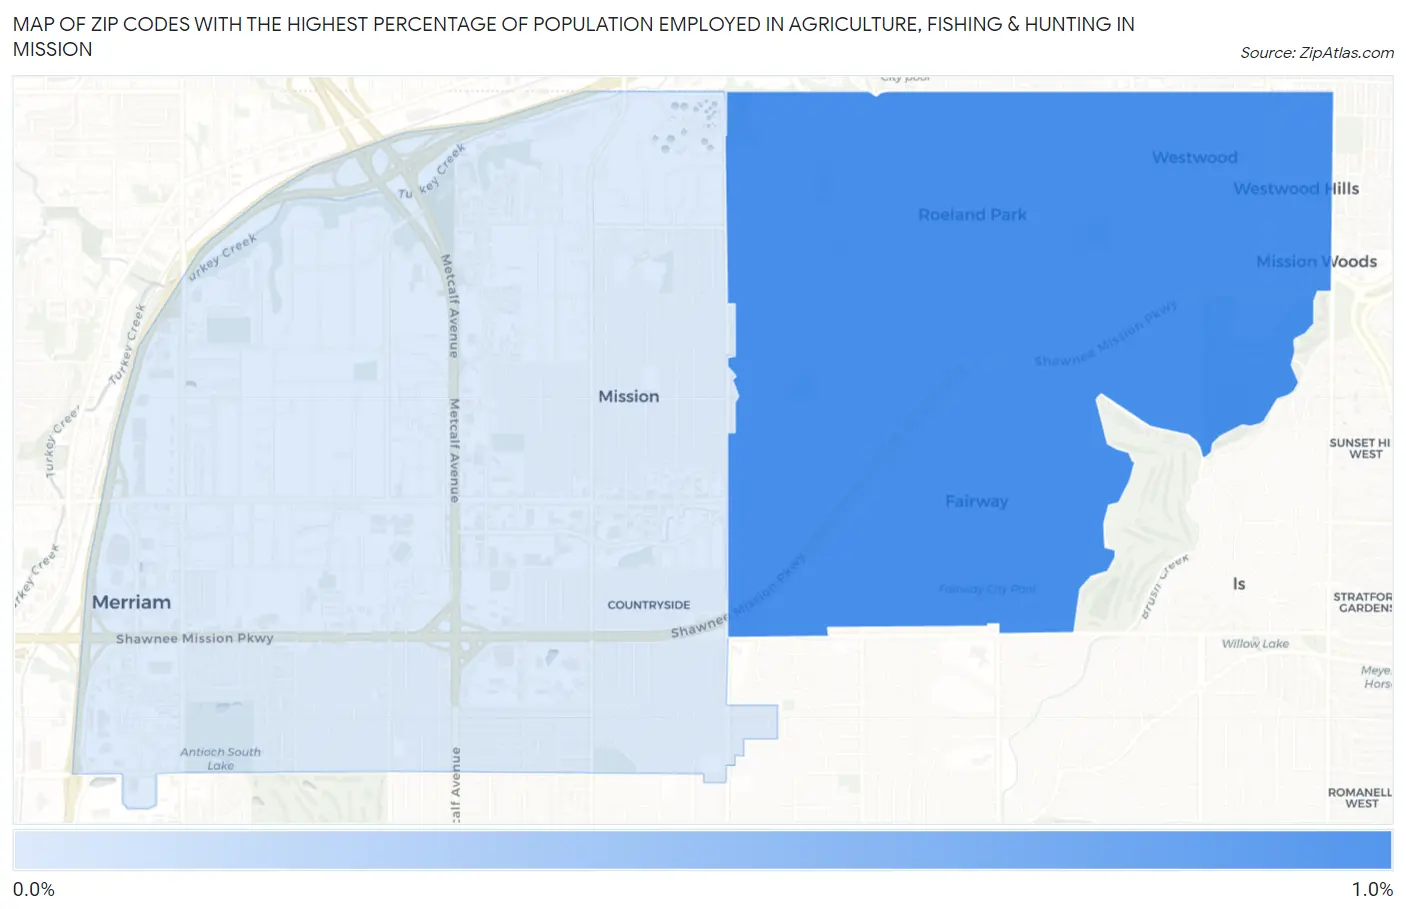
Map of Zip Codes with the Highest Percentage of Population Employed in Agriculture, Fishing & Hunting in Mission
0.0%
0.40%
Zip Codes with the Highest Percentage of Population Employed in Agriculture, Fishing & Hunting in Mission, KS
| Zip Code | % Employed | vs State | vs National | |
| 1. | 66205 | 0.38% | 2.6%(-2.21)#586 | 1.2%(-0.820)#20,338 |
1
Common Questions
What are the Top Zip Codes with the Highest Percentage of Population Employed in Agriculture, Fishing & Hunting in Mission, KS?
Top Zip Codes with the Highest Percentage of Population Employed in Agriculture, Fishing & Hunting in Mission, KS are:
What zip code has the Highest Percentage of Population Employed in Agriculture, Fishing & Hunting in Mission, KS?
66205 has the Highest Percentage of Population Employed in Agriculture, Fishing & Hunting in Mission, KS with 0.38%.
What is the Percentage of Population Employed in Agriculture, Fishing & Hunting in Mission, KS?
Percentage of Population Employed in Agriculture, Fishing & Hunting in Mission is 0.18%.
What is the Percentage of Population Employed in Agriculture, Fishing & Hunting in Kansas?
Percentage of Population Employed in Agriculture, Fishing & Hunting in Kansas is 2.6%.
What is the Percentage of Population Employed in Agriculture, Fishing & Hunting in the United States?
Percentage of Population Employed in Agriculture, Fishing & Hunting in the United States is 1.2%.