Zip Codes with the Highest Percentage of Households Residing in Detached Homes in Mission, KS
RELATED REPORTS & OPTIONS
Detached Home Residency
Mission
Compare Zip Codes
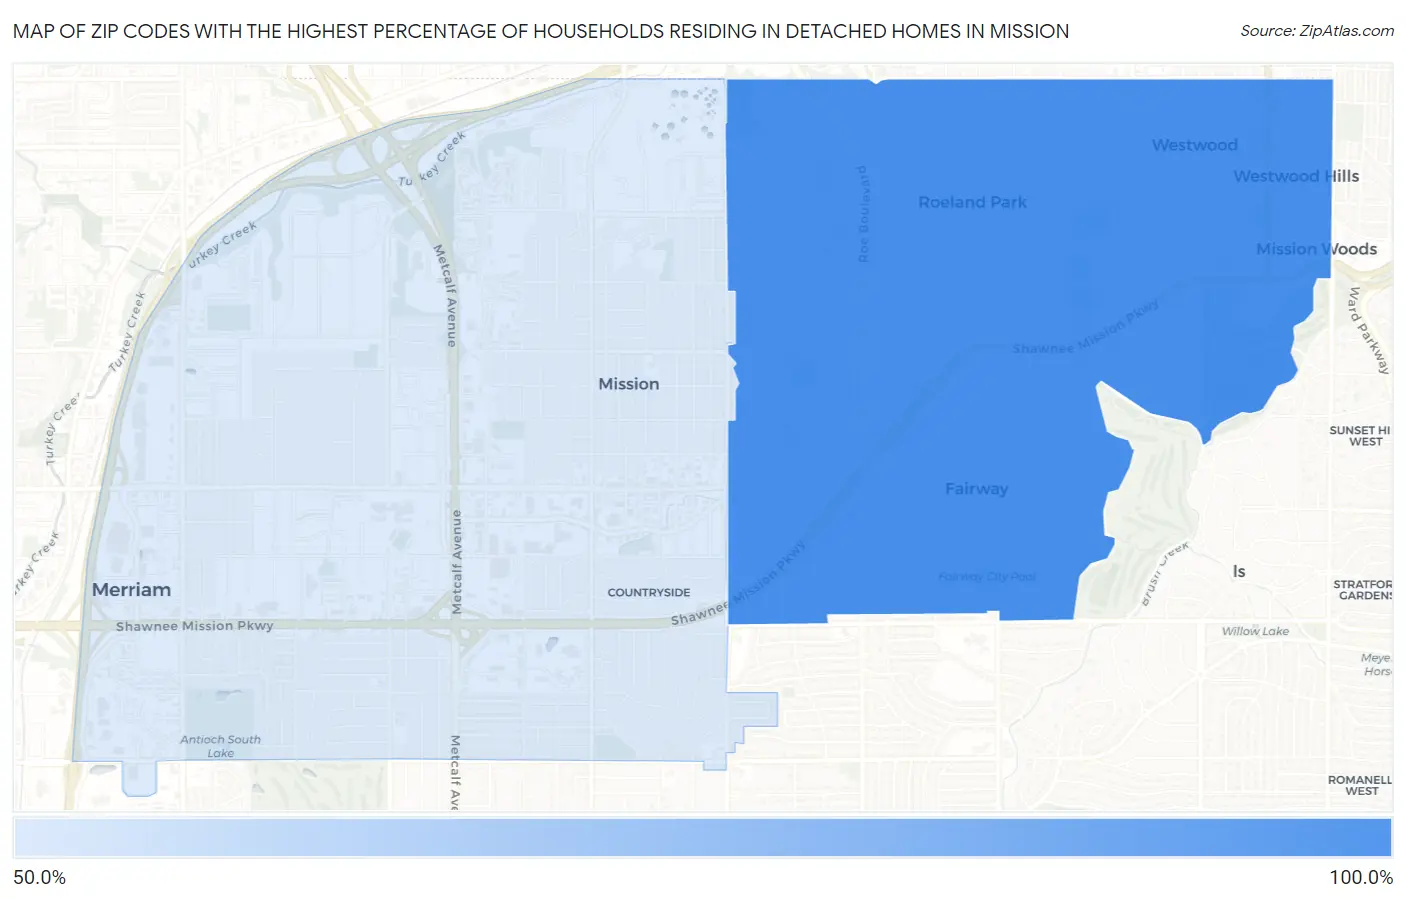
Map of Zip Codes with the Highest Percentage of Households Residing in Detached Homes in Mission
54.6%
91.6%
Zip Codes with the Highest Percentage of Households Residing in Detached Homes in Mission, KS
| Zip Code | Detached Home Residency | vs State | vs National | |
| 1. | 66205 | 91.6% | 73.4%(+18.2)#223 | 62.5%(+29.1)#5,554 |
| 2. | 66202 | 54.6% | 73.4%(-18.8)#666 | 62.5%(-7.90)#28,176 |
1
Common Questions
What are the Top Zip Codes with the Highest Percentage of Households Residing in Detached Homes in Mission, KS?
Top Zip Codes with the Highest Percentage of Households Residing in Detached Homes in Mission, KS are:
What zip code has the Highest Percentage of Households Residing in Detached Homes in Mission, KS?
66205 has the Highest Percentage of Households Residing in Detached Homes in Mission, KS with 91.6%.
What is the Percentage of Households Residing in Detached Homes in Mission, KS?
Percentage of Households Residing in Detached Homes in Mission is 49.8%.
What is the Percentage of Households Residing in Detached Homes in Kansas?
Percentage of Households Residing in Detached Homes in Kansas is 73.4%.
What is the Percentage of Households Residing in Detached Homes in the United States?
Percentage of Households Residing in Detached Homes in the United States is 62.5%.