Linwood, KS Map & Demographics
Linwood Map
Linwood Overview
$33,769
PER CAPITA INCOME
$63,250
AVG FAMILY INCOME
$61,211
AVG HOUSEHOLD INCOME
15.7%
WAGE / INCOME GAP [ % ]
84.3¢/ $1
WAGE / INCOME GAP [ $ ]
0.39
INEQUALITY / GINI INDEX
361
TOTAL POPULATION
165
MALE POPULATION
196
FEMALE POPULATION
84.18
MALES / 100 FEMALES
118.79
FEMALES / 100 MALES
29.2
MEDIAN AGE
2.7
AVG FAMILY SIZE
2.3
AVG HOUSEHOLD SIZE
211
LABOR FORCE [ PEOPLE ]
76.4%
PERCENT IN LABOR FORCE
5.3%
UNEMPLOYMENT RATE
Linwood Zip Codes
Linwood Area Codes
Income in Linwood
Income Overview in Linwood
Per Capita Income in Linwood is $33,769, while median incomes of families and households are $63,250 and $61,211 respectively.
| Characteristic | Number | Measure |
| Per Capita Income | 361 | $33,769 |
| Median Family Income | 109 | $63,250 |
| Mean Family Income | 109 | $93,625 |
| Median Household Income | 155 | $61,211 |
| Mean Household Income | 155 | $79,465 |
| Income Deficit | 109 | $0 |
| Wage / Income Gap (%) | 361 | 15.70% |
| Wage / Income Gap ($) | 361 | 84.30¢ per $1 |
| Gini / Inequality Index | 361 | 0.39 |
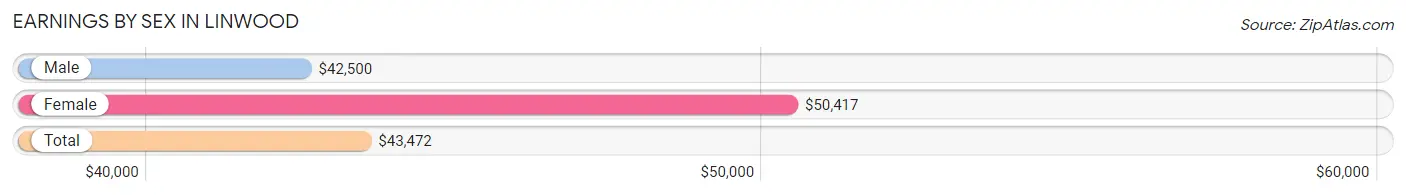
Earnings by Sex in Linwood
Average Earnings in Linwood are $43,472, $42,500 for men and $50,417 for women, a difference of 15.7%.
| Sex | Number | Average Earnings |
| Male | 106 (50.2%) | $42,500 |
| Female | 105 (49.8%) | $50,417 |
| Total | 211 (100.0%) | $43,472 |
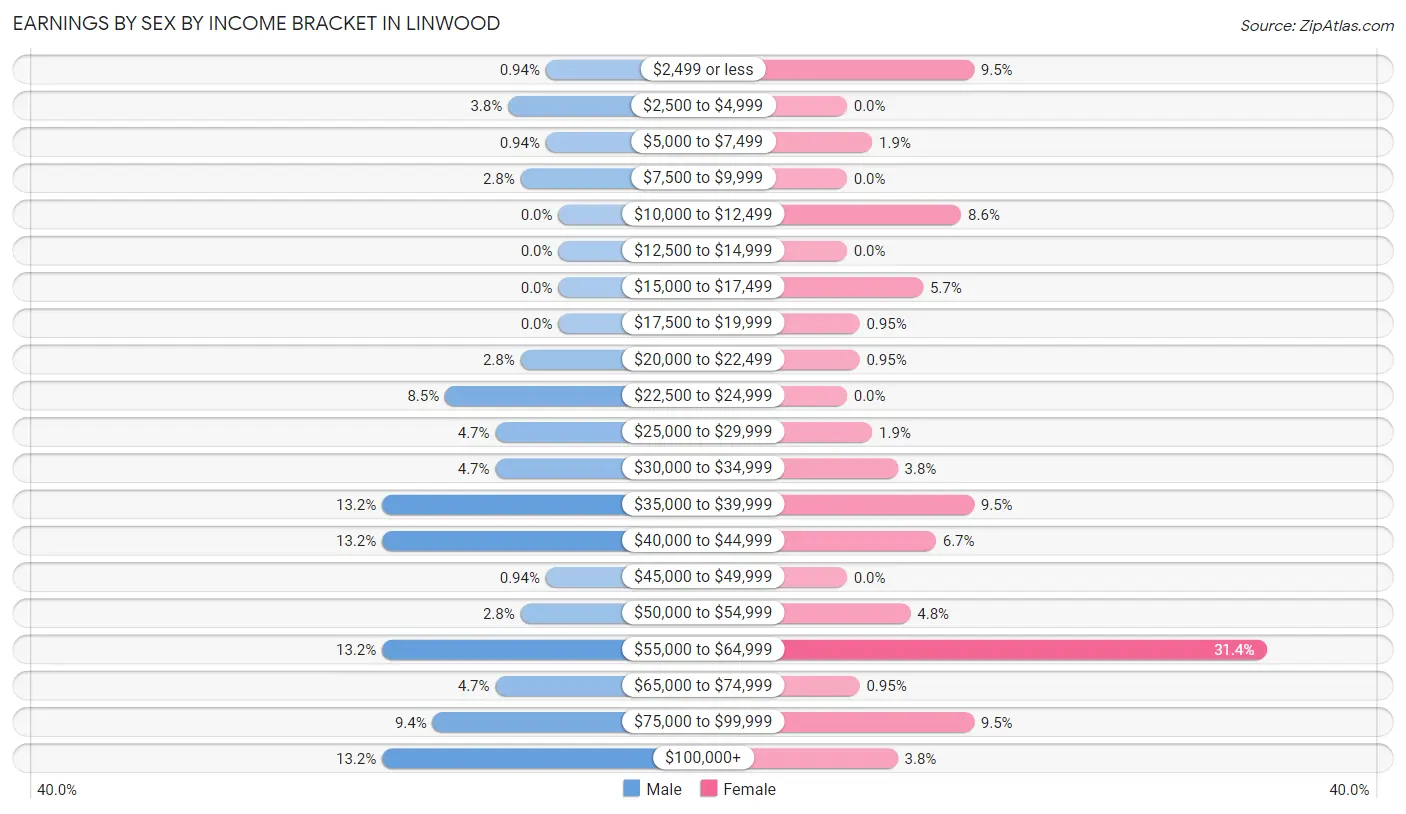
Earnings by Sex by Income Bracket in Linwood
The most common earnings brackets in Linwood are $35,000 to $39,999 for men (14 | 13.2%) and $55,000 to $64,999 for women (33 | 31.4%).
| Income | Male | Female |
| $2,499 or less | 1 (0.9%) | 10 (9.5%) |
| $2,500 to $4,999 | 4 (3.8%) | 0 (0.0%) |
| $5,000 to $7,499 | 1 (0.9%) | 2 (1.9%) |
| $7,500 to $9,999 | 3 (2.8%) | 0 (0.0%) |
| $10,000 to $12,499 | 0 (0.0%) | 9 (8.6%) |
| $12,500 to $14,999 | 0 (0.0%) | 0 (0.0%) |
| $15,000 to $17,499 | 0 (0.0%) | 6 (5.7%) |
| $17,500 to $19,999 | 0 (0.0%) | 1 (0.9%) |
| $20,000 to $22,499 | 3 (2.8%) | 1 (0.9%) |
| $22,500 to $24,999 | 9 (8.5%) | 0 (0.0%) |
| $25,000 to $29,999 | 5 (4.7%) | 2 (1.9%) |
| $30,000 to $34,999 | 5 (4.7%) | 4 (3.8%) |
| $35,000 to $39,999 | 14 (13.2%) | 10 (9.5%) |
| $40,000 to $44,999 | 14 (13.2%) | 7 (6.7%) |
| $45,000 to $49,999 | 1 (0.9%) | 0 (0.0%) |
| $50,000 to $54,999 | 3 (2.8%) | 5 (4.8%) |
| $55,000 to $64,999 | 14 (13.2%) | 33 (31.4%) |
| $65,000 to $74,999 | 5 (4.7%) | 1 (0.9%) |
| $75,000 to $99,999 | 10 (9.4%) | 10 (9.5%) |
| $100,000+ | 14 (13.2%) | 4 (3.8%) |
| Total | 106 (100.0%) | 105 (100.0%) |
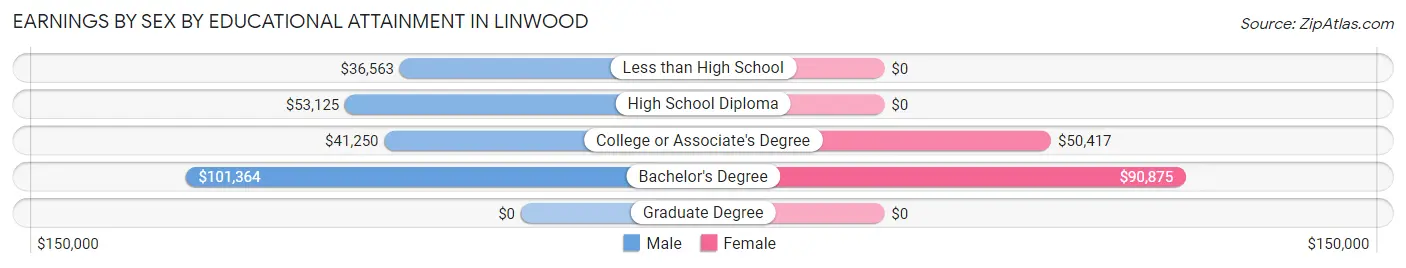
Earnings by Sex by Educational Attainment in Linwood
Average earnings in Linwood are $44,792 for men and $37,321 for women, a difference of 16.7%. Men with an educational attainment of bachelor's degree enjoy the highest average annual earnings of $101,364, while those with less than high school education earn the least with $36,563. Women with an educational attainment of bachelor's degree earn the most with the average annual earnings of $90,875, while those with college or associate's degree education have the smallest earnings of $50,417.
| Educational Attainment | Male Income | Female Income |
| Less than High School | $36,563 | $0 |
| High School Diploma | $53,125 | $0 |
| College or Associate's Degree | $41,250 | $50,417 |
| Bachelor's Degree | $101,364 | $90,875 |
| Graduate Degree | - | - |
| Total | $44,792 | $37,321 |
Family Income in Linwood
Family Income Brackets in Linwood
According to the Linwood family income data, there are 43 families falling into the $50,000 to $74,999 income range, which is the most common income bracket and makes up 39.5% of all families.
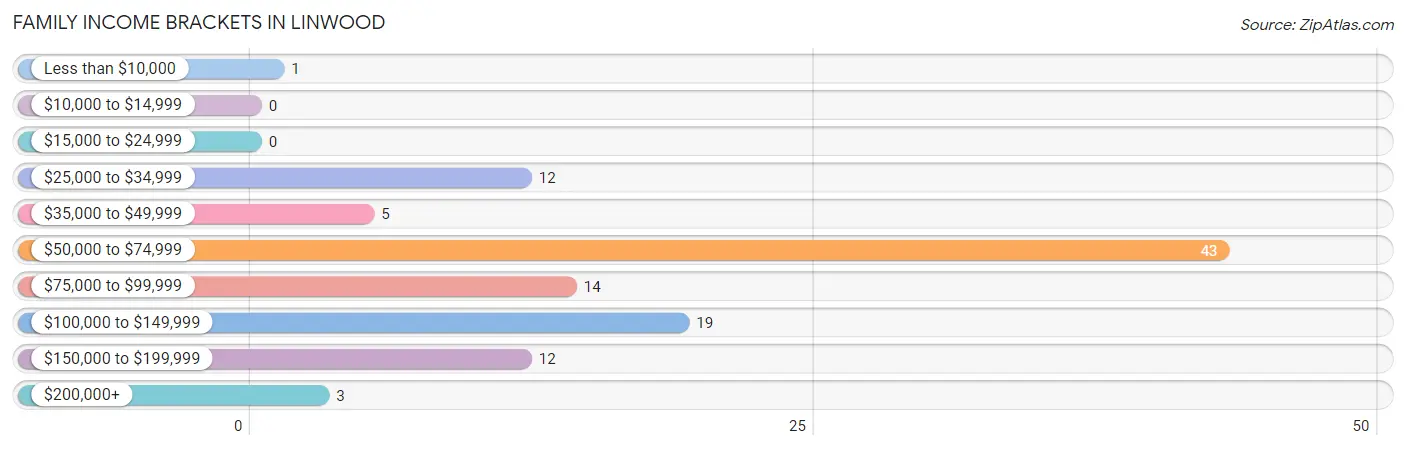
| Income Bracket | # Families | % Families |
| Less than $10,000 | 1 | 0.9% |
| $10,000 to $14,999 | 0 | 0.0% |
| $15,000 to $24,999 | 0 | 0.0% |
| $25,000 to $34,999 | 12 | 11.0% |
| $35,000 to $49,999 | 5 | 4.6% |
| $50,000 to $74,999 | 43 | 39.4% |
| $75,000 to $99,999 | 14 | 12.8% |
| $100,000 to $149,999 | 19 | 17.4% |
| $150,000 to $199,999 | 12 | 11.0% |
| $200,000+ | 3 | 2.8% |
Family Income by Famaliy Size in Linwood
5-person families (16 | 14.7%) account for the highest median family income in Linwood with $105,833 per family, while 2-person families (56 | 51.4%) have the highest median income of $30,625 per family member.
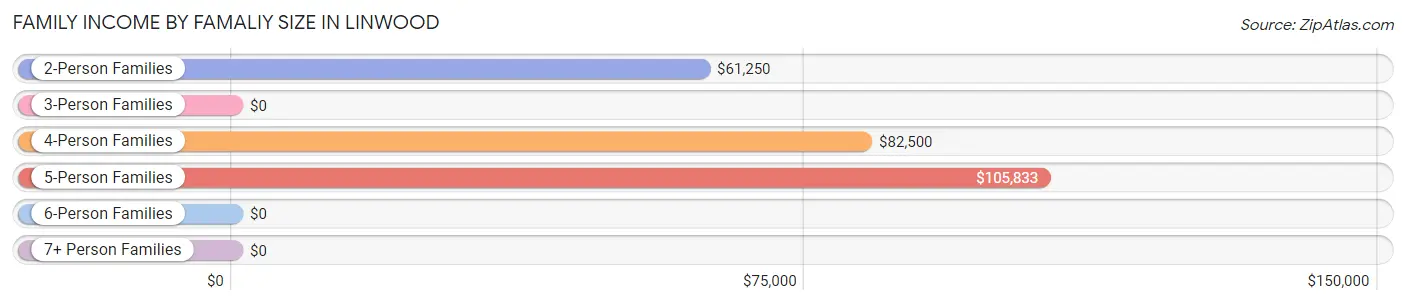
| Income Bracket | # Families | Median Income |
| 2-Person Families | 56 (51.4%) | $61,250 |
| 3-Person Families | 25 (22.9%) | $0 |
| 4-Person Families | 10 (9.2%) | $82,500 |
| 5-Person Families | 16 (14.7%) | $105,833 |
| 6-Person Families | 2 (1.8%) | $0 |
| 7+ Person Families | 0 (0.0%) | $0 |
| Total | 109 (100.0%) | $63,250 |
Family Income by Number of Earners in Linwood
The median family income in Linwood is $63,250, with families comprising 2 earners (42) having the highest median family income of $126,000, while families with no earners (7) have the lowest median family income of $53,125, accounting for 38.5% and 6.4% of families, respectively.
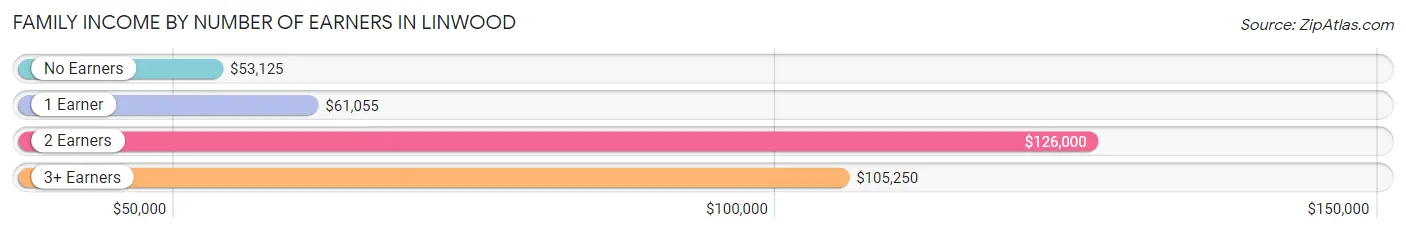
| Number of Earners | # Families | Median Income |
| No Earners | 7 (6.4%) | $53,125 |
| 1 Earner | 51 (46.8%) | $61,055 |
| 2 Earners | 42 (38.5%) | $126,000 |
| 3+ Earners | 9 (8.3%) | $105,250 |
| Total | 109 (100.0%) | $63,250 |
Household Income in Linwood
Household Income Brackets in Linwood
With 48 households falling in the category, the $50,000 to $74,999 income range is the most frequent in Linwood, accounting for 31.0% of all households.
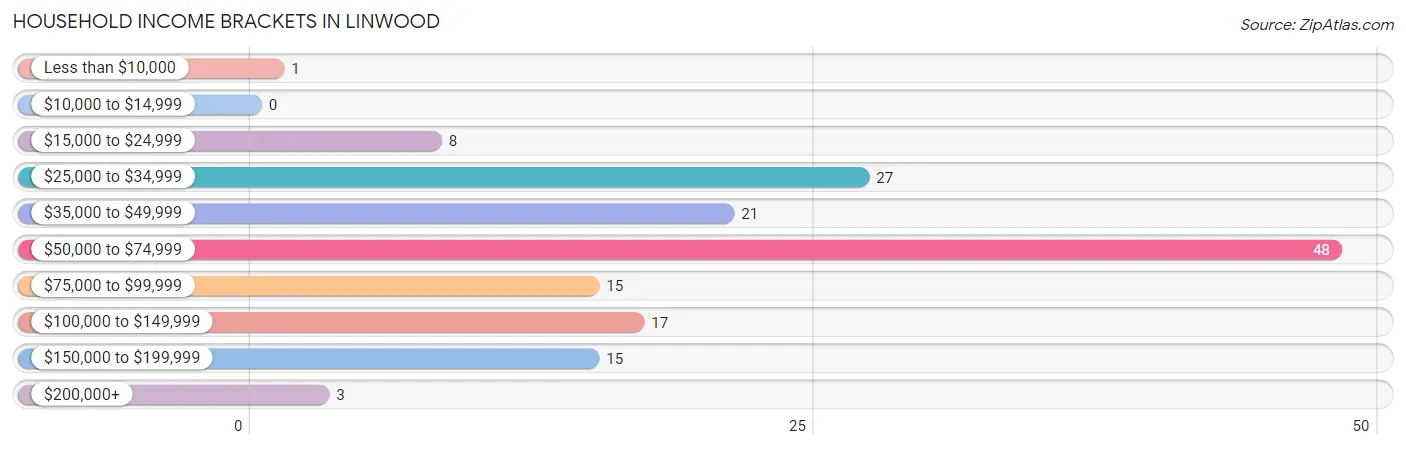
| Income Bracket | # Households | % Households |
| Less than $10,000 | 1 | 0.6% |
| $10,000 to $14,999 | 0 | 0.0% |
| $15,000 to $24,999 | 8 | 5.2% |
| $25,000 to $34,999 | 27 | 17.4% |
| $35,000 to $49,999 | 21 | 13.5% |
| $50,000 to $74,999 | 48 | 31.0% |
| $75,000 to $99,999 | 15 | 9.7% |
| $100,000 to $149,999 | 17 | 11.0% |
| $150,000 to $199,999 | 15 | 9.7% |
| $200,000+ | 3 | 1.9% |
Household Income by Householder Age in Linwood
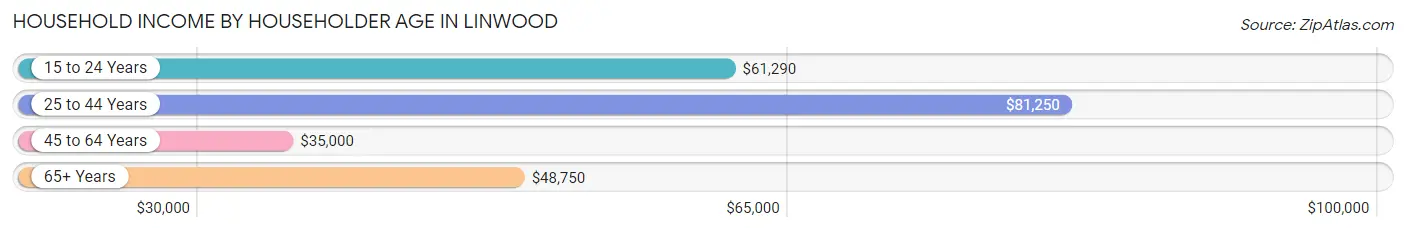
The median household income in Linwood is $61,211, with the highest median household income of $81,250 found in the 25 to 44 years age bracket for the primary householder. A total of 64 households (41.3%) fall into this category. Meanwhile, the 45 to 64 years age bracket for the primary householder has the lowest median household income of $35,000, with 32 households (20.6%) in this group.
| Income Bracket | # Households | Median Income |
| 15 to 24 Years | 38 (24.5%) | $61,290 |
| 25 to 44 Years | 64 (41.3%) | $81,250 |
| 45 to 64 Years | 32 (20.6%) | $35,000 |
| 65+ Years | 21 (13.6%) | $48,750 |
| Total | 155 (100.0%) | $61,211 |
Poverty in Linwood
Income Below Poverty by Sex and Age in Linwood
With 6.1% poverty level for males and 7.6% for females among the residents of Linwood, 12 to 14 year old males and 45 to 54 year old females are the most vulnerable to poverty, with 2 males (33.3%) and 2 females (22.2%) in their respective age groups living below the poverty level.
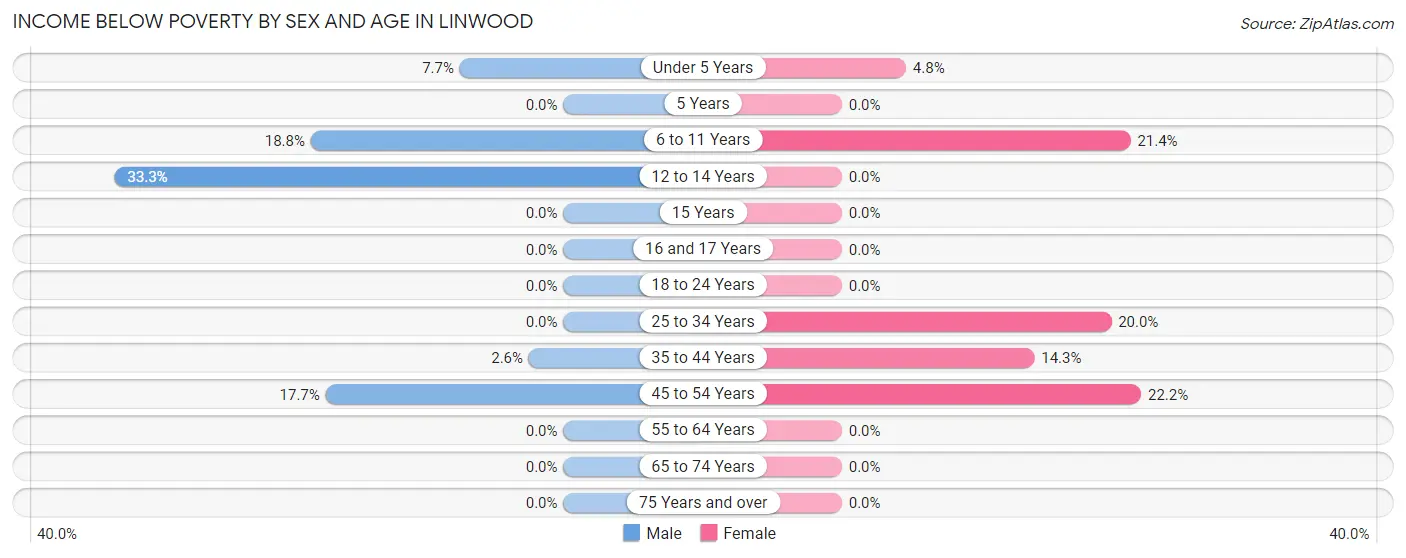
| Age Bracket | Male | Female |
| Under 5 Years | 1 (7.7%) | 1 (4.8%) |
| 5 Years | 0 (0.0%) | 0 (0.0%) |
| 6 to 11 Years | 3 (18.8%) | 3 (21.4%) |
| 12 to 14 Years | 2 (33.3%) | 0 (0.0%) |
| 15 Years | 0 (0.0%) | 0 (0.0%) |
| 16 and 17 Years | 0 (0.0%) | 0 (0.0%) |
| 18 to 24 Years | 0 (0.0%) | 0 (0.0%) |
| 25 to 34 Years | 0 (0.0%) | 6 (20.0%) |
| 35 to 44 Years | 1 (2.6%) | 3 (14.3%) |
| 45 to 54 Years | 3 (17.6%) | 2 (22.2%) |
| 55 to 64 Years | 0 (0.0%) | 0 (0.0%) |
| 65 to 74 Years | 0 (0.0%) | 0 (0.0%) |
| 75 Years and over | 0 (0.0%) | 0 (0.0%) |
| Total | 10 (6.1%) | 15 (7.6%) |
Income Above Poverty by Sex and Age in Linwood
According to the poverty statistics in Linwood, males aged 16 and 17 years and females aged 12 to 14 years are the age groups that are most secure financially, with 100.0% of males and 100.0% of females in these age groups living above the poverty line.
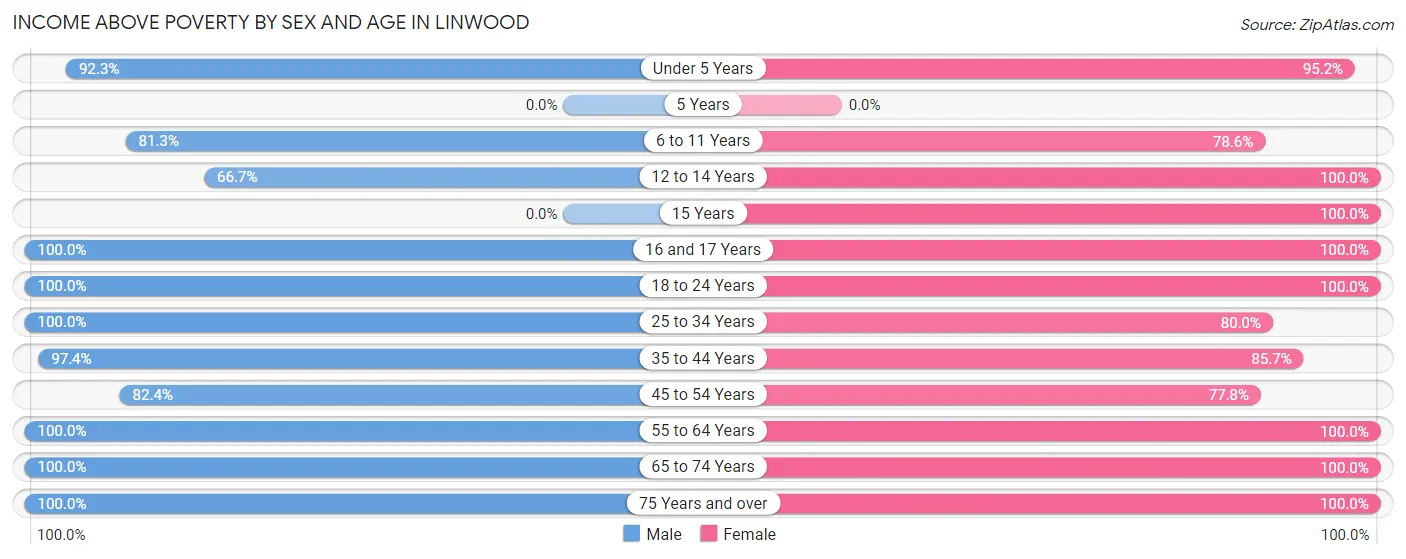
| Age Bracket | Male | Female |
| Under 5 Years | 12 (92.3%) | 20 (95.2%) |
| 5 Years | 0 (0.0%) | 0 (0.0%) |
| 6 to 11 Years | 13 (81.2%) | 11 (78.6%) |
| 12 to 14 Years | 4 (66.7%) | 6 (100.0%) |
| 15 Years | 0 (0.0%) | 9 (100.0%) |
| 16 and 17 Years | 11 (100.0%) | 9 (100.0%) |
| 18 to 24 Years | 9 (100.0%) | 38 (100.0%) |
| 25 to 34 Years | 23 (100.0%) | 24 (80.0%) |
| 35 to 44 Years | 38 (97.4%) | 18 (85.7%) |
| 45 to 54 Years | 14 (82.4%) | 7 (77.8%) |
| 55 to 64 Years | 21 (100.0%) | 15 (100.0%) |
| 65 to 74 Years | 5 (100.0%) | 13 (100.0%) |
| 75 Years and over | 5 (100.0%) | 11 (100.0%) |
| Total | 155 (93.9%) | 181 (92.3%) |
Income Below Poverty Among Married-Couple Families in Linwood
The poverty statistics for married-couple families in Linwood show that 4.5% or 3 of the total 66 families live below the poverty line. Families with 3 or 4 children have the highest poverty rate of 15.4%, comprising of 2 families. On the other hand, families with no children have the lowest poverty rate of 0.0%, which includes 0 families.
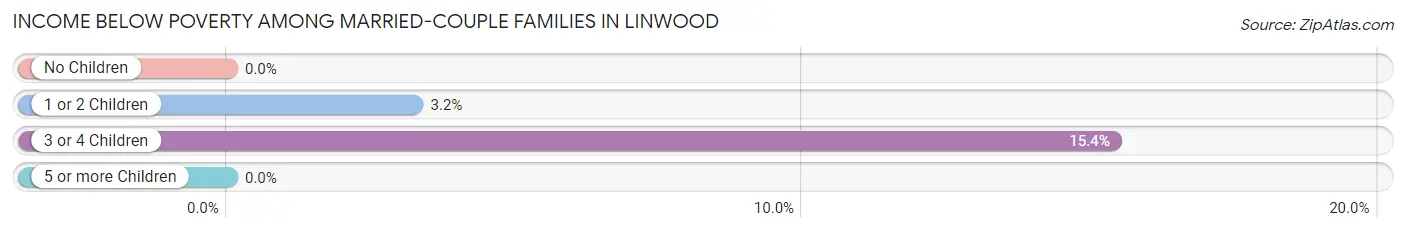
| Children | Above Poverty | Below Poverty |
| No Children | 22 (100.0%) | 0 (0.0%) |
| 1 or 2 Children | 30 (96.8%) | 1 (3.2%) |
| 3 or 4 Children | 11 (84.6%) | 2 (15.4%) |
| 5 or more Children | 0 (0.0%) | 0 (0.0%) |
| Total | 63 (95.5%) | 3 (4.5%) |
Income Below Poverty Among Single-Parent Households in Linwood
| Children | Single Father | Single Mother |
| No Children | 0 (0.0%) | 0 (0.0%) |
| 1 or 2 Children | 0 (0.0%) | 0 (0.0%) |
| 3 or 4 Children | 0 (0.0%) | 0 (0.0%) |
| 5 or more Children | 0 (0.0%) | 0 (0.0%) |
| Total | 0 (0.0%) | 0 (0.0%) |
Income Below Poverty Among Married-Couple vs Single-Parent Households in Linwood
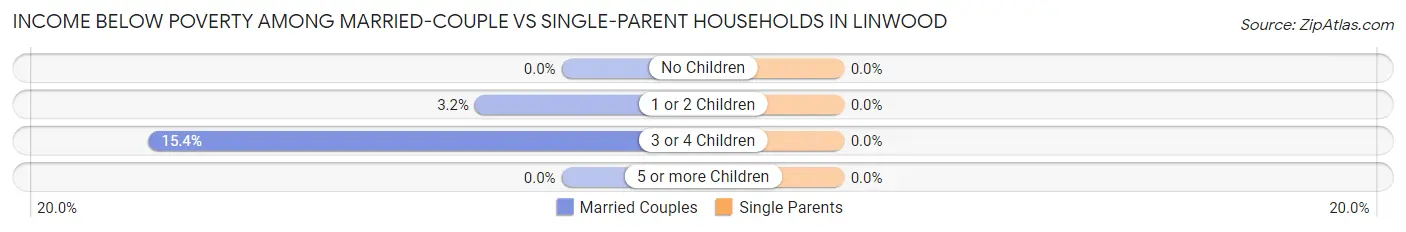
| Children | Married-Couple Families | Single-Parent Households |
| No Children | 0 (0.0%) | 0 (0.0%) |
| 1 or 2 Children | 1 (3.2%) | 0 (0.0%) |
| 3 or 4 Children | 2 (15.4%) | 0 (0.0%) |
| 5 or more Children | 0 (0.0%) | 0 (0.0%) |
| Total | 3 (4.5%) | 0 (0.0%) |
Race in Linwood
The most populous races in Linwood are White / Caucasian (325 | 90.0%), Hispanic or Latino (37 | 10.2%), and Two or more Races (30 | 8.3%).
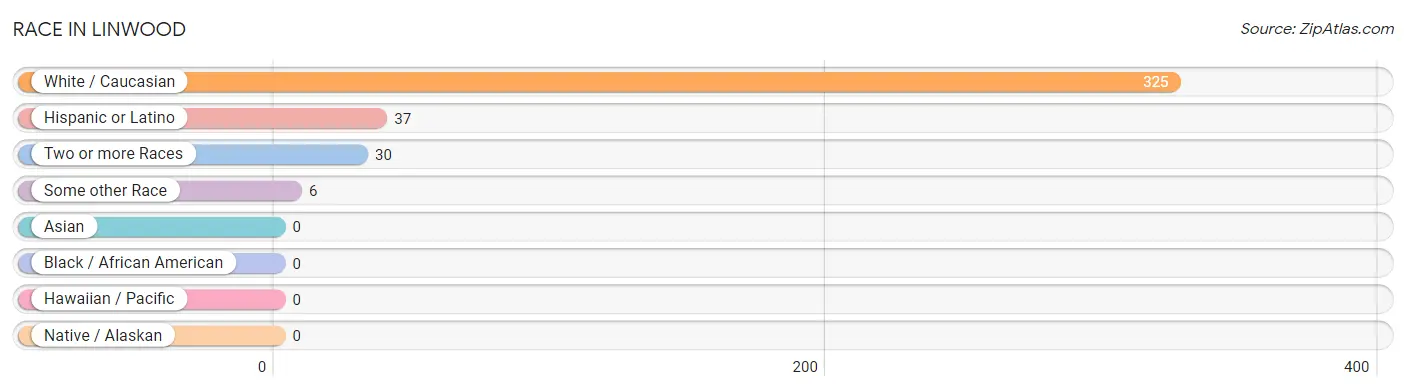
| Race | # Population | % Population |
| Asian | 0 | 0.0% |
| Black / African American | 0 | 0.0% |
| Hawaiian / Pacific | 0 | 0.0% |
| Hispanic or Latino | 37 | 10.2% |
| Native / Alaskan | 0 | 0.0% |
| White / Caucasian | 325 | 90.0% |
| Two or more Races | 30 | 8.3% |
| Some other Race | 6 | 1.7% |
| Total | 361 | 100.0% |
Ancestry in Linwood
The most populous ancestries reported in Linwood are American (57 | 15.8%), Swedish (40 | 11.1%), German (36 | 10.0%), English (34 | 9.4%), and Irish (30 | 8.3%), together accounting for 54.6% of all Linwood residents.
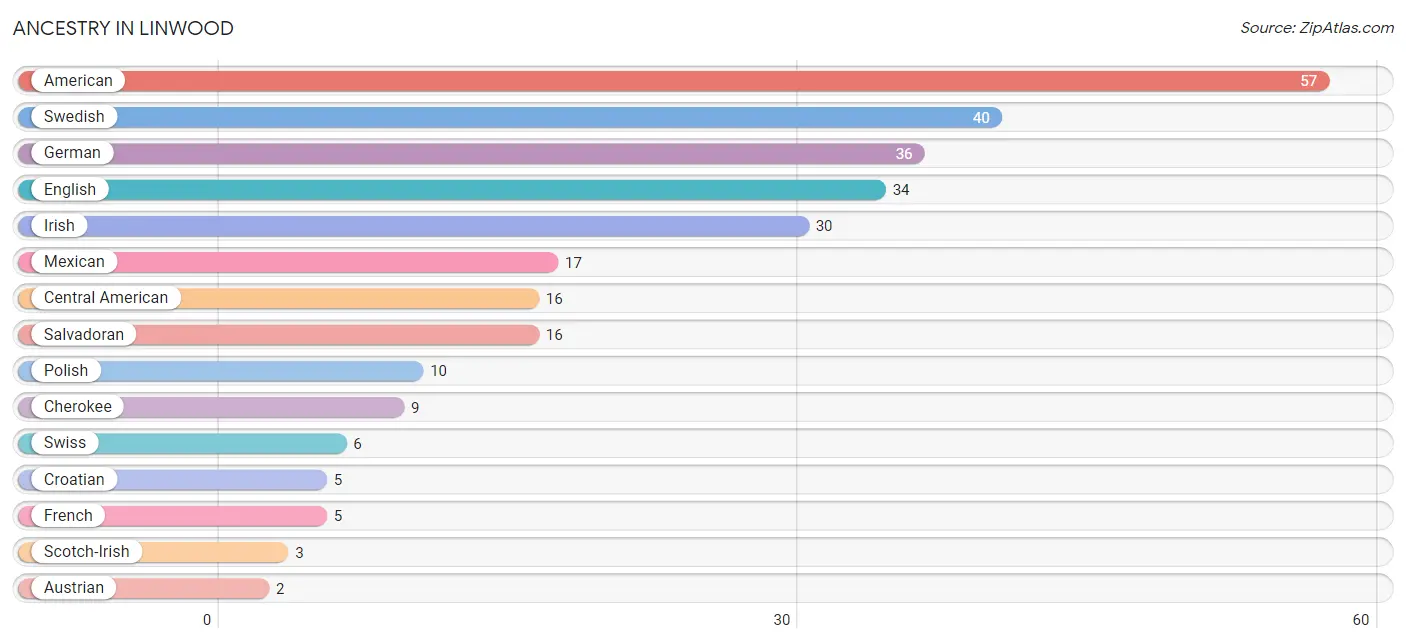
| Ancestry | # Population | % Population |
| American | 57 | 15.8% |
| Austrian | 2 | 0.5% |
| Central American | 16 | 4.4% |
| Cherokee | 9 | 2.5% |
| Choctaw | 2 | 0.5% |
| Croatian | 5 | 1.4% |
| Delaware | 1 | 0.3% |
| Dutch | 2 | 0.5% |
| English | 34 | 9.4% |
| French | 5 | 1.4% |
| German | 36 | 10.0% |
| Irish | 30 | 8.3% |
| Mexican | 17 | 4.7% |
| Norwegian | 2 | 0.5% |
| Polish | 10 | 2.8% |
| Puerto Rican | 2 | 0.5% |
| Salvadoran | 16 | 4.4% |
| Scotch-Irish | 3 | 0.8% |
| Swedish | 40 | 11.1% |
| Swiss | 6 | 1.7% | View All 20 Rows |
Immigrants in Linwood
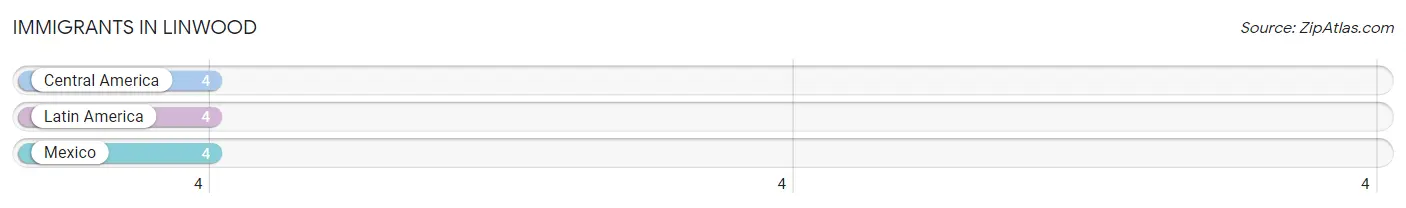
The most numerous immigrant groups reported in Linwood came from Central America (4 | 1.1%), Latin America (4 | 1.1%), and Mexico (4 | 1.1%), together accounting for 3.3% of all Linwood residents.
| Immigration Origin | # Population | % Population |
| Central America | 4 | 1.1% |
| Latin America | 4 | 1.1% |
| Mexico | 4 | 1.1% | View All 3 Rows |
Sex and Age in Linwood
Sex and Age in Linwood
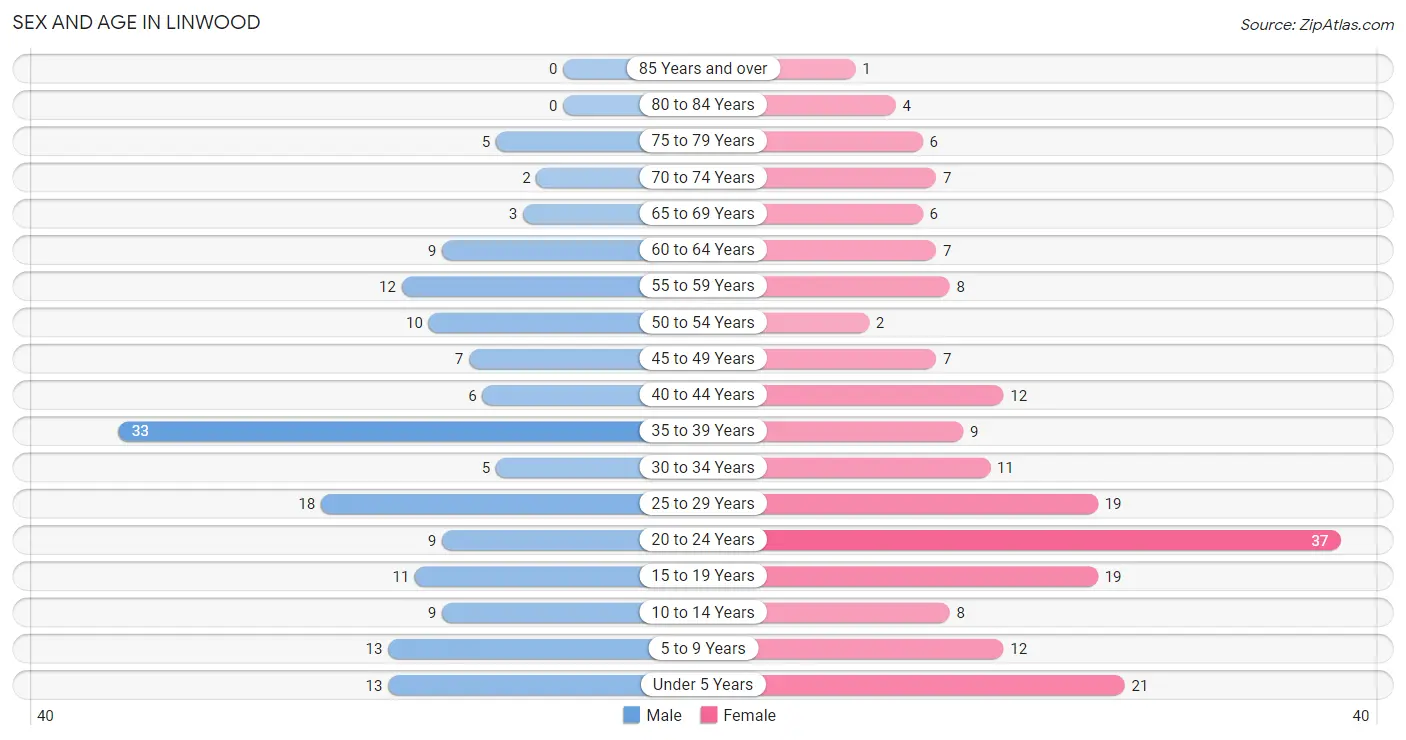
The most populous age groups in Linwood are 35 to 39 Years (33 | 20.0%) for men and 20 to 24 Years (37 | 18.9%) for women.
| Age Bracket | Male | Female |
| Under 5 Years | 13 (7.9%) | 21 (10.7%) |
| 5 to 9 Years | 13 (7.9%) | 12 (6.1%) |
| 10 to 14 Years | 9 (5.4%) | 8 (4.1%) |
| 15 to 19 Years | 11 (6.7%) | 19 (9.7%) |
| 20 to 24 Years | 9 (5.4%) | 37 (18.9%) |
| 25 to 29 Years | 18 (10.9%) | 19 (9.7%) |
| 30 to 34 Years | 5 (3.0%) | 11 (5.6%) |
| 35 to 39 Years | 33 (20.0%) | 9 (4.6%) |
| 40 to 44 Years | 6 (3.6%) | 12 (6.1%) |
| 45 to 49 Years | 7 (4.2%) | 7 (3.6%) |
| 50 to 54 Years | 10 (6.1%) | 2 (1.0%) |
| 55 to 59 Years | 12 (7.3%) | 8 (4.1%) |
| 60 to 64 Years | 9 (5.4%) | 7 (3.6%) |
| 65 to 69 Years | 3 (1.8%) | 6 (3.1%) |
| 70 to 74 Years | 2 (1.2%) | 7 (3.6%) |
| 75 to 79 Years | 5 (3.0%) | 6 (3.1%) |
| 80 to 84 Years | 0 (0.0%) | 4 (2.0%) |
| 85 Years and over | 0 (0.0%) | 1 (0.5%) |
| Total | 165 (100.0%) | 196 (100.0%) |
Families and Households in Linwood
Median Family Size in Linwood
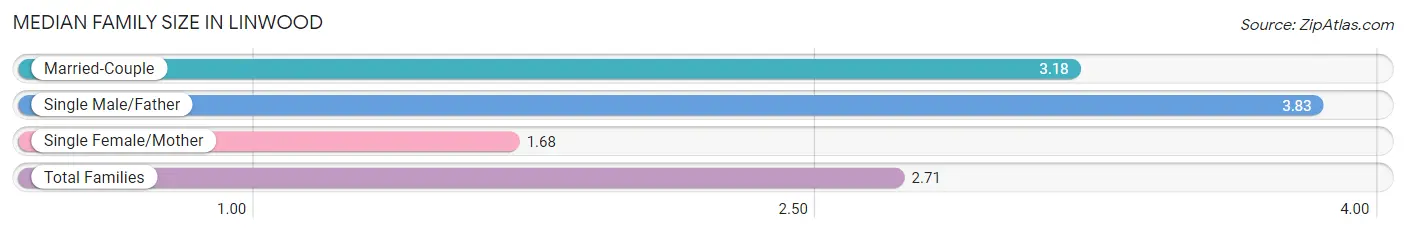
The median family size in Linwood is 2.71 persons per family, with single male/father families (6 | 5.5%) accounting for the largest median family size of 3.83 persons per family. On the other hand, single female/mother families (37 | 33.9%) represent the smallest median family size with 1.68 persons per family.
| Family Type | # Families | Family Size |
| Married-Couple | 66 (60.6%) | 3.18 |
| Single Male/Father | 6 (5.5%) | 3.83 |
| Single Female/Mother | 37 (33.9%) | 1.68 |
| Total Families | 109 (100.0%) | 2.71 |
Median Household Size in Linwood
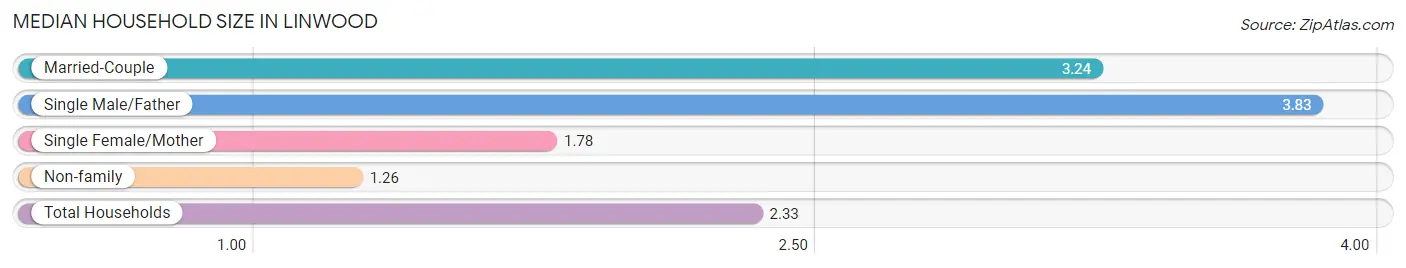
The median household size in Linwood is 2.33 persons per household, with single male/father households (6 | 3.9%) accounting for the largest median household size of 3.83 persons per household. non-family households (46 | 29.7%) represent the smallest median household size with 1.26 persons per household.
| Household Type | # Households | Household Size |
| Married-Couple | 66 (42.6%) | 3.24 |
| Single Male/Father | 6 (3.9%) | 3.83 |
| Single Female/Mother | 37 (23.9%) | 1.78 |
| Non-family | 46 (29.7%) | 1.26 |
| Total Households | 155 (100.0%) | 2.33 |
Household Size by Marriage Status in Linwood
Out of a total of 155 households in Linwood, 109 (70.3%) are family households, while 46 (29.7%) are nonfamily households. The most numerous type of family households are 2-person households, comprising 52, and the most common type of nonfamily households are 1-person households, comprising 35.
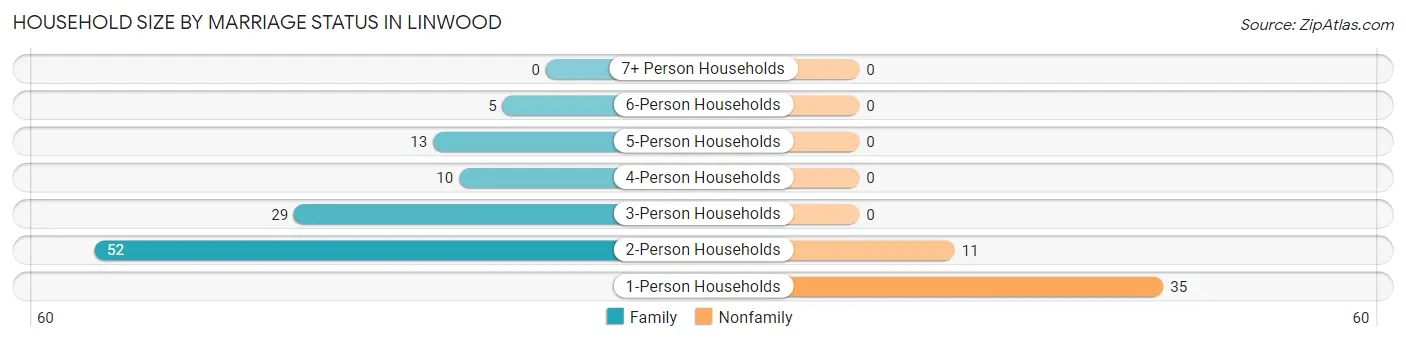
| Household Size | Family Households | Nonfamily Households |
| 1-Person Households | - | 35 (22.6%) |
| 2-Person Households | 52 (33.6%) | 11 (7.1%) |
| 3-Person Households | 29 (18.7%) | 0 (0.0%) |
| 4-Person Households | 10 (6.5%) | 0 (0.0%) |
| 5-Person Households | 13 (8.4%) | 0 (0.0%) |
| 6-Person Households | 5 (3.2%) | 0 (0.0%) |
| 7+ Person Households | 0 (0.0%) | 0 (0.0%) |
| Total | 109 (70.3%) | 46 (29.7%) |
Female Fertility in Linwood
Fertility by Age in Linwood
Average fertility rate in Linwood is 140.0 births per 1,000 women. Women in the age bracket of 20 to 34 years have the highest fertility rate with 239.0 births per 1,000 women. Women in the age bracket of 20 to 34 years acount for 100.0% of all women with births.
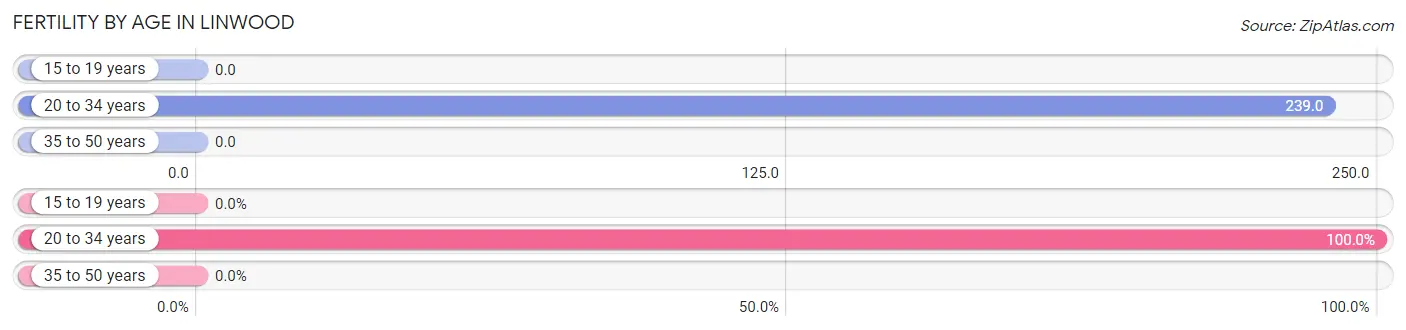
| Age Bracket | Women with Births | Births / 1,000 Women |
| 15 to 19 years | 0 (0.0%) | 0.0 |
| 20 to 34 years | 16 (100.0%) | 239.0 |
| 35 to 50 years | 0 (0.0%) | 0.0 |
| Total | 16 (100.0%) | 140.0 |
Fertility by Age by Marriage Status in Linwood
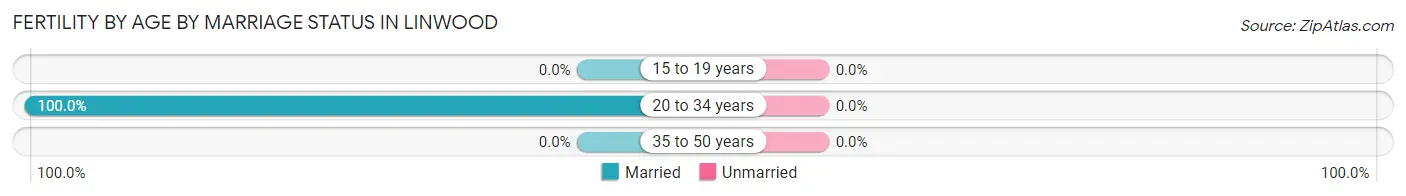
| Age Bracket | Married | Unmarried |
| 15 to 19 years | 0 (0.0%) | 0 (0.0%) |
| 20 to 34 years | 16 (100.0%) | 0 (0.0%) |
| 35 to 50 years | 0 (0.0%) | 0 (0.0%) |
| Total | 16 (100.0%) | 0 (0.0%) |
Fertility by Education in Linwood
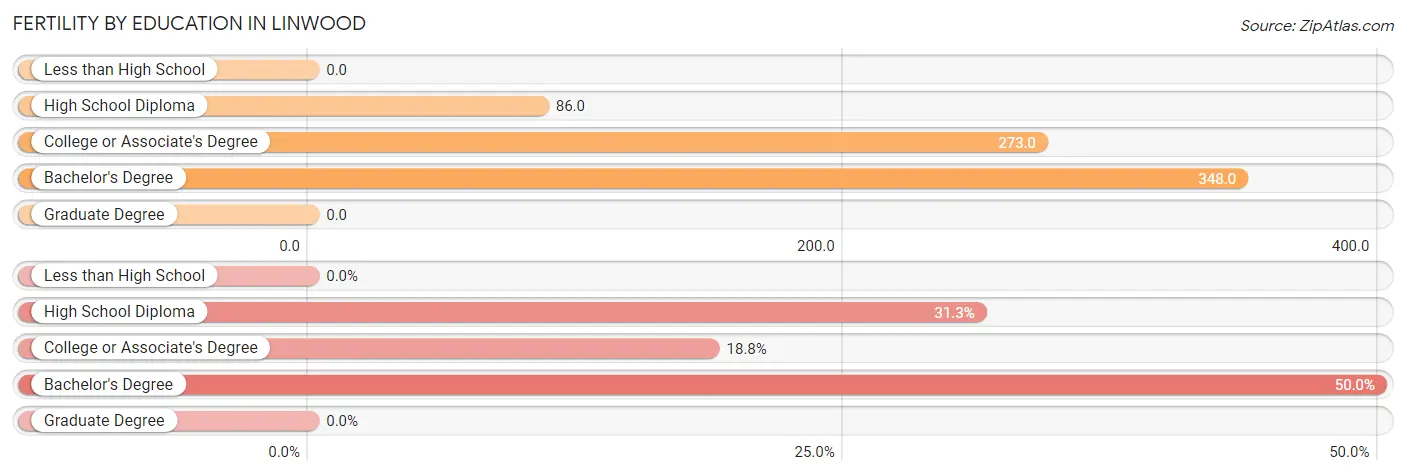
| Educational Attainment | Women with Births | Births / 1,000 Women |
| Less than High School | 0 (0.0%) | 0.0 |
| High School Diploma | 5 (31.2%) | 86.0 |
| College or Associate's Degree | 3 (18.8%) | 273.0 |
| Bachelor's Degree | 8 (50.0%) | 348.0 |
| Graduate Degree | 0 (0.0%) | 0.0 |
| Total | 16 (100.0%) | 140.0 |
Fertility by Education by Marriage Status in Linwood
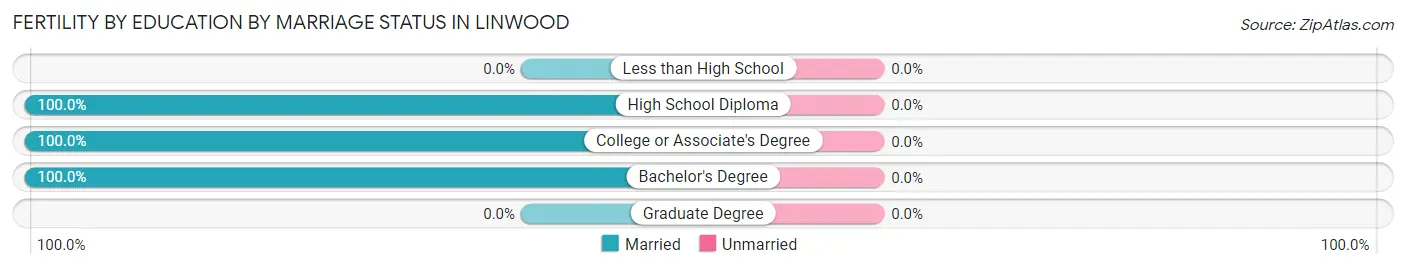
| Educational Attainment | Married | Unmarried |
| Less than High School | 0 (0.0%) | 0 (0.0%) |
| High School Diploma | 5 (100.0%) | 0 (0.0%) |
| College or Associate's Degree | 3 (100.0%) | 0 (0.0%) |
| Bachelor's Degree | 8 (100.0%) | 0 (0.0%) |
| Graduate Degree | 0 (0.0%) | 0 (0.0%) |
| Total | 16 (100.0%) | 0 (0.0%) |
Employment Characteristics in Linwood
Employment by Class of Employer in Linwood
Among the 198 employed individuals in Linwood, private company employees (161 | 81.3%), not-for-profit organizations (14 | 7.1%), and federal government employees (7 | 3.5%) make up the most common classes of employment.
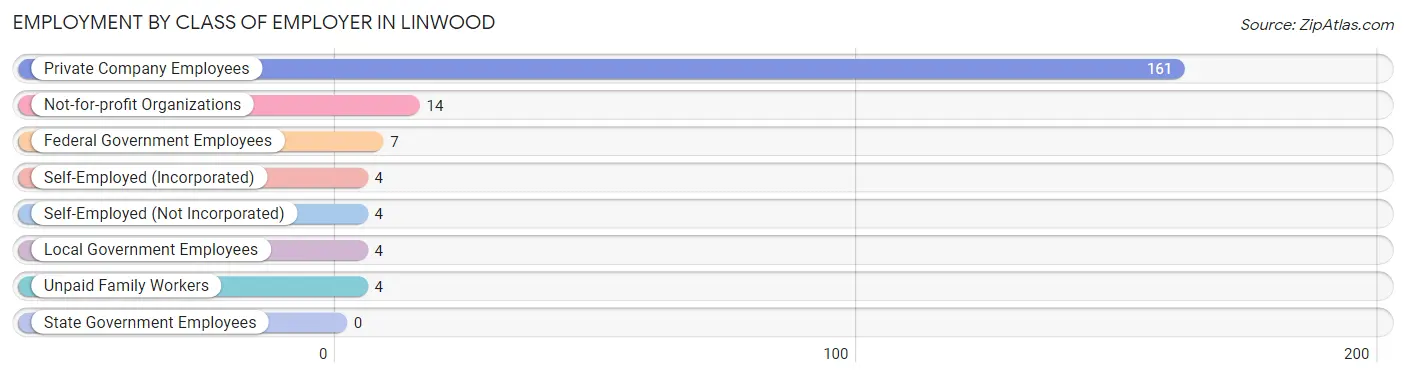
| Employer Class | # Employees | % Employees |
| Private Company Employees | 161 | 81.3% |
| Self-Employed (Incorporated) | 4 | 2.0% |
| Self-Employed (Not Incorporated) | 4 | 2.0% |
| Not-for-profit Organizations | 14 | 7.1% |
| Local Government Employees | 4 | 2.0% |
| State Government Employees | 0 | 0.0% |
| Federal Government Employees | 7 | 3.5% |
| Unpaid Family Workers | 4 | 2.0% |
| Total | 198 | 100.0% |
Employment Status by Age in Linwood
According to the labor force statistics for Linwood, out of the total population over 16 years of age (276), 76.4% or 211 individuals are in the labor force, with 5.3% or 11 of them unemployed. The age group with the highest labor force participation rate is 20 to 24 years, with 100.0% or 46 individuals in the labor force. Within the labor force, the 65 to 74 years age range has the highest percentage of unemployed individuals, with 66.7% or 2 of them being unemployed.
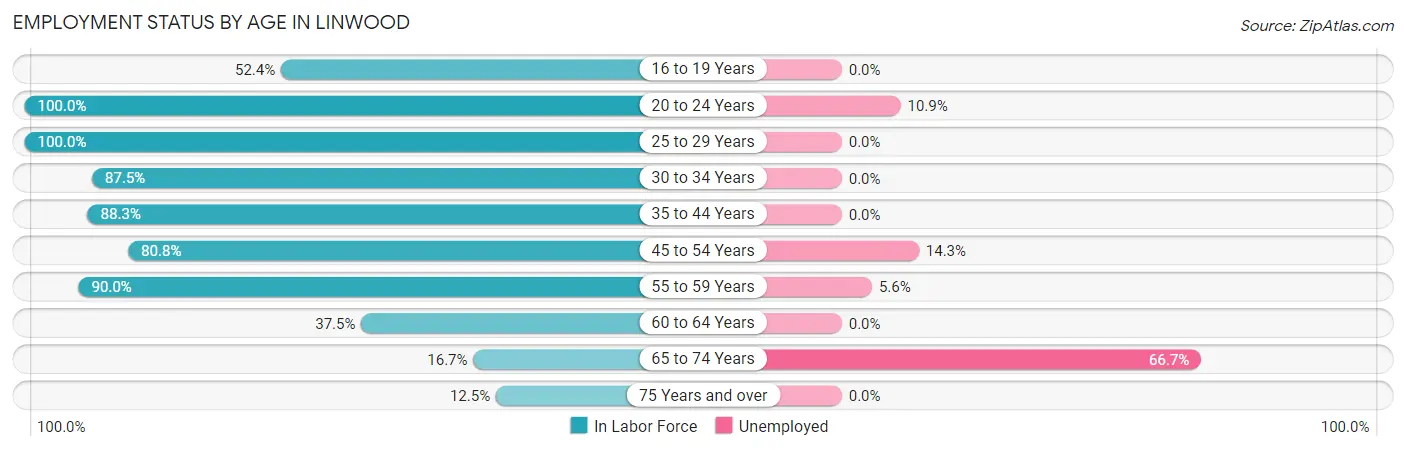
| Age Bracket | In Labor Force | Unemployed |
| 16 to 19 Years | 11 (52.4%) | 0 (0.0%) |
| 20 to 24 Years | 46 (100.0%) | 5 (10.9%) |
| 25 to 29 Years | 37 (100.0%) | 0 (0.0%) |
| 30 to 34 Years | 14 (87.5%) | 0 (0.0%) |
| 35 to 44 Years | 53 (88.3%) | 0 (0.0%) |
| 45 to 54 Years | 21 (80.8%) | 3 (14.3%) |
| 55 to 59 Years | 18 (90.0%) | 1 (5.6%) |
| 60 to 64 Years | 6 (37.5%) | 0 (0.0%) |
| 65 to 74 Years | 3 (16.7%) | 2 (66.7%) |
| 75 Years and over | 2 (12.5%) | 0 (0.0%) |
| Total | 211 (76.4%) | 11 (5.3%) |
Employment Status by Educational Attainment in Linwood
According to labor force statistics for Linwood, 85.1% of individuals (149) out of the total population between 25 and 64 years of age (175) are in the labor force, with 2.7% or 4 of them being unemployed. The group with the highest labor force participation rate are those with the educational attainment of college / associate degree, with 87.5% or 35 individuals in the labor force. Within the labor force, individuals with college / associate degree education have the highest percentage of unemployment, with 12.1% or 4 of them being unemployed.
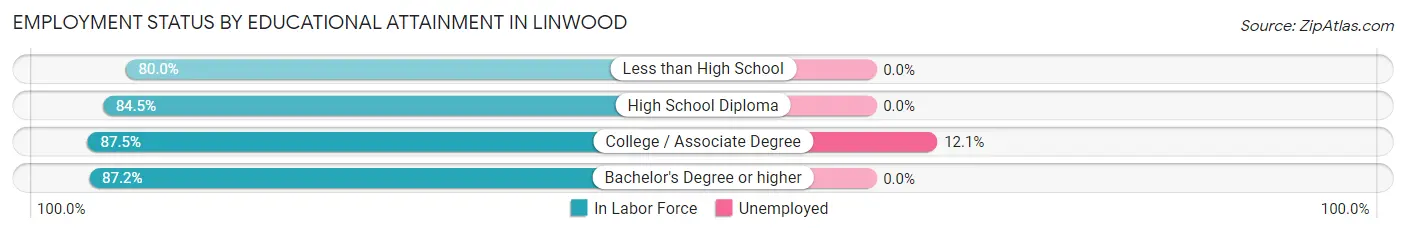
| Educational Attainment | In Labor Force | Unemployed |
| Less than High School | 20 (80.0%) | 0 (0.0%) |
| High School Diploma | 60 (84.5%) | 0 (0.0%) |
| College / Associate Degree | 35 (87.5%) | 5 (12.1%) |
| Bachelor's Degree or higher | 34 (87.2%) | 0 (0.0%) |
| Total | 149 (85.1%) | 5 (2.7%) |
Employment Occupations by Sex in Linwood
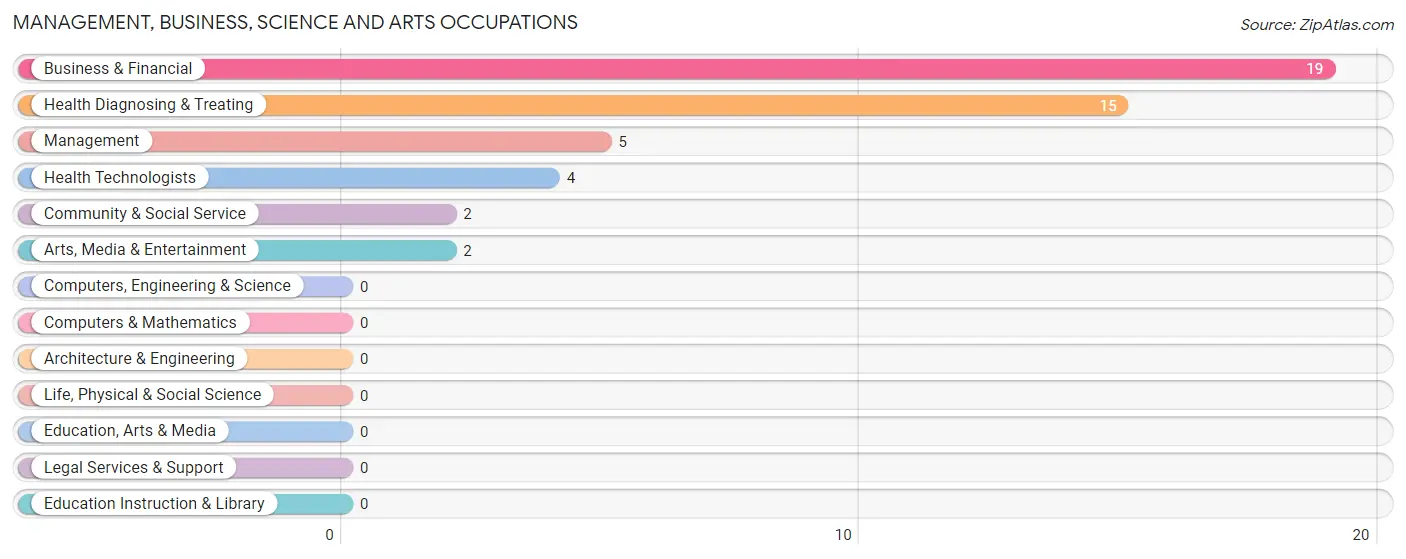
Management, Business, Science and Arts Occupations
The most common Management, Business, Science and Arts occupations in Linwood are Business & Financial (19 | 9.6%), Health Diagnosing & Treating (15 | 7.6%), Management (5 | 2.5%), Health Technologists (4 | 2.0%), and Community & Social Service (2 | 1.0%).
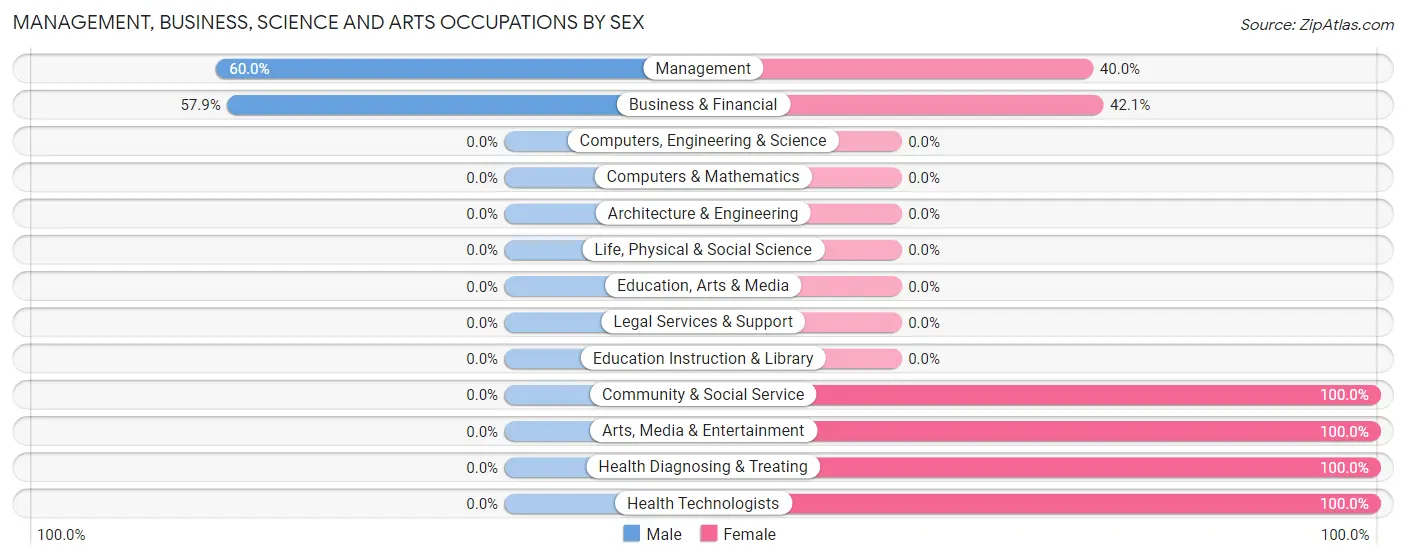
Management, Business, Science and Arts Occupations by Sex
Within the Management, Business, Science and Arts occupations in Linwood, the most male-oriented occupations are Management (60.0%), and Business & Financial (57.9%), while the most female-oriented occupations are Community & Social Service (100.0%), Arts, Media & Entertainment (100.0%), and Health Diagnosing & Treating (100.0%).
| Occupation | Male | Female |
| Management | 3 (60.0%) | 2 (40.0%) |
| Business & Financial | 11 (57.9%) | 8 (42.1%) |
| Computers, Engineering & Science | 0 (0.0%) | 0 (0.0%) |
| Computers & Mathematics | 0 (0.0%) | 0 (0.0%) |
| Architecture & Engineering | 0 (0.0%) | 0 (0.0%) |
| Life, Physical & Social Science | 0 (0.0%) | 0 (0.0%) |
| Community & Social Service | 0 (0.0%) | 2 (100.0%) |
| Education, Arts & Media | 0 (0.0%) | 0 (0.0%) |
| Legal Services & Support | 0 (0.0%) | 0 (0.0%) |
| Education Instruction & Library | 0 (0.0%) | 0 (0.0%) |
| Arts, Media & Entertainment | 0 (0.0%) | 2 (100.0%) |
| Health Diagnosing & Treating | 0 (0.0%) | 15 (100.0%) |
| Health Technologists | 0 (0.0%) | 4 (100.0%) |
| Total (Category) | 14 (34.2%) | 27 (65.8%) |
| Total (Overall) | 94 (47.5%) | 104 (52.5%) |
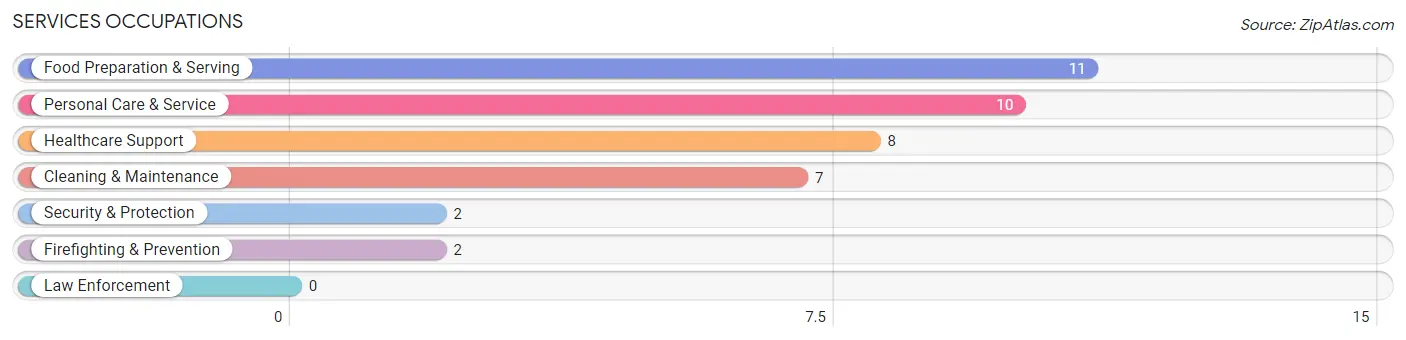
Services Occupations
The most common Services occupations in Linwood are Food Preparation & Serving (11 | 5.6%), Personal Care & Service (10 | 5.1%), Healthcare Support (8 | 4.0%), Cleaning & Maintenance (7 | 3.5%), and Security & Protection (2 | 1.0%).
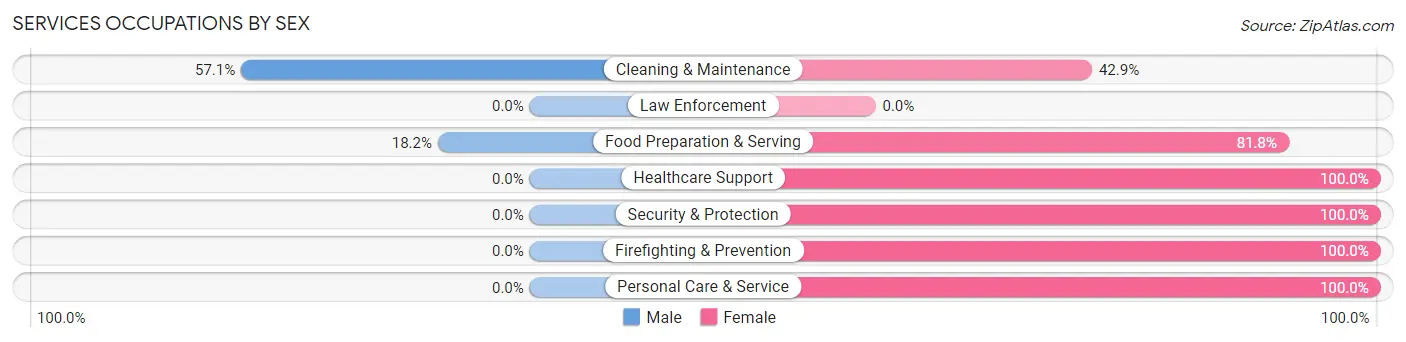
Services Occupations by Sex
Within the Services occupations in Linwood, the most male-oriented occupations are Cleaning & Maintenance (57.1%), and Food Preparation & Serving (18.2%), while the most female-oriented occupations are Healthcare Support (100.0%), Security & Protection (100.0%), and Firefighting & Prevention (100.0%).
| Occupation | Male | Female |
| Healthcare Support | 0 (0.0%) | 8 (100.0%) |
| Security & Protection | 0 (0.0%) | 2 (100.0%) |
| Firefighting & Prevention | 0 (0.0%) | 2 (100.0%) |
| Law Enforcement | 0 (0.0%) | 0 (0.0%) |
| Food Preparation & Serving | 2 (18.2%) | 9 (81.8%) |
| Cleaning & Maintenance | 4 (57.1%) | 3 (42.9%) |
| Personal Care & Service | 0 (0.0%) | 10 (100.0%) |
| Total (Category) | 6 (15.8%) | 32 (84.2%) |
| Total (Overall) | 94 (47.5%) | 104 (52.5%) |
Sales and Office Occupations
The most common Sales and Office occupations in Linwood are Office & Administration (11 | 5.6%), and Sales & Related (2 | 1.0%).
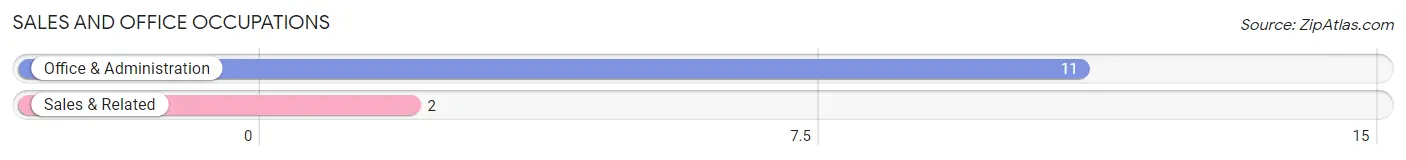
Sales and Office Occupations by Sex
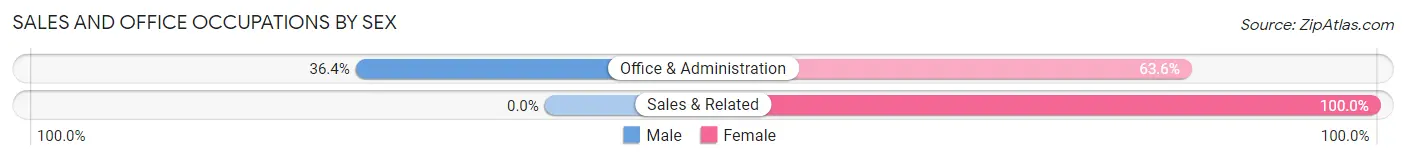
| Occupation | Male | Female |
| Sales & Related | 0 (0.0%) | 2 (100.0%) |
| Office & Administration | 4 (36.4%) | 7 (63.6%) |
| Total (Category) | 4 (30.8%) | 9 (69.2%) |
| Total (Overall) | 94 (47.5%) | 104 (52.5%) |
Natural Resources, Construction and Maintenance Occupations
The most common Natural Resources, Construction and Maintenance occupations in Linwood are Construction & Extraction (53 | 26.8%), and Installation, Maintenance & Repair (13 | 6.6%).
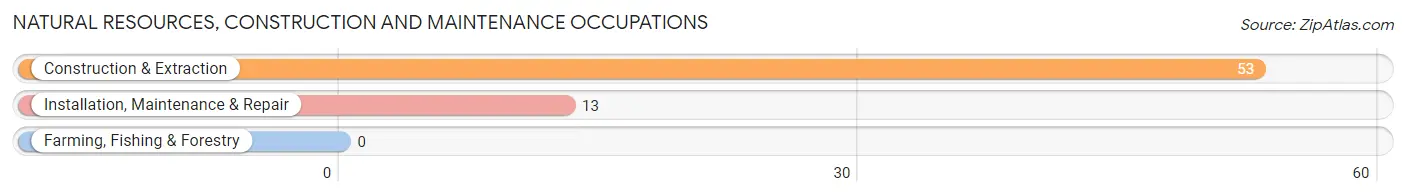
Natural Resources, Construction and Maintenance Occupations by Sex
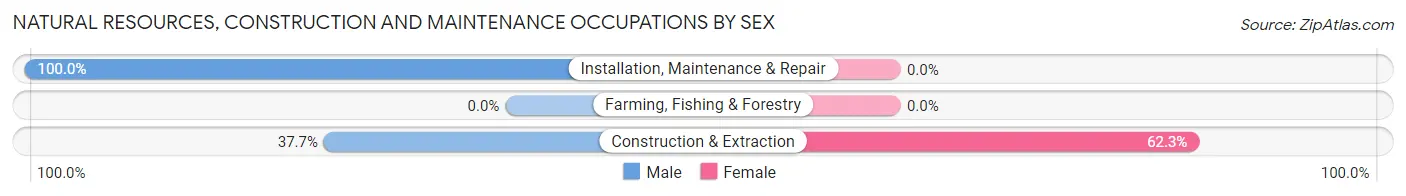
| Occupation | Male | Female |
| Farming, Fishing & Forestry | 0 (0.0%) | 0 (0.0%) |
| Construction & Extraction | 20 (37.7%) | 33 (62.3%) |
| Installation, Maintenance & Repair | 13 (100.0%) | 0 (0.0%) |
| Total (Category) | 33 (50.0%) | 33 (50.0%) |
| Total (Overall) | 94 (47.5%) | 104 (52.5%) |
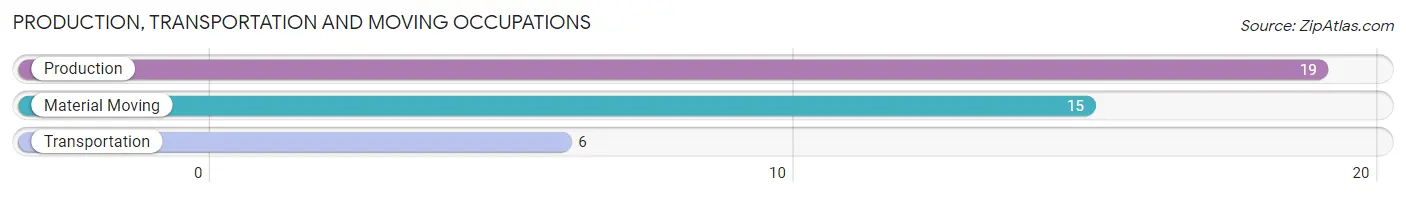
Production, Transportation and Moving Occupations
The most common Production, Transportation and Moving occupations in Linwood are Production (19 | 9.6%), Material Moving (15 | 7.6%), and Transportation (6 | 3.0%).
Production, Transportation and Moving Occupations by Sex
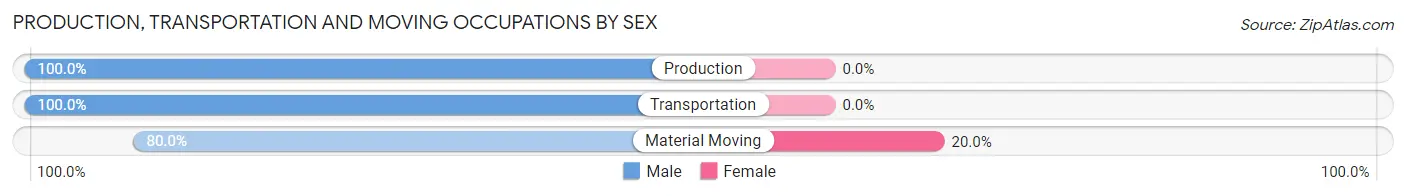
| Occupation | Male | Female |
| Production | 19 (100.0%) | 0 (0.0%) |
| Transportation | 6 (100.0%) | 0 (0.0%) |
| Material Moving | 12 (80.0%) | 3 (20.0%) |
| Total (Category) | 37 (92.5%) | 3 (7.5%) |
| Total (Overall) | 94 (47.5%) | 104 (52.5%) |
Employment Industries by Sex in Linwood
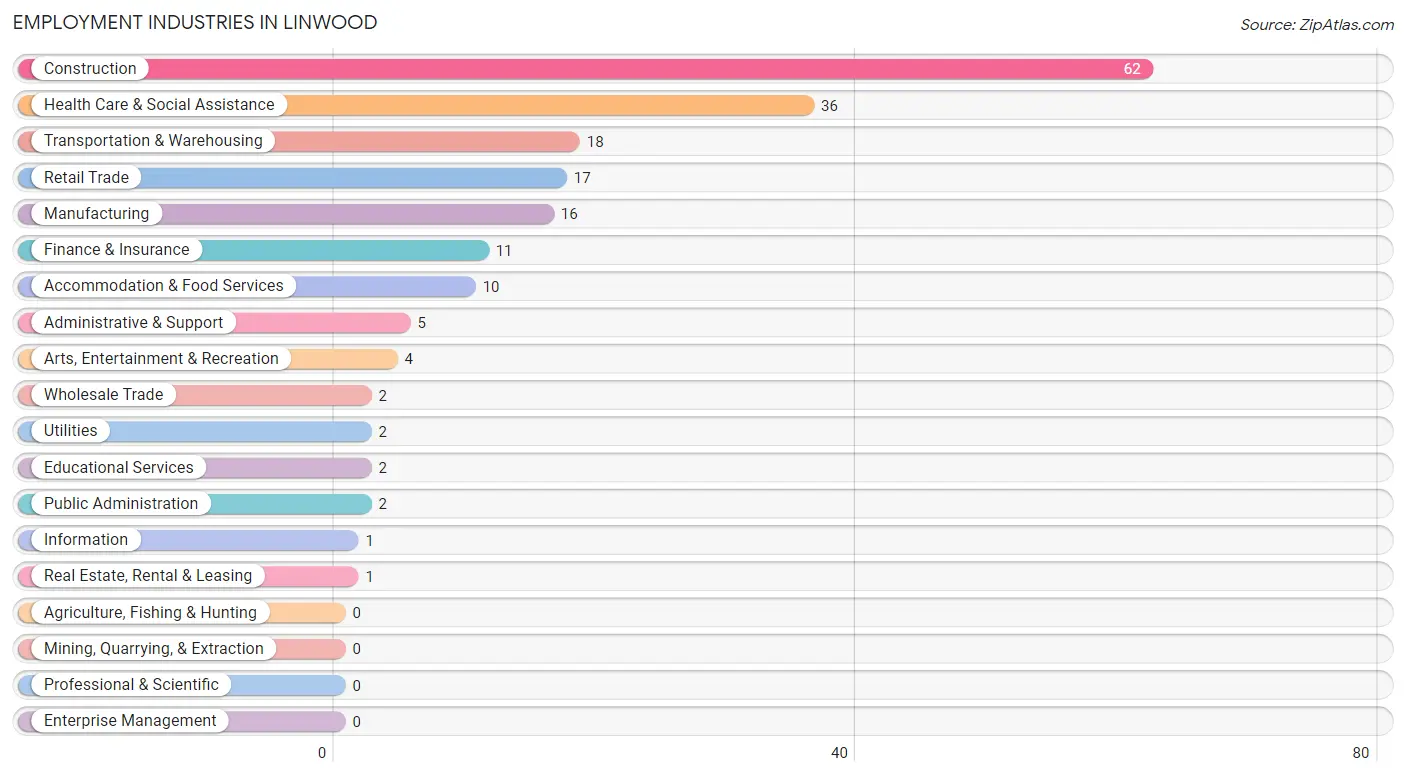
Employment Industries in Linwood
The major employment industries in Linwood include Construction (62 | 31.3%), Health Care & Social Assistance (36 | 18.2%), Transportation & Warehousing (18 | 9.1%), Retail Trade (17 | 8.6%), and Manufacturing (16 | 8.1%).
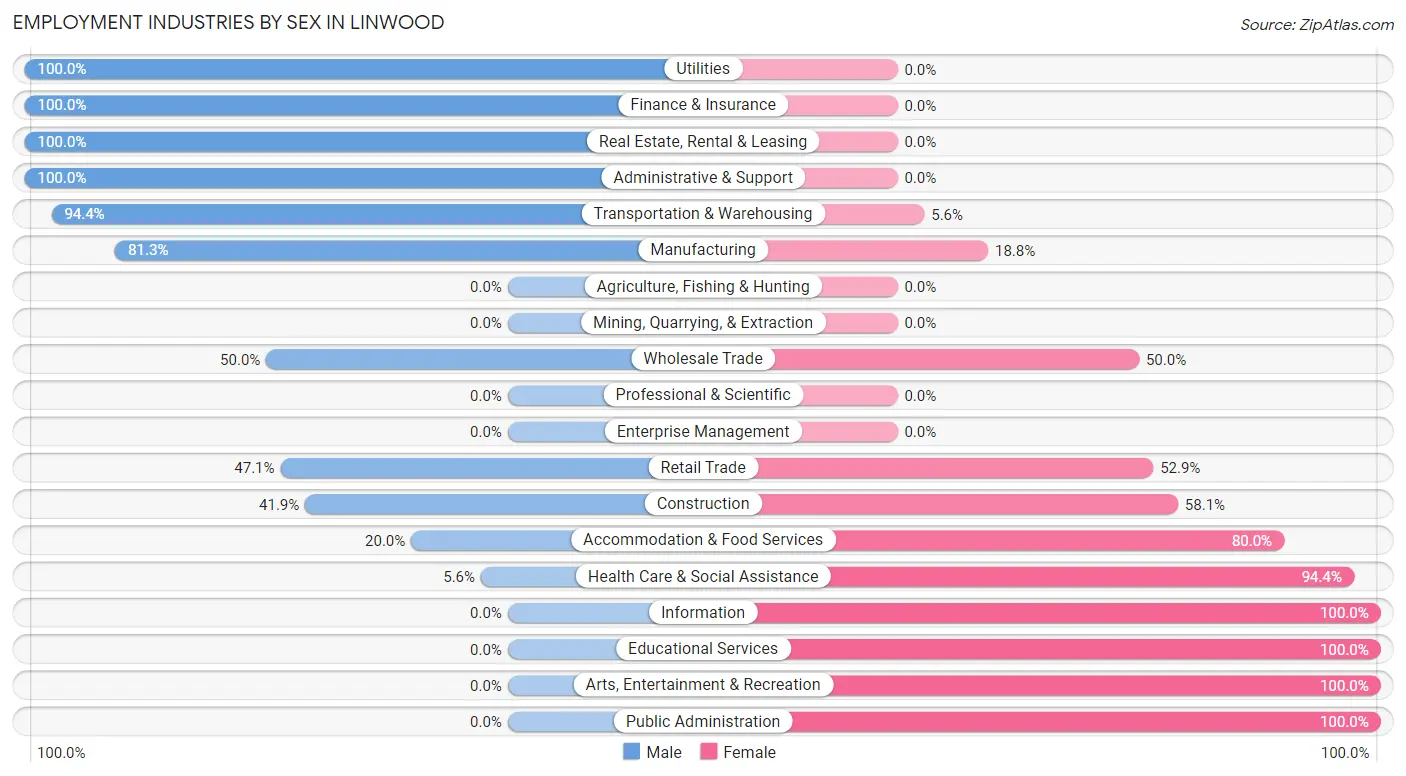
Employment Industries by Sex in Linwood
The Linwood industries that see more men than women are Utilities (100.0%), Finance & Insurance (100.0%), and Real Estate, Rental & Leasing (100.0%), whereas the industries that tend to have a higher number of women are Information (100.0%), Educational Services (100.0%), and Arts, Entertainment & Recreation (100.0%).
| Industry | Male | Female |
| Agriculture, Fishing & Hunting | 0 (0.0%) | 0 (0.0%) |
| Mining, Quarrying, & Extraction | 0 (0.0%) | 0 (0.0%) |
| Construction | 26 (41.9%) | 36 (58.1%) |
| Manufacturing | 13 (81.2%) | 3 (18.8%) |
| Wholesale Trade | 1 (50.0%) | 1 (50.0%) |
| Retail Trade | 8 (47.1%) | 9 (52.9%) |
| Transportation & Warehousing | 17 (94.4%) | 1 (5.6%) |
| Utilities | 2 (100.0%) | 0 (0.0%) |
| Information | 0 (0.0%) | 1 (100.0%) |
| Finance & Insurance | 11 (100.0%) | 0 (0.0%) |
| Real Estate, Rental & Leasing | 1 (100.0%) | 0 (0.0%) |
| Professional & Scientific | 0 (0.0%) | 0 (0.0%) |
| Enterprise Management | 0 (0.0%) | 0 (0.0%) |
| Administrative & Support | 5 (100.0%) | 0 (0.0%) |
| Educational Services | 0 (0.0%) | 2 (100.0%) |
| Health Care & Social Assistance | 2 (5.6%) | 34 (94.4%) |
| Arts, Entertainment & Recreation | 0 (0.0%) | 4 (100.0%) |
| Accommodation & Food Services | 2 (20.0%) | 8 (80.0%) |
| Public Administration | 0 (0.0%) | 2 (100.0%) |
| Total | 94 (47.5%) | 104 (52.5%) |
Education in Linwood
School Enrollment in Linwood
The most common levels of schooling among the 74 students in Linwood are high school (33 | 44.6%), elementary school (25 | 33.8%), and middle school (13 | 17.6%).
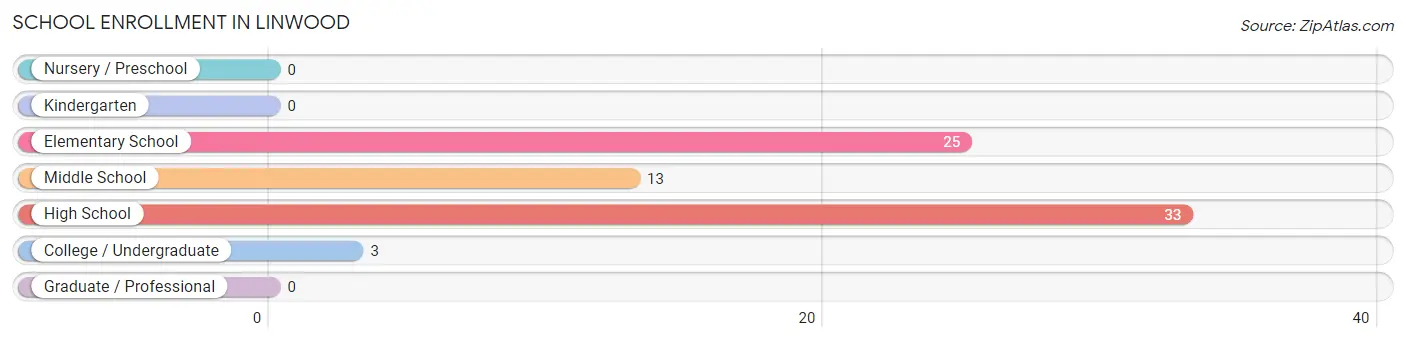
| School Level | # Students | % Students |
| Nursery / Preschool | 0 | 0.0% |
| Kindergarten | 0 | 0.0% |
| Elementary School | 25 | 33.8% |
| Middle School | 13 | 17.6% |
| High School | 33 | 44.6% |
| College / Undergraduate | 3 | 4.1% |
| Graduate / Professional | 0 | 0.0% |
| Total | 74 | 100.0% |
School Enrollment by Age by Funding Source in Linwood
Out of a total of 74 students who are enrolled in schools in Linwood, 4 (5.4%) attend a private institution, while the remaining 70 (94.6%) are enrolled in public schools. The age group of 5 to 9 year old has the highest likelihood of being enrolled in private schools, with 3 (12.0% in the age bracket) enrolled. Conversely, the age group of 15 to 17 year olds has the lowest likelihood of being enrolled in a private school, with 29 (100.0% in the age bracket) attending a public institution.
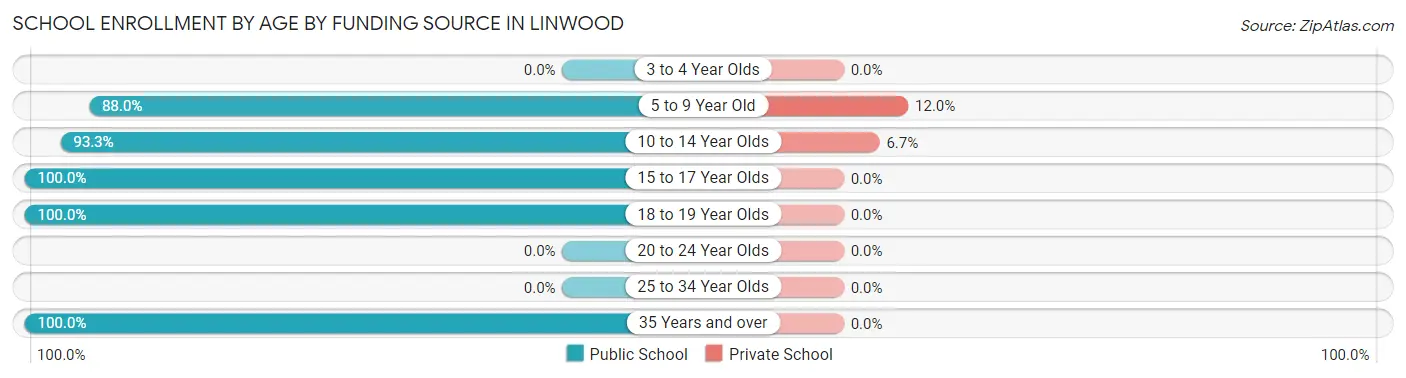
| Age Bracket | Public School | Private School |
| 3 to 4 Year Olds | 0 (0.0%) | 0 (0.0%) |
| 5 to 9 Year Old | 22 (88.0%) | 3 (12.0%) |
| 10 to 14 Year Olds | 14 (93.3%) | 1 (6.7%) |
| 15 to 17 Year Olds | 29 (100.0%) | 0 (0.0%) |
| 18 to 19 Year Olds | 1 (100.0%) | 0 (0.0%) |
| 20 to 24 Year Olds | 0 (0.0%) | 0 (0.0%) |
| 25 to 34 Year Olds | 0 (0.0%) | 0 (0.0%) |
| 35 Years and over | 4 (100.0%) | 0 (0.0%) |
| Total | 70 (94.6%) | 4 (5.4%) |
Educational Attainment by Field of Study in Linwood
Business (22 | 44.9%), physical & health sciences (8 | 16.3%), arts & humanities (6 | 12.2%), science & technology (5 | 10.2%), and education (4 | 8.2%) are the most common fields of study among 49 individuals in Linwood who have obtained a bachelor's degree or higher.
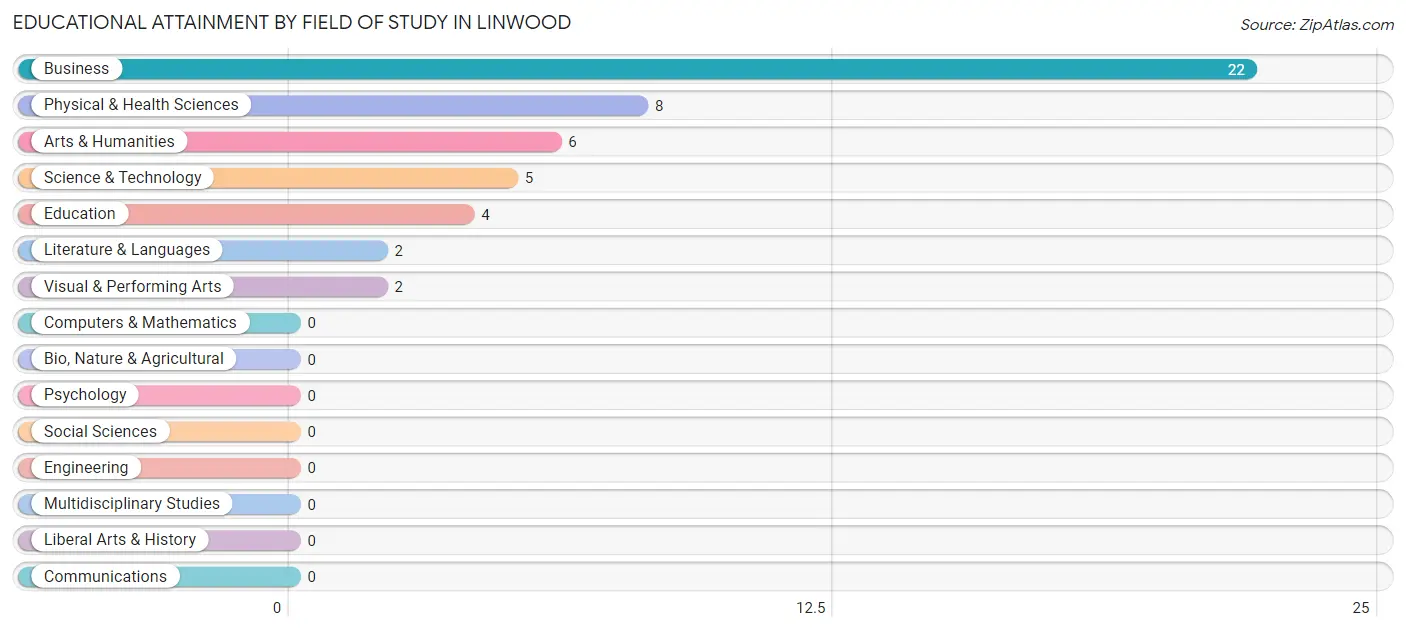
| Field of Study | # Graduates | % Graduates |
| Computers & Mathematics | 0 | 0.0% |
| Bio, Nature & Agricultural | 0 | 0.0% |
| Physical & Health Sciences | 8 | 16.3% |
| Psychology | 0 | 0.0% |
| Social Sciences | 0 | 0.0% |
| Engineering | 0 | 0.0% |
| Multidisciplinary Studies | 0 | 0.0% |
| Science & Technology | 5 | 10.2% |
| Business | 22 | 44.9% |
| Education | 4 | 8.2% |
| Literature & Languages | 2 | 4.1% |
| Liberal Arts & History | 0 | 0.0% |
| Visual & Performing Arts | 2 | 4.1% |
| Communications | 0 | 0.0% |
| Arts & Humanities | 6 | 12.2% |
| Total | 49 | 100.0% |
Transportation & Commute in Linwood
Vehicle Availability by Sex in Linwood
The most prevalent vehicle ownership categories in Linwood are males with 2 vehicles (41, accounting for 42.7%) and females with 2 vehicles (16, making up 40.2%).
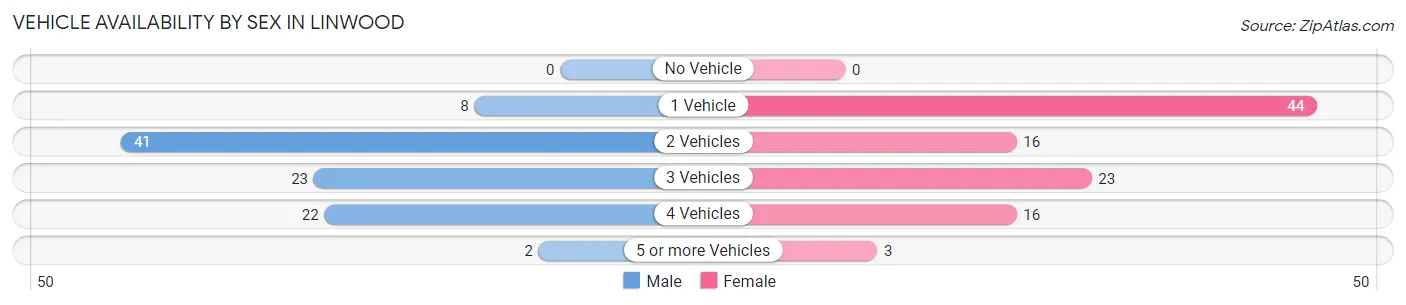
| Vehicles Available | Male | Female |
| No Vehicle | 0 (0.0%) | 0 (0.0%) |
| 1 Vehicle | 8 (8.3%) | 44 (43.1%) |
| 2 Vehicles | 41 (42.7%) | 16 (15.7%) |
| 3 Vehicles | 23 (24.0%) | 23 (22.6%) |
| 4 Vehicles | 22 (22.9%) | 16 (15.7%) |
| 5 or more Vehicles | 2 (2.1%) | 3 (2.9%) |
| Total | 96 (100.0%) | 102 (100.0%) |
Commute Time in Linwood
The most frequently occuring commute durations in Linwood are 45 to 59 minutes (67 commuters, 34.4%), 15 to 19 minutes (27 commuters, 13.9%), and 40 to 44 minutes (19 commuters, 9.7%).
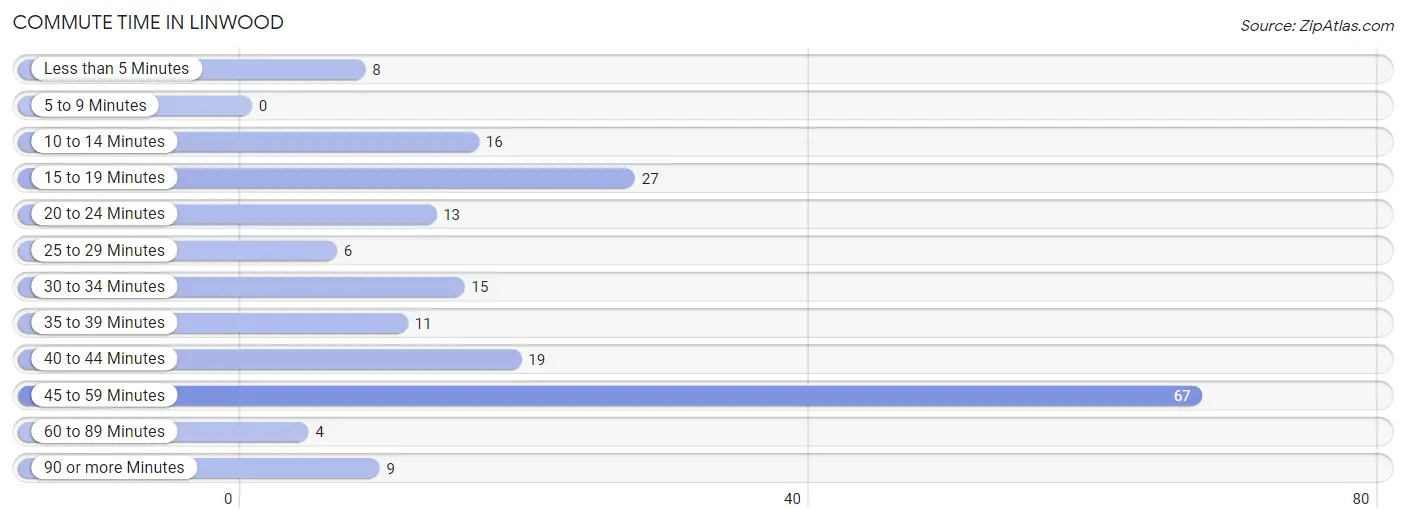
| Commute Time | # Commuters | % Commuters |
| Less than 5 Minutes | 8 | 4.1% |
| 5 to 9 Minutes | 0 | 0.0% |
| 10 to 14 Minutes | 16 | 8.2% |
| 15 to 19 Minutes | 27 | 13.9% |
| 20 to 24 Minutes | 13 | 6.7% |
| 25 to 29 Minutes | 6 | 3.1% |
| 30 to 34 Minutes | 15 | 7.7% |
| 35 to 39 Minutes | 11 | 5.6% |
| 40 to 44 Minutes | 19 | 9.7% |
| 45 to 59 Minutes | 67 | 34.4% |
| 60 to 89 Minutes | 4 | 2.1% |
| 90 or more Minutes | 9 | 4.6% |
Commute Time by Sex in Linwood
The most common commute times in Linwood are 45 to 59 minutes (20 commuters, 21.5%) for males and 45 to 59 minutes (47 commuters, 46.1%) for females.
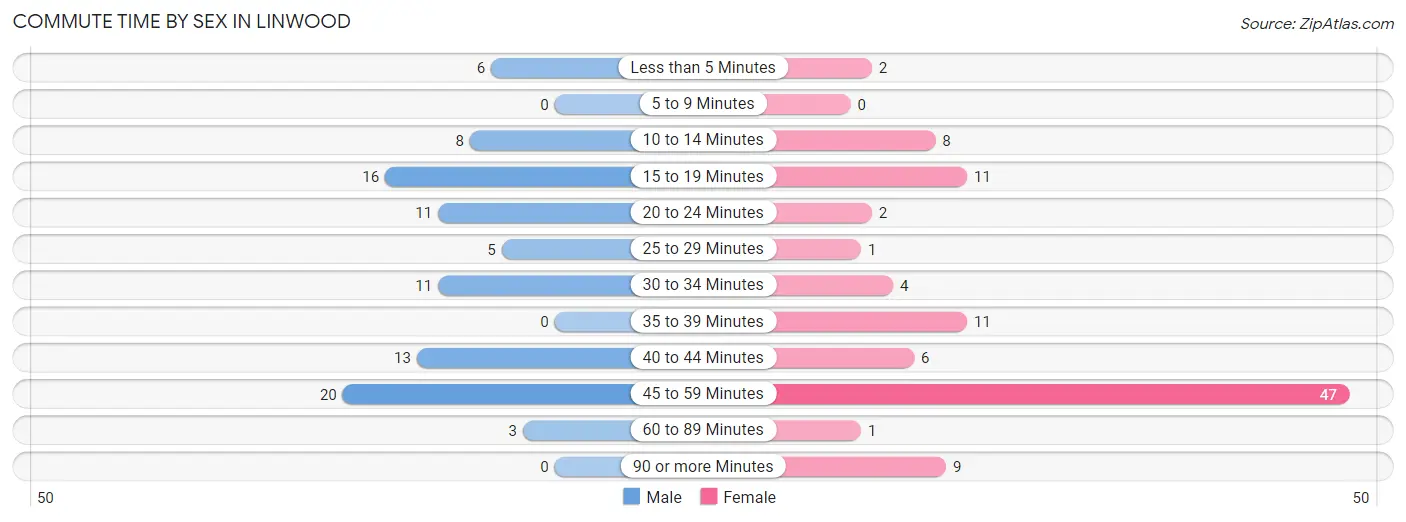
| Commute Time | Male | Female |
| Less than 5 Minutes | 6 (6.5%) | 2 (2.0%) |
| 5 to 9 Minutes | 0 (0.0%) | 0 (0.0%) |
| 10 to 14 Minutes | 8 (8.6%) | 8 (7.8%) |
| 15 to 19 Minutes | 16 (17.2%) | 11 (10.8%) |
| 20 to 24 Minutes | 11 (11.8%) | 2 (2.0%) |
| 25 to 29 Minutes | 5 (5.4%) | 1 (1.0%) |
| 30 to 34 Minutes | 11 (11.8%) | 4 (3.9%) |
| 35 to 39 Minutes | 0 (0.0%) | 11 (10.8%) |
| 40 to 44 Minutes | 13 (14.0%) | 6 (5.9%) |
| 45 to 59 Minutes | 20 (21.5%) | 47 (46.1%) |
| 60 to 89 Minutes | 3 (3.2%) | 1 (1.0%) |
| 90 or more Minutes | 0 (0.0%) | 9 (8.8%) |
Time of Departure to Work by Sex in Linwood
The most frequent times of departure to work in Linwood are 7:30 AM to 7:59 AM (16, 17.2%) for males and 5:00 AM to 5:29 AM (36, 35.3%) for females.
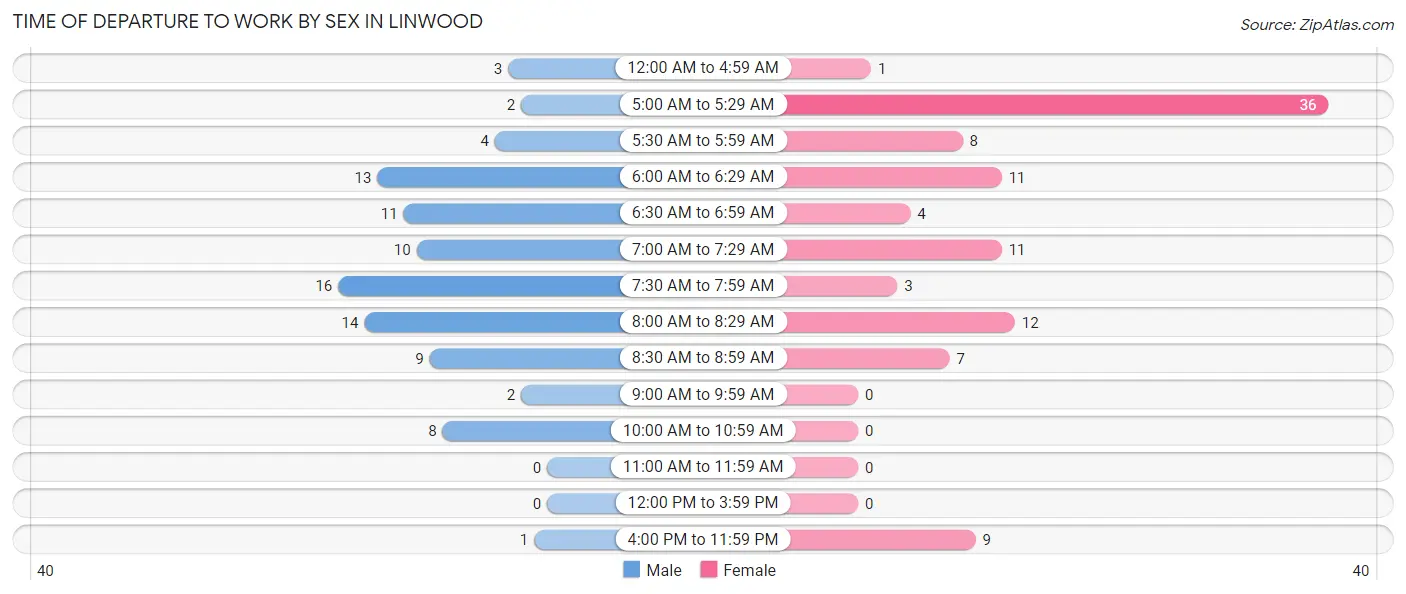
| Time of Departure | Male | Female |
| 12:00 AM to 4:59 AM | 3 (3.2%) | 1 (1.0%) |
| 5:00 AM to 5:29 AM | 2 (2.1%) | 36 (35.3%) |
| 5:30 AM to 5:59 AM | 4 (4.3%) | 8 (7.8%) |
| 6:00 AM to 6:29 AM | 13 (14.0%) | 11 (10.8%) |
| 6:30 AM to 6:59 AM | 11 (11.8%) | 4 (3.9%) |
| 7:00 AM to 7:29 AM | 10 (10.7%) | 11 (10.8%) |
| 7:30 AM to 7:59 AM | 16 (17.2%) | 3 (2.9%) |
| 8:00 AM to 8:29 AM | 14 (15.0%) | 12 (11.8%) |
| 8:30 AM to 8:59 AM | 9 (9.7%) | 7 (6.9%) |
| 9:00 AM to 9:59 AM | 2 (2.1%) | 0 (0.0%) |
| 10:00 AM to 10:59 AM | 8 (8.6%) | 0 (0.0%) |
| 11:00 AM to 11:59 AM | 0 (0.0%) | 0 (0.0%) |
| 12:00 PM to 3:59 PM | 0 (0.0%) | 0 (0.0%) |
| 4:00 PM to 11:59 PM | 1 (1.1%) | 9 (8.8%) |
| Total | 93 (100.0%) | 102 (100.0%) |
Housing Occupancy in Linwood
Occupancy by Ownership in Linwood
Of the total 155 dwellings in Linwood, owner-occupied units account for 127 (81.9%), while renter-occupied units make up 28 (18.1%).
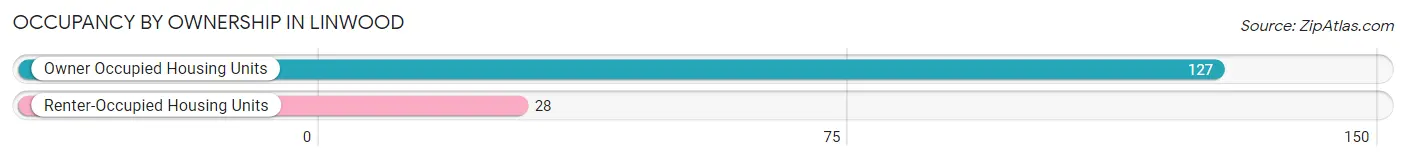
| Occupancy | # Housing Units | % Housing Units |
| Owner Occupied Housing Units | 127 | 81.9% |
| Renter-Occupied Housing Units | 28 | 18.1% |
| Total Occupied Housing Units | 155 | 100.0% |
Occupancy by Household Size in Linwood
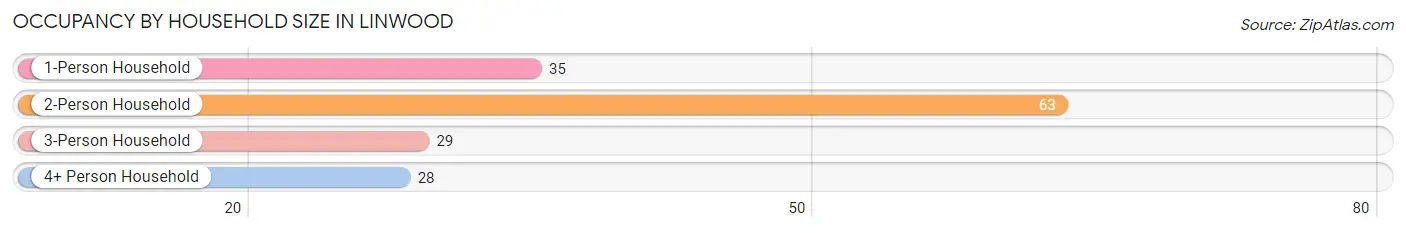
| Household Size | # Housing Units | % Housing Units |
| 1-Person Household | 35 | 22.6% |
| 2-Person Household | 63 | 40.6% |
| 3-Person Household | 29 | 18.7% |
| 4+ Person Household | 28 | 18.1% |
| Total Housing Units | 155 | 100.0% |
Occupancy by Ownership by Household Size in Linwood
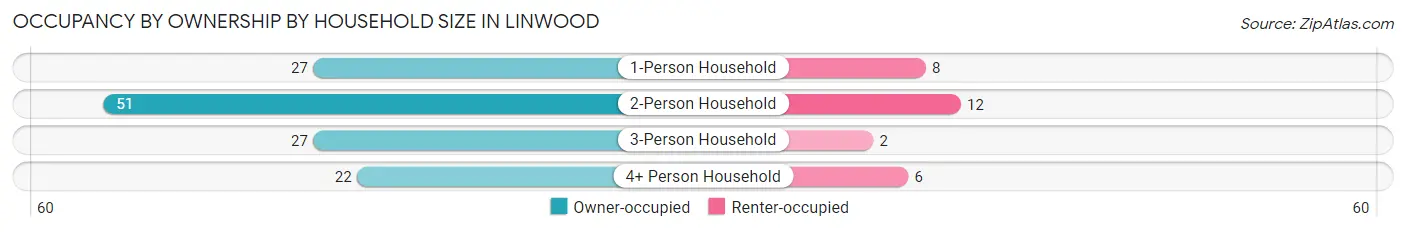
| Household Size | Owner-occupied | Renter-occupied |
| 1-Person Household | 27 (77.1%) | 8 (22.9%) |
| 2-Person Household | 51 (80.9%) | 12 (19.1%) |
| 3-Person Household | 27 (93.1%) | 2 (6.9%) |
| 4+ Person Household | 22 (78.6%) | 6 (21.4%) |
| Total Housing Units | 127 (81.9%) | 28 (18.1%) |
Occupancy by Educational Attainment in Linwood
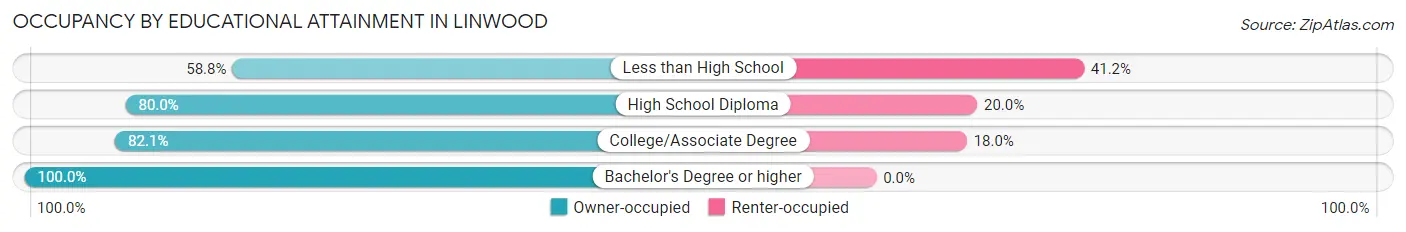
| Household Size | Owner-occupied | Renter-occupied |
| Less than High School | 10 (58.8%) | 7 (41.2%) |
| High School Diploma | 56 (80.0%) | 14 (20.0%) |
| College/Associate Degree | 32 (82.1%) | 7 (17.9%) |
| Bachelor's Degree or higher | 29 (100.0%) | 0 (0.0%) |
Occupancy by Age of Householder in Linwood
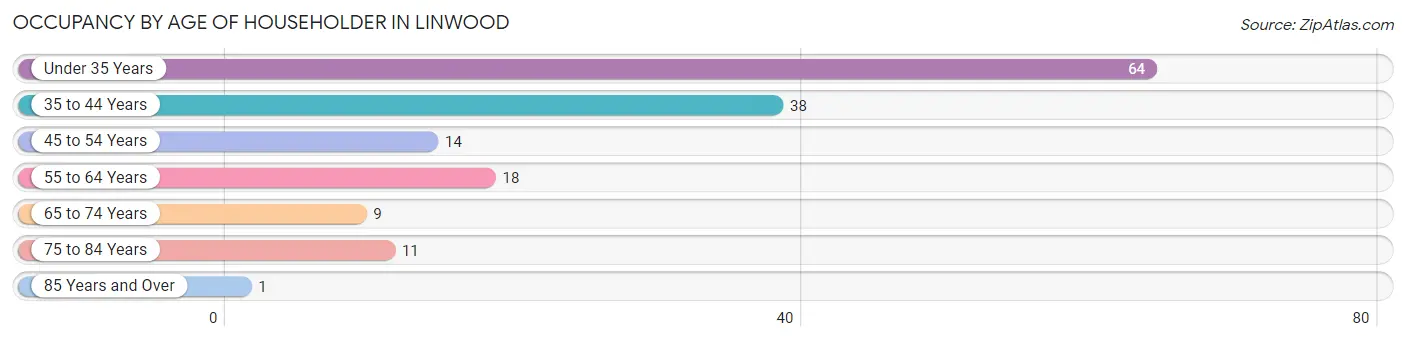
| Age Bracket | # Households | % Households |
| Under 35 Years | 64 | 41.3% |
| 35 to 44 Years | 38 | 24.5% |
| 45 to 54 Years | 14 | 9.0% |
| 55 to 64 Years | 18 | 11.6% |
| 65 to 74 Years | 9 | 5.8% |
| 75 to 84 Years | 11 | 7.1% |
| 85 Years and Over | 1 | 0.6% |
| Total | 155 | 100.0% |
Housing Finances in Linwood
Median Income by Occupancy in Linwood
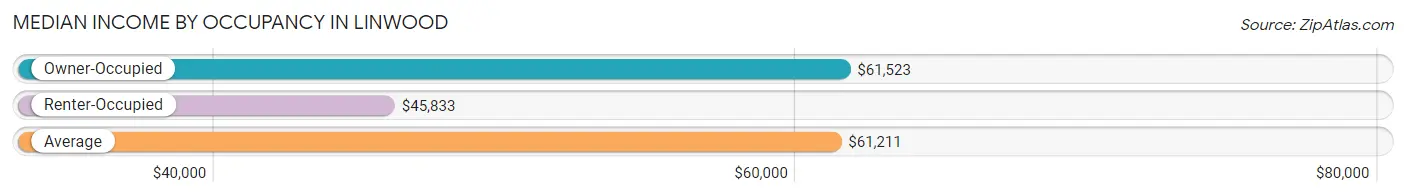
| Occupancy Type | # Households | Median Income |
| Owner-Occupied | 127 (81.9%) | $61,523 |
| Renter-Occupied | 28 (18.1%) | $45,833 |
| Average | 155 (100.0%) | $61,211 |
Occupancy by Householder Income Bracket in Linwood
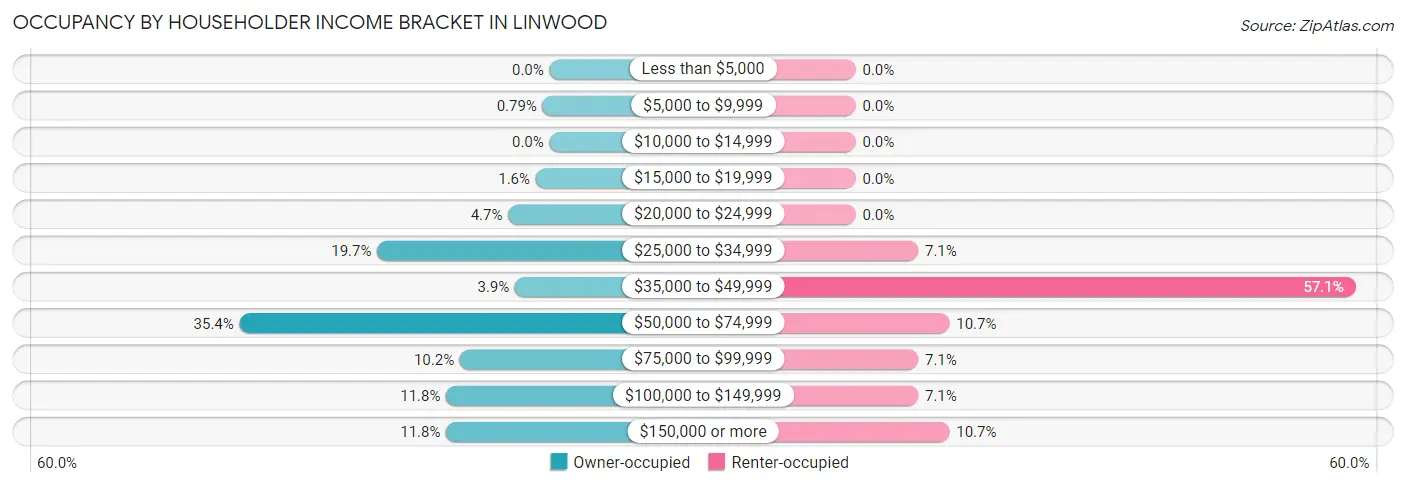
| Income Bracket | Owner-occupied | Renter-occupied |
| Less than $5,000 | 0 (0.0%) | 0 (0.0%) |
| $5,000 to $9,999 | 1 (0.8%) | 0 (0.0%) |
| $10,000 to $14,999 | 0 (0.0%) | 0 (0.0%) |
| $15,000 to $19,999 | 2 (1.6%) | 0 (0.0%) |
| $20,000 to $24,999 | 6 (4.7%) | 0 (0.0%) |
| $25,000 to $34,999 | 25 (19.7%) | 2 (7.1%) |
| $35,000 to $49,999 | 5 (3.9%) | 16 (57.1%) |
| $50,000 to $74,999 | 45 (35.4%) | 3 (10.7%) |
| $75,000 to $99,999 | 13 (10.2%) | 2 (7.1%) |
| $100,000 to $149,999 | 15 (11.8%) | 2 (7.1%) |
| $150,000 or more | 15 (11.8%) | 3 (10.7%) |
| Total | 127 (100.0%) | 28 (100.0%) |
Monthly Housing Cost Tiers in Linwood
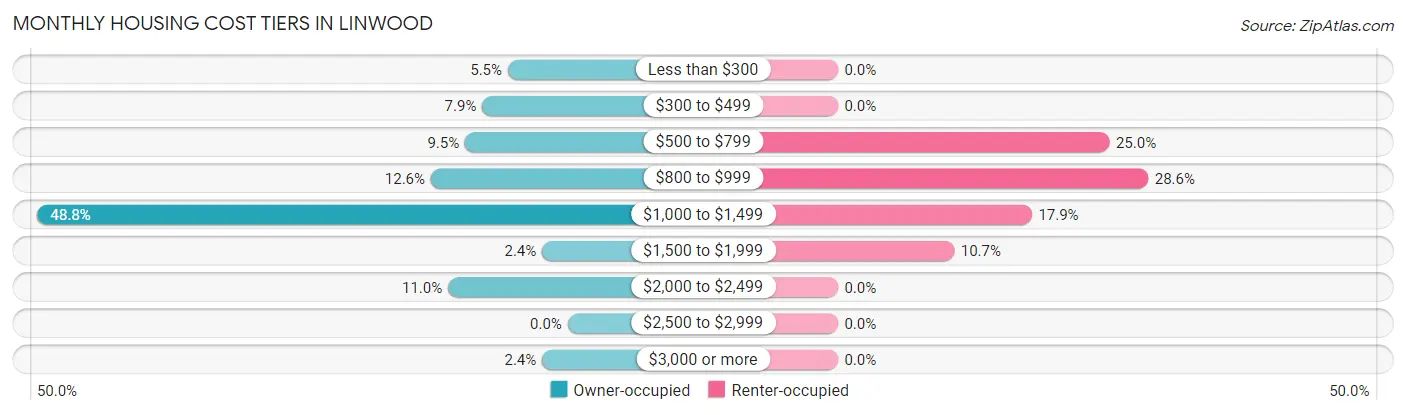
| Monthly Cost | Owner-occupied | Renter-occupied |
| Less than $300 | 7 (5.5%) | 0 (0.0%) |
| $300 to $499 | 10 (7.9%) | 0 (0.0%) |
| $500 to $799 | 12 (9.5%) | 7 (25.0%) |
| $800 to $999 | 16 (12.6%) | 8 (28.6%) |
| $1,000 to $1,499 | 62 (48.8%) | 5 (17.9%) |
| $1,500 to $1,999 | 3 (2.4%) | 3 (10.7%) |
| $2,000 to $2,499 | 14 (11.0%) | 0 (0.0%) |
| $2,500 to $2,999 | 0 (0.0%) | 0 (0.0%) |
| $3,000 or more | 3 (2.4%) | 0 (0.0%) |
| Total | 127 (100.0%) | 28 (100.0%) |
Physical Housing Characteristics in Linwood
Housing Structures in Linwood
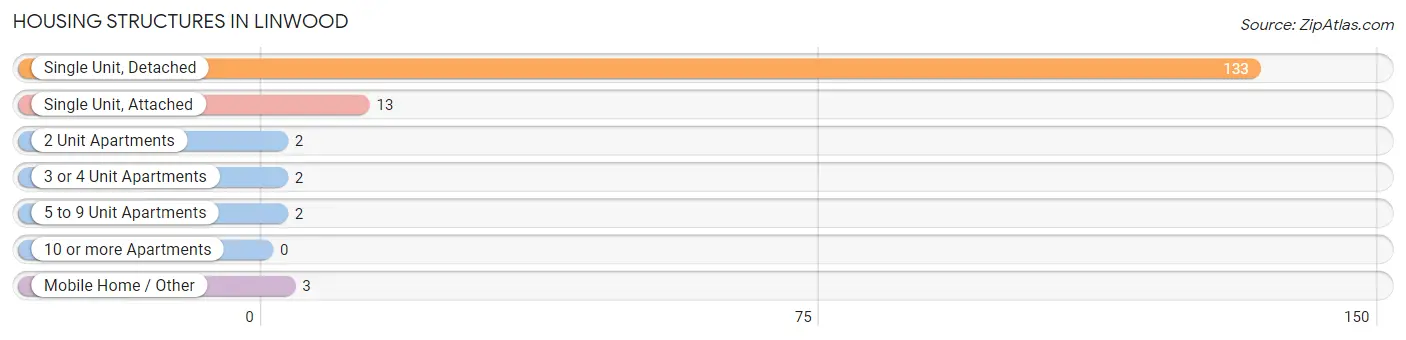
| Structure Type | # Housing Units | % Housing Units |
| Single Unit, Detached | 133 | 85.8% |
| Single Unit, Attached | 13 | 8.4% |
| 2 Unit Apartments | 2 | 1.3% |
| 3 or 4 Unit Apartments | 2 | 1.3% |
| 5 to 9 Unit Apartments | 2 | 1.3% |
| 10 or more Apartments | 0 | 0.0% |
| Mobile Home / Other | 3 | 1.9% |
| Total | 155 | 100.0% |
Housing Structures by Occupancy in Linwood
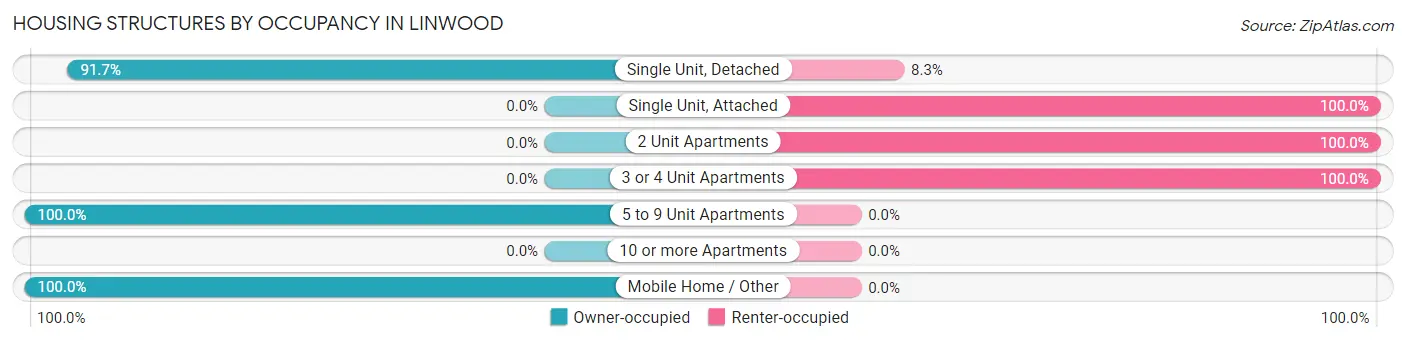
| Structure Type | Owner-occupied | Renter-occupied |
| Single Unit, Detached | 122 (91.7%) | 11 (8.3%) |
| Single Unit, Attached | 0 (0.0%) | 13 (100.0%) |
| 2 Unit Apartments | 0 (0.0%) | 2 (100.0%) |
| 3 or 4 Unit Apartments | 0 (0.0%) | 2 (100.0%) |
| 5 to 9 Unit Apartments | 2 (100.0%) | 0 (0.0%) |
| 10 or more Apartments | 0 (0.0%) | 0 (0.0%) |
| Mobile Home / Other | 3 (100.0%) | 0 (0.0%) |
| Total | 127 (81.9%) | 28 (18.1%) |
Housing Structures by Number of Rooms in Linwood
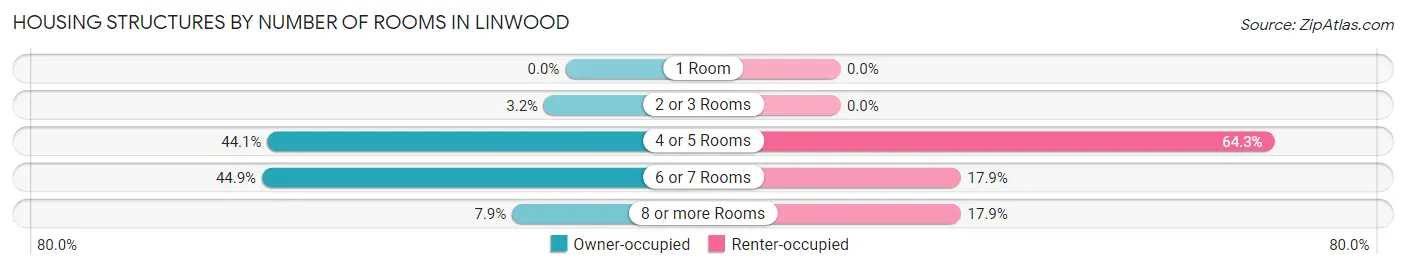
| Number of Rooms | Owner-occupied | Renter-occupied |
| 1 Room | 0 (0.0%) | 0 (0.0%) |
| 2 or 3 Rooms | 4 (3.2%) | 0 (0.0%) |
| 4 or 5 Rooms | 56 (44.1%) | 18 (64.3%) |
| 6 or 7 Rooms | 57 (44.9%) | 5 (17.9%) |
| 8 or more Rooms | 10 (7.9%) | 5 (17.9%) |
| Total | 127 (100.0%) | 28 (100.0%) |
Housing Structure by Heating Type in Linwood
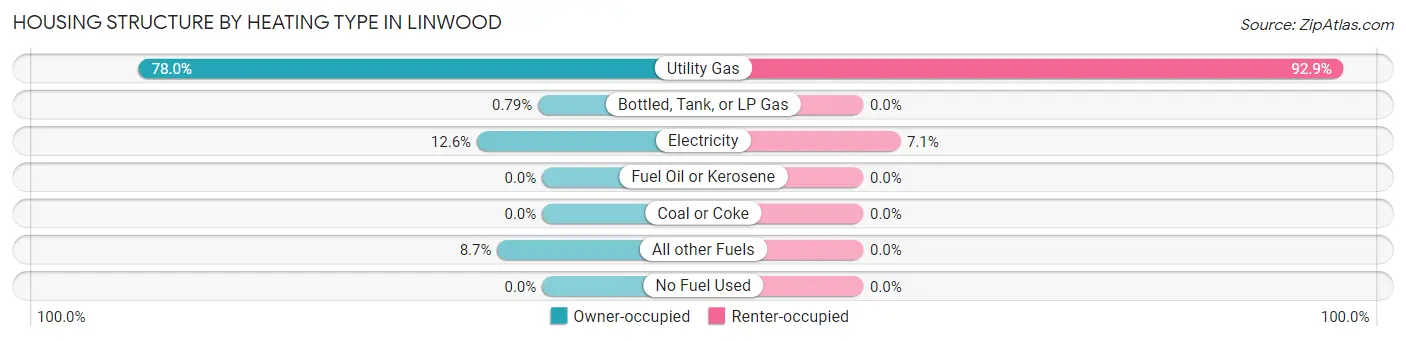
| Heating Type | Owner-occupied | Renter-occupied |
| Utility Gas | 99 (77.9%) | 26 (92.9%) |
| Bottled, Tank, or LP Gas | 1 (0.8%) | 0 (0.0%) |
| Electricity | 16 (12.6%) | 2 (7.1%) |
| Fuel Oil or Kerosene | 0 (0.0%) | 0 (0.0%) |
| Coal or Coke | 0 (0.0%) | 0 (0.0%) |
| All other Fuels | 11 (8.7%) | 0 (0.0%) |
| No Fuel Used | 0 (0.0%) | 0 (0.0%) |
| Total | 127 (100.0%) | 28 (100.0%) |
Household Vehicle Usage in Linwood
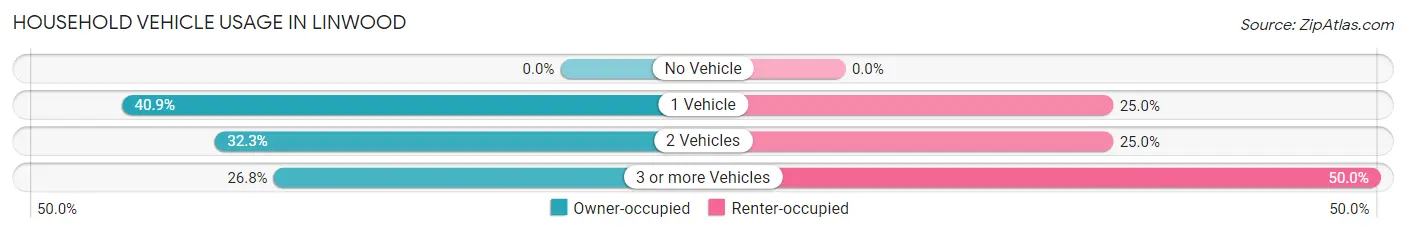
| Vehicles per Household | Owner-occupied | Renter-occupied |
| No Vehicle | 0 (0.0%) | 0 (0.0%) |
| 1 Vehicle | 52 (40.9%) | 7 (25.0%) |
| 2 Vehicles | 41 (32.3%) | 7 (25.0%) |
| 3 or more Vehicles | 34 (26.8%) | 14 (50.0%) |
| Total | 127 (100.0%) | 28 (100.0%) |
Real Estate & Mortgages in Linwood
Real Estate and Mortgage Overview in Linwood
| Characteristic | Without Mortgage | With Mortgage |
| Housing Units | 33 | 94 |
| Median Property Value | $143,800 | $213,400 |
| Median Household Income | $34,107 | $14 |
| Monthly Housing Costs | $488 | $3 |
| Real Estate Taxes | $1,107 | $6 |
Property Value by Mortgage Status in Linwood
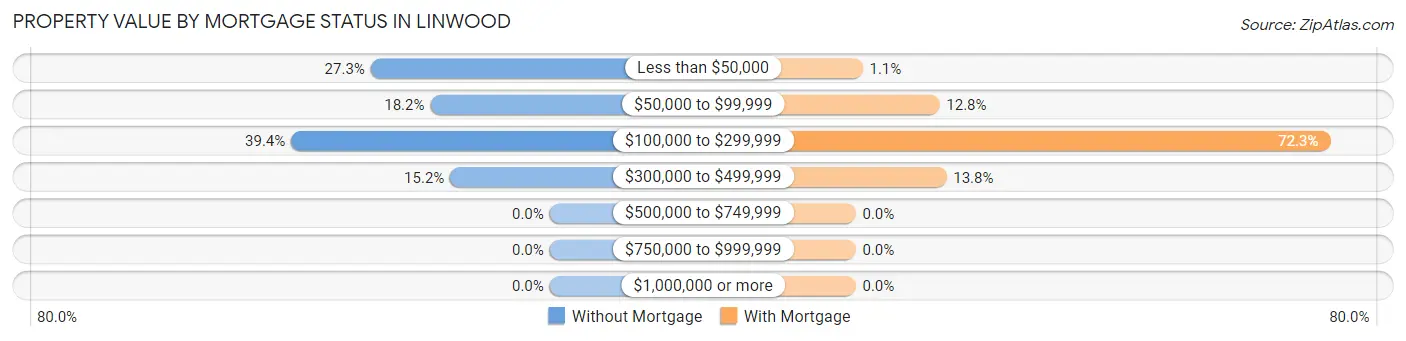
| Property Value | Without Mortgage | With Mortgage |
| Less than $50,000 | 9 (27.3%) | 1 (1.1%) |
| $50,000 to $99,999 | 6 (18.2%) | 12 (12.8%) |
| $100,000 to $299,999 | 13 (39.4%) | 68 (72.3%) |
| $300,000 to $499,999 | 5 (15.1%) | 13 (13.8%) |
| $500,000 to $749,999 | 0 (0.0%) | 0 (0.0%) |
| $750,000 to $999,999 | 0 (0.0%) | 0 (0.0%) |
| $1,000,000 or more | 0 (0.0%) | 0 (0.0%) |
| Total | 33 (100.0%) | 94 (100.0%) |
Household Income by Mortgage Status in Linwood
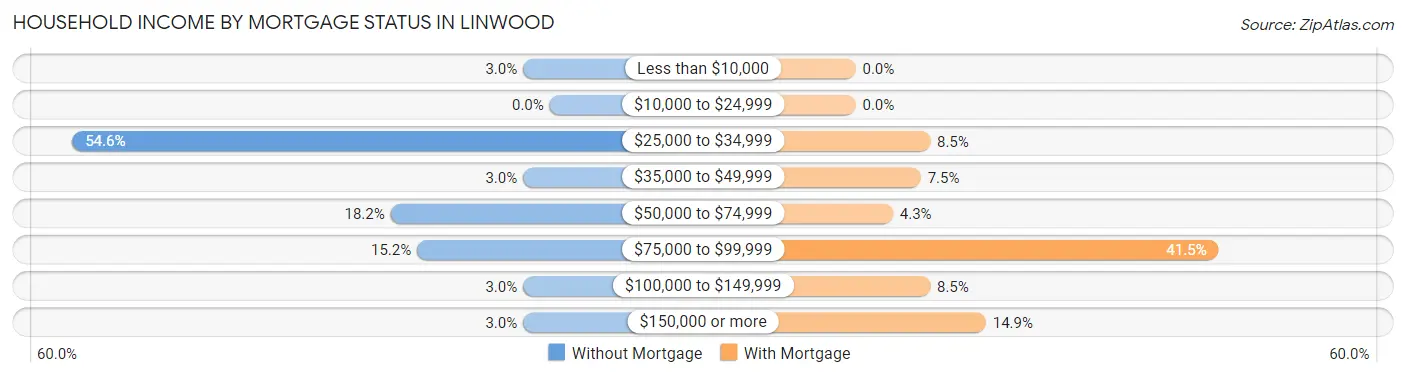
| Household Income | Without Mortgage | With Mortgage |
| Less than $10,000 | 1 (3.0%) | 0 (0.0%) |
| $10,000 to $24,999 | 0 (0.0%) | 0 (0.0%) |
| $25,000 to $34,999 | 18 (54.5%) | 8 (8.5%) |
| $35,000 to $49,999 | 1 (3.0%) | 7 (7.4%) |
| $50,000 to $74,999 | 6 (18.2%) | 4 (4.3%) |
| $75,000 to $99,999 | 5 (15.1%) | 39 (41.5%) |
| $100,000 to $149,999 | 1 (3.0%) | 8 (8.5%) |
| $150,000 or more | 1 (3.0%) | 14 (14.9%) |
| Total | 33 (100.0%) | 94 (100.0%) |
Property Value to Household Income Ratio in Linwood
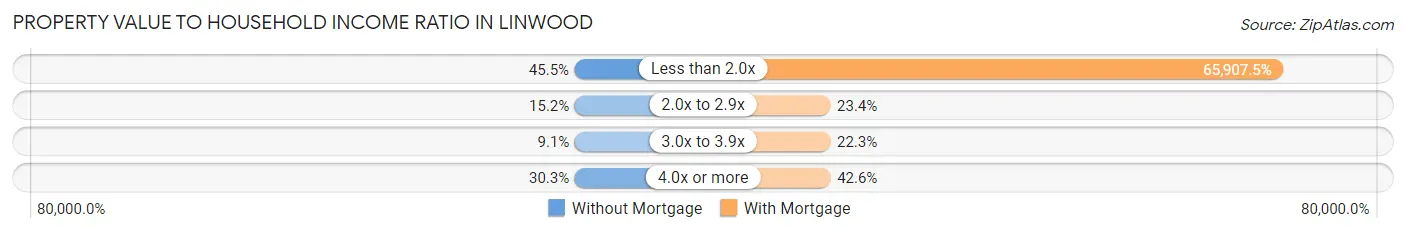
| Value-to-Income Ratio | Without Mortgage | With Mortgage |
| Less than 2.0x | 15 (45.5%) | 61,953 (65,907.4%) |
| 2.0x to 2.9x | 5 (15.1%) | 22 (23.4%) |
| 3.0x to 3.9x | 3 (9.1%) | 21 (22.3%) |
| 4.0x or more | 10 (30.3%) | 40 (42.5%) |
| Total | 33 (100.0%) | 94 (100.0%) |
Real Estate Taxes by Mortgage Status in Linwood
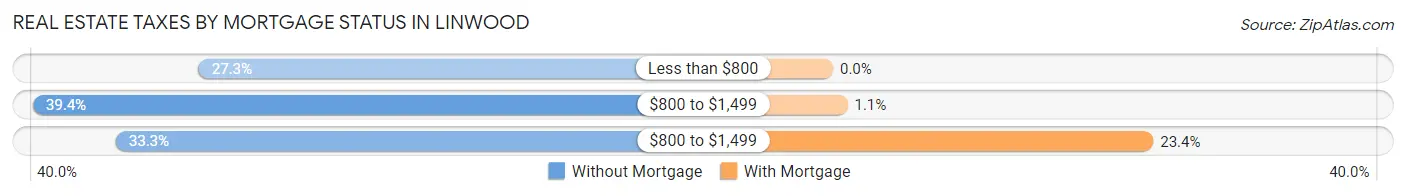
| Property Taxes | Without Mortgage | With Mortgage |
| Less than $800 | 9 (27.3%) | 0 (0.0%) |
| $800 to $1,499 | 13 (39.4%) | 1 (1.1%) |
| $800 to $1,499 | 11 (33.3%) | 22 (23.4%) |
| Total | 33 (100.0%) | 94 (100.0%) |
Health & Disability in Linwood
Health Insurance Coverage by Age in Linwood
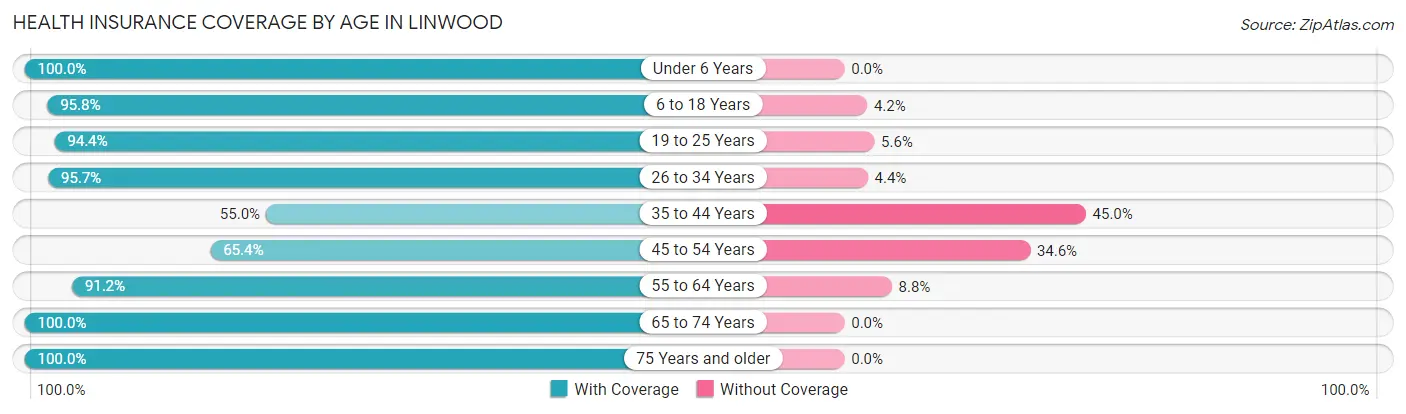
| Age Bracket | With Coverage | Without Coverage |
| Under 6 Years | 34 (100.0%) | 0 (0.0%) |
| 6 to 18 Years | 68 (95.8%) | 3 (4.2%) |
| 19 to 25 Years | 51 (94.4%) | 3 (5.6%) |
| 26 to 34 Years | 44 (95.7%) | 2 (4.3%) |
| 35 to 44 Years | 33 (55.0%) | 27 (45.0%) |
| 45 to 54 Years | 17 (65.4%) | 9 (34.6%) |
| 55 to 64 Years | 31 (91.2%) | 3 (8.8%) |
| 65 to 74 Years | 18 (100.0%) | 0 (0.0%) |
| 75 Years and older | 16 (100.0%) | 0 (0.0%) |
| Total | 312 (86.9%) | 47 (13.1%) |
Health Insurance Coverage by Citizenship Status in Linwood
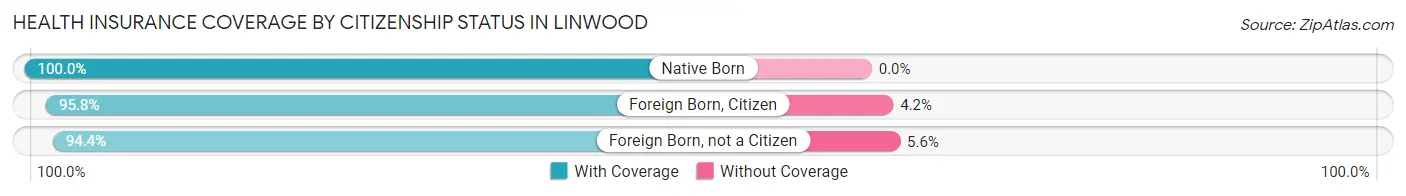
| Citizenship Status | With Coverage | Without Coverage |
| Native Born | 34 (100.0%) | 0 (0.0%) |
| Foreign Born, Citizen | 68 (95.8%) | 3 (4.2%) |
| Foreign Born, not a Citizen | 51 (94.4%) | 3 (5.6%) |
Health Insurance Coverage by Household Income in Linwood
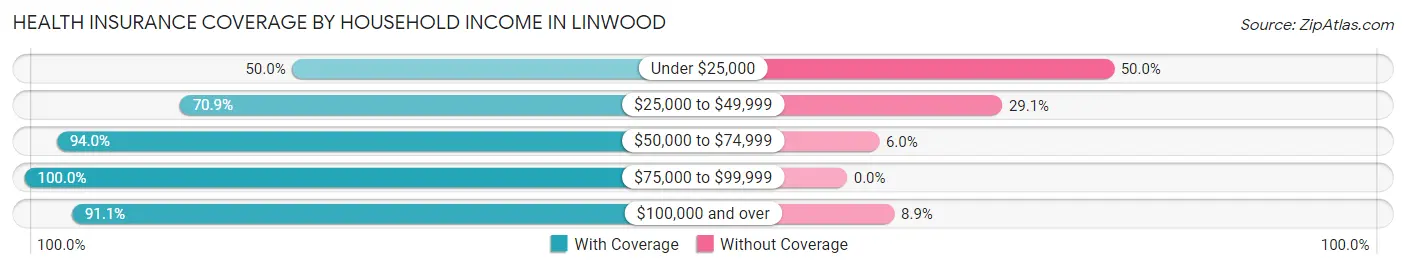
| Household Income | With Coverage | Without Coverage |
| Under $25,000 | 6 (50.0%) | 6 (50.0%) |
| $25,000 to $49,999 | 61 (70.9%) | 25 (29.1%) |
| $50,000 to $74,999 | 78 (94.0%) | 5 (6.0%) |
| $75,000 to $99,999 | 54 (100.0%) | 0 (0.0%) |
| $100,000 and over | 113 (91.1%) | 11 (8.9%) |
Public vs Private Health Insurance Coverage by Age in Linwood
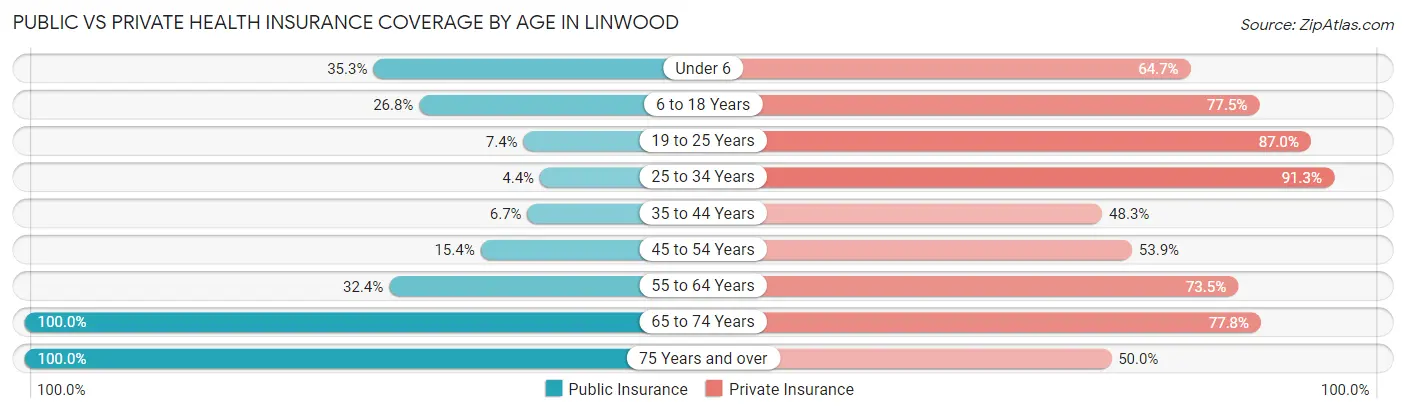
| Age Bracket | Public Insurance | Private Insurance |
| Under 6 | 12 (35.3%) | 22 (64.7%) |
| 6 to 18 Years | 19 (26.8%) | 55 (77.5%) |
| 19 to 25 Years | 4 (7.4%) | 47 (87.0%) |
| 25 to 34 Years | 2 (4.3%) | 42 (91.3%) |
| 35 to 44 Years | 4 (6.7%) | 29 (48.3%) |
| 45 to 54 Years | 4 (15.4%) | 14 (53.8%) |
| 55 to 64 Years | 11 (32.4%) | 25 (73.5%) |
| 65 to 74 Years | 18 (100.0%) | 14 (77.8%) |
| 75 Years and over | 16 (100.0%) | 8 (50.0%) |
| Total | 90 (25.1%) | 256 (71.3%) |
Disability Status by Sex by Age in Linwood
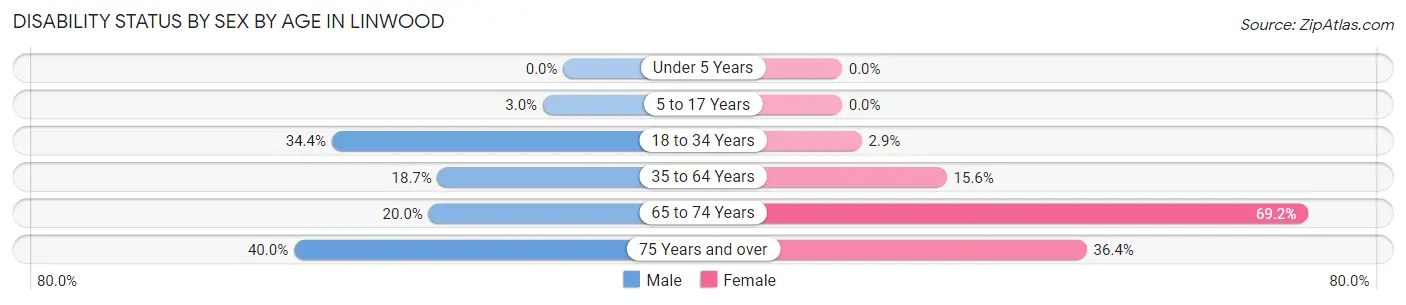
| Age Bracket | Male | Female |
| Under 5 Years | 0 (0.0%) | 0 (0.0%) |
| 5 to 17 Years | 1 (3.0%) | 0 (0.0%) |
| 18 to 34 Years | 11 (34.4%) | 2 (2.9%) |
| 35 to 64 Years | 14 (18.7%) | 7 (15.6%) |
| 65 to 74 Years | 1 (20.0%) | 9 (69.2%) |
| 75 Years and over | 2 (40.0%) | 4 (36.4%) |
Disability Class by Sex by Age in Linwood
Disability Class: Hearing Difficulty
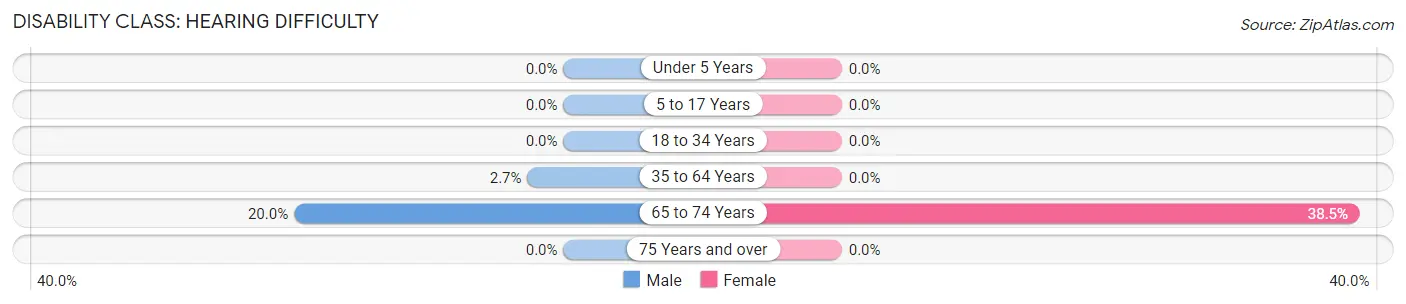
| Age Bracket | Male | Female |
| Under 5 Years | 0 (0.0%) | 0 (0.0%) |
| 5 to 17 Years | 0 (0.0%) | 0 (0.0%) |
| 18 to 34 Years | 0 (0.0%) | 0 (0.0%) |
| 35 to 64 Years | 2 (2.7%) | 0 (0.0%) |
| 65 to 74 Years | 1 (20.0%) | 5 (38.5%) |
| 75 Years and over | 0 (0.0%) | 0 (0.0%) |
Disability Class: Vision Difficulty
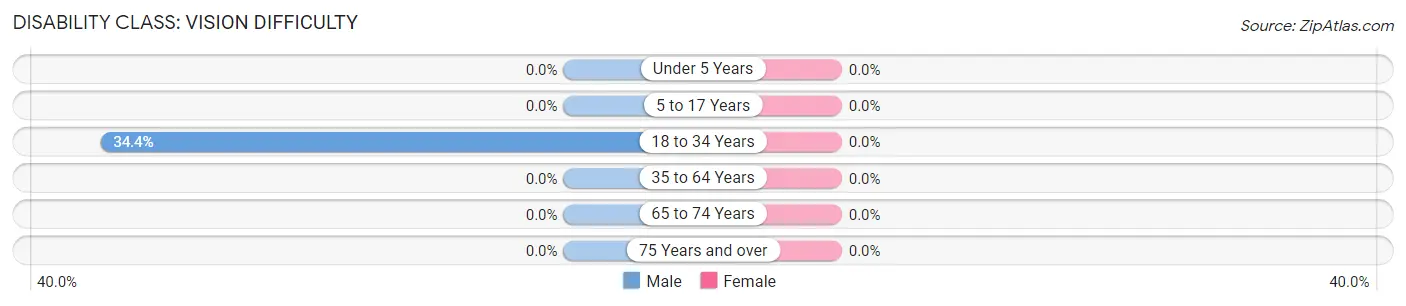
| Age Bracket | Male | Female |
| Under 5 Years | 0 (0.0%) | 0 (0.0%) |
| 5 to 17 Years | 0 (0.0%) | 0 (0.0%) |
| 18 to 34 Years | 11 (34.4%) | 0 (0.0%) |
| 35 to 64 Years | 0 (0.0%) | 0 (0.0%) |
| 65 to 74 Years | 0 (0.0%) | 0 (0.0%) |
| 75 Years and over | 0 (0.0%) | 0 (0.0%) |
Disability Class: Cognitive Difficulty
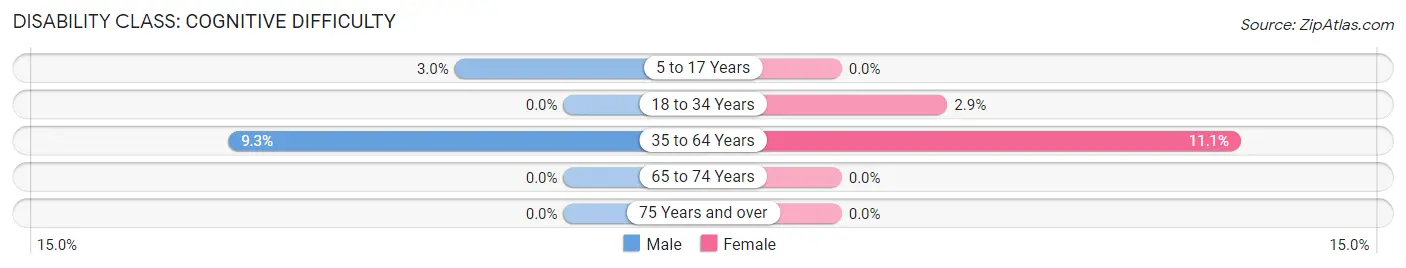
| Age Bracket | Male | Female |
| 5 to 17 Years | 1 (3.0%) | 0 (0.0%) |
| 18 to 34 Years | 0 (0.0%) | 2 (2.9%) |
| 35 to 64 Years | 7 (9.3%) | 5 (11.1%) |
| 65 to 74 Years | 0 (0.0%) | 0 (0.0%) |
| 75 Years and over | 0 (0.0%) | 0 (0.0%) |
Disability Class: Ambulatory Difficulty
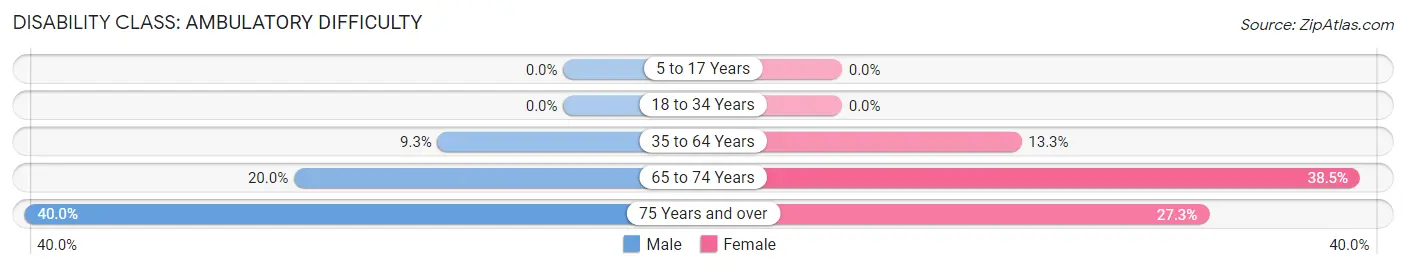
| Age Bracket | Male | Female |
| 5 to 17 Years | 0 (0.0%) | 0 (0.0%) |
| 18 to 34 Years | 0 (0.0%) | 0 (0.0%) |
| 35 to 64 Years | 7 (9.3%) | 6 (13.3%) |
| 65 to 74 Years | 1 (20.0%) | 5 (38.5%) |
| 75 Years and over | 2 (40.0%) | 3 (27.3%) |
Disability Class: Self-Care Difficulty
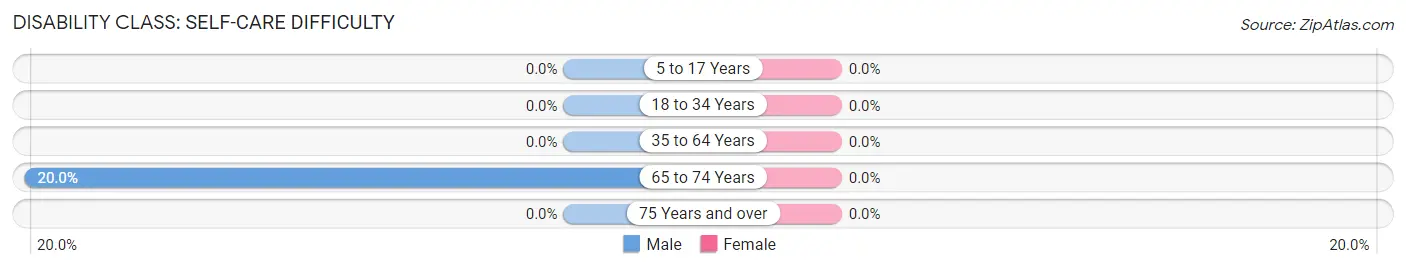
| Age Bracket | Male | Female |
| 5 to 17 Years | 0 (0.0%) | 0 (0.0%) |
| 18 to 34 Years | 0 (0.0%) | 0 (0.0%) |
| 35 to 64 Years | 0 (0.0%) | 0 (0.0%) |
| 65 to 74 Years | 1 (20.0%) | 0 (0.0%) |
| 75 Years and over | 0 (0.0%) | 0 (0.0%) |
Technology Access in Linwood
Computing Device Access in Linwood
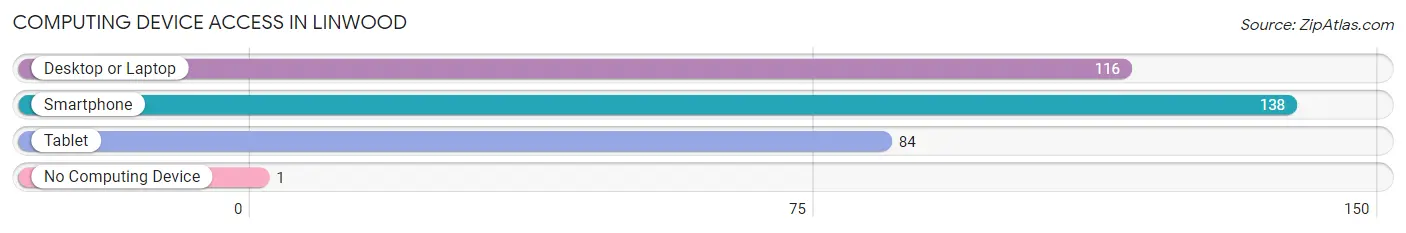
| Device Type | # Households | % Households |
| Desktop or Laptop | 116 | 74.8% |
| Smartphone | 138 | 89.0% |
| Tablet | 84 | 54.2% |
| No Computing Device | 1 | 0.6% |
| Total | 155 | 100.0% |
Internet Access in Linwood
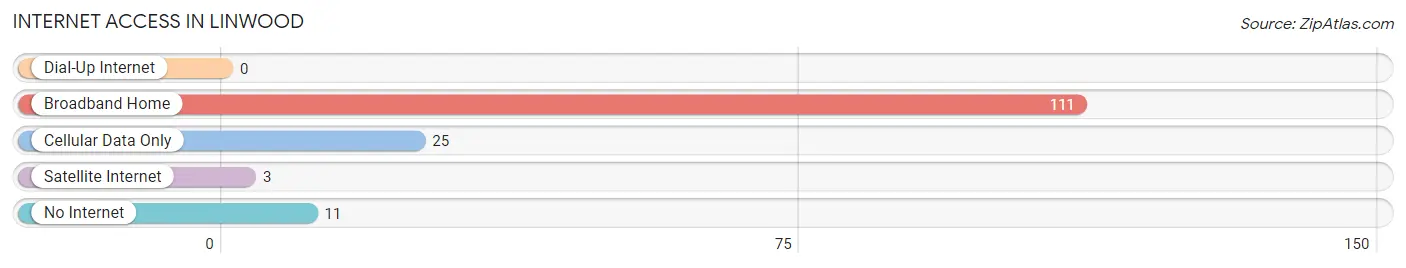
| Internet Type | # Households | % Households |
| Dial-Up Internet | 0 | 0.0% |
| Broadband Home | 111 | 71.6% |
| Cellular Data Only | 25 | 16.1% |
| Satellite Internet | 3 | 1.9% |
| No Internet | 11 | 7.1% |
| Total | 155 | 100.0% |
Linwood Summary
History
The city of Linwood, Kansas is located in Leavenworth County, approximately 20 miles northwest of Kansas City. It was founded in 1858 by a group of settlers from Ohio, who named the town after their hometown of Linwood, Ohio. The town was originally a farming community, but in the late 19th century, it became a popular stop on the Santa Fe Trail. The town was also home to a number of businesses, including a flour mill, a sawmill, a blacksmith shop, and a general store.
In the early 20th century, Linwood experienced a period of growth and prosperity. The town was home to a number of businesses, including a bank, a hotel, a movie theater, and a variety of stores. The town also had a number of churches, including the First Baptist Church, which was founded in 1871.
In the 1950s, the town began to decline as the railroad industry declined and the population shifted to larger cities. The town was also affected by the Great Depression and World War II. In the late 20th century, the town experienced a resurgence as a bedroom community for Kansas City.
Geography
Linwood is located in Leavenworth County, Kansas, approximately 20 miles northwest of Kansas City. The town is situated on the banks of the Missouri River, and is surrounded by rolling hills and farmland. The town is located in the Central Lowland region of the United States, and has a humid continental climate. The average temperature in the summer is around 80 degrees Fahrenheit, and in the winter it is around 40 degrees Fahrenheit.
Economy
The economy of Linwood is largely based on agriculture and tourism. The town is home to a number of farms, which produce a variety of crops, including corn, soybeans, wheat, and hay. The town is also home to a number of businesses, including a bank, a hotel, a movie theater, and a variety of stores. The town is also home to a number of churches, including the First Baptist Church, which was founded in 1871.
The town is also home to a number of tourist attractions, including the Santa Fe Trail, which runs through the town, and the Linwood Historical Museum, which is located in the old Linwood Bank building. The town is also home to a number of parks, including the Linwood Park, which features a playground, picnic areas, and a walking trail.
Demographics
As of the 2010 census, the population of Linwood was 1,845. The racial makeup of the town was 94.3% White, 1.2% African American, 0.3% Native American, 0.7% Asian, 0.1% Pacific Islander, 1.2% from other races, and 2.3% from two or more races. Hispanic or Latino of any race were 3.2% of the population.
The median income for a household in the town was $45,938, and the median income for a family was $51,250. The per capita income for the town was $20,945. About 8.2% of families and 10.2% of the population were below the poverty line, including 14.2% of those under age 18 and 6.2% of those age 65 or over.
Common Questions
What is Per Capita Income in Linwood?
Per Capita income in Linwood is $33,769.
What is the Median Family Income in Linwood?
Median Family Income in Linwood is $63,250.
What is the Median Household income in Linwood?
Median Household Income in Linwood is $61,211.
What is Income or Wage Gap in Linwood?
Income or Wage Gap in Linwood is 15.7%.
Women in Linwood earn 84.3 cents for every dollar earned by a man.
What is Inequality or Gini Index in Linwood?
Inequality or Gini Index in Linwood is 0.39.
What is the Total Population of Linwood?
Total Population of Linwood is 361.
What is the Total Male Population of Linwood?
Total Male Population of Linwood is 165.
What is the Total Female Population of Linwood?
Total Female Population of Linwood is 196.
What is the Ratio of Males per 100 Females in Linwood?
There are 84.18 Males per 100 Females in Linwood.
What is the Ratio of Females per 100 Males in Linwood?
There are 118.79 Females per 100 Males in Linwood.
What is the Median Population Age in Linwood?
Median Population Age in Linwood is 29.2 Years.
What is the Average Family Size in Linwood
Average Family Size in Linwood is 2.7 People.
What is the Average Household Size in Linwood
Average Household Size in Linwood is 2.3 People.
How Large is the Labor Force in Linwood?
There are 211 People in the Labor Forcein in Linwood.
What is the Percentage of People in the Labor Force in Linwood?
76.4% of People are in the Labor Force in Linwood.
What is the Unemployment Rate in Linwood?
Unemployment Rate in Linwood is 5.3%.