Zip Codes with the Highest Percentage of Renter-Occupied Units in Hutchinson, KS
RELATED REPORTS & OPTIONS
Highest Renter-Occupied
Hutchinson
Compare Zip Codes
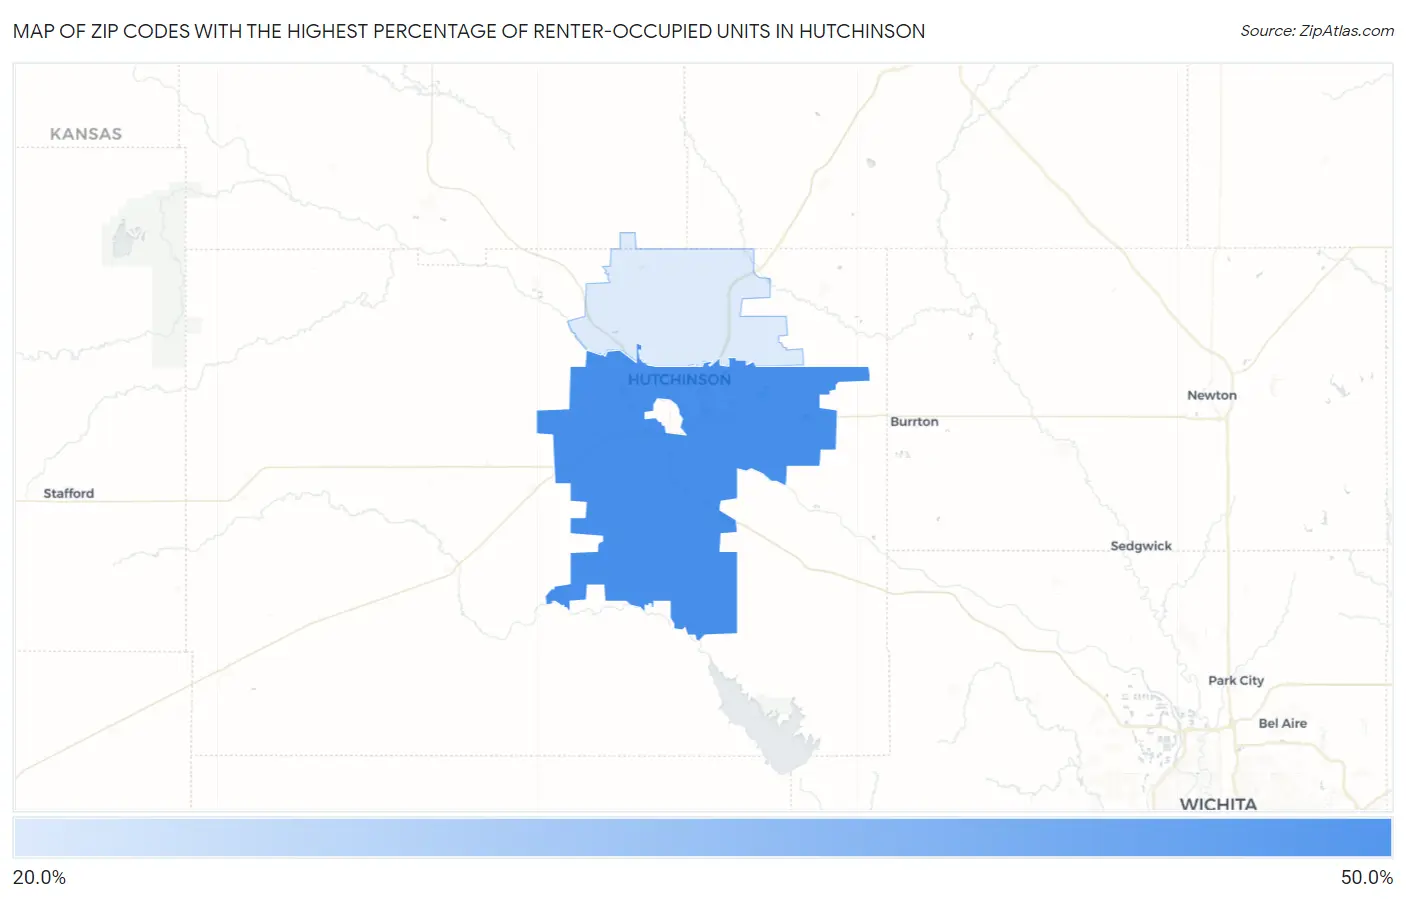
Map of Zip Codes with the Highest Percentage of Renter-Occupied Units in Hutchinson
24.5%
40.1%
Zip Codes with the Highest Percentage of Renter-Occupied Units in Hutchinson, KS
| Zip Code | % Renter-Occupied | vs State | vs National | |
| 1. | 67501 | 40.1% | 33.1%(+6.91)#63 | 35.2%(+4.87)#5,389 |
| 2. | 67502 | 24.5% | 33.1%(-8.66)#254 | 35.2%(-10.7)#14,078 |
1
Common Questions
What are the Top Zip Codes with the Highest Percentage of Renter-Occupied Units in Hutchinson, KS?
Top Zip Codes with the Highest Percentage of Renter-Occupied Units in Hutchinson, KS are:
What zip code has the Highest Percentage of Renter-Occupied Units in Hutchinson, KS?
67501 has the Highest Percentage of Renter-Occupied Units in Hutchinson, KS with 40.1%.
What is the Percentage of Renter-Occupied Units in Hutchinson, KS?
Percentage of Renter-Occupied Units in Hutchinson is 36.2%.
What is the Percentage of Renter-Occupied Units in Kansas?
Percentage of Renter-Occupied Units in Kansas is 33.1%.
What is the Percentage of Renter-Occupied Units in the United States?
Percentage of Renter-Occupied Units in the United States is 35.2%.