Zip Codes with the Most Immigrants from South Eastern Asia in Hutchinson, KS
RELATED REPORTS & OPTIONS
South Eastern Asia
Hutchinson
Compare Zip Codes
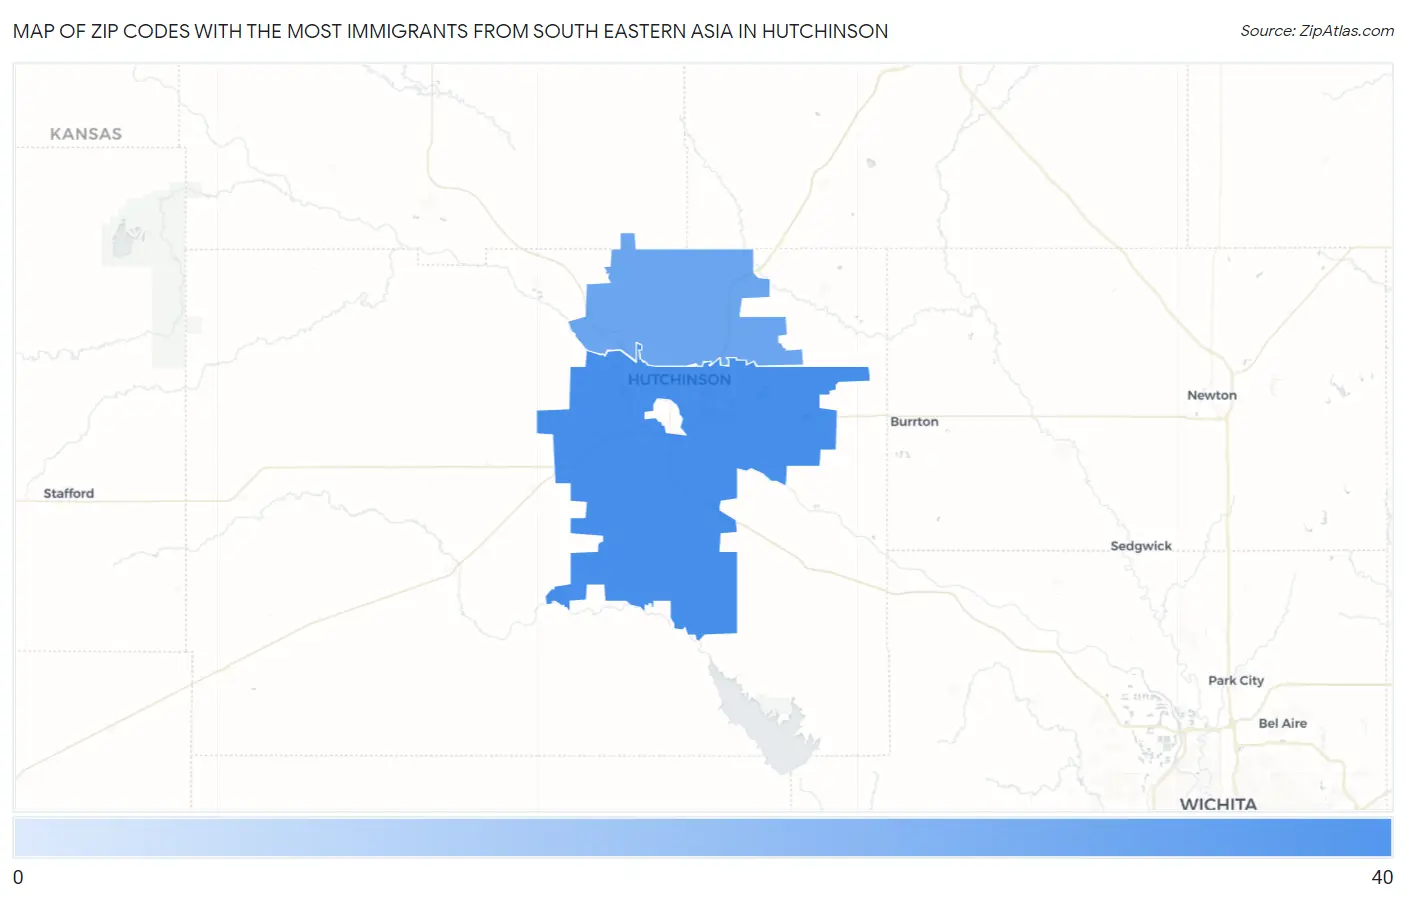
Map of Zip Codes with the Most Immigrants from South Eastern Asia in Hutchinson
15
40
Zip Codes with the Most Immigrants from South Eastern Asia in Hutchinson, KS
| Zip Code | South Eastern Asia | vs State | vs National | |
| 1. | 67501 | 40 | 26,393(0.15%)#88 | 4,292,058(0.00%)#8,392 |
| 2. | 67502 | 15 | 26,393(0.06%)#126 | 4,292,058(0.00%)#10,941 |
1
Common Questions
What are the Top Zip Codes with the Most Immigrants from South Eastern Asia in Hutchinson, KS?
Top Zip Codes with the Most Immigrants from South Eastern Asia in Hutchinson, KS are:
What zip code has the Most Immigrants from South Eastern Asia in Hutchinson, KS?
67501 has the Most Immigrants from South Eastern Asia in Hutchinson, KS with 40.
What is the Total Immigrants from South Eastern Asia in Hutchinson, KS?
Total Immigrants from South Eastern Asia in Hutchinson is 35.
What is the Total Immigrants from South Eastern Asia in Kansas?
Total Immigrants from South Eastern Asia in Kansas is 26,393.
What is the Total Immigrants from South Eastern Asia in the United States?
Total Immigrants from South Eastern Asia in the United States is 4,292,058.