Zip Codes with the Most Immigrants from South Central Asia in Hutchinson, KS
RELATED REPORTS & OPTIONS
South Central Asia
Hutchinson
Compare Zip Codes
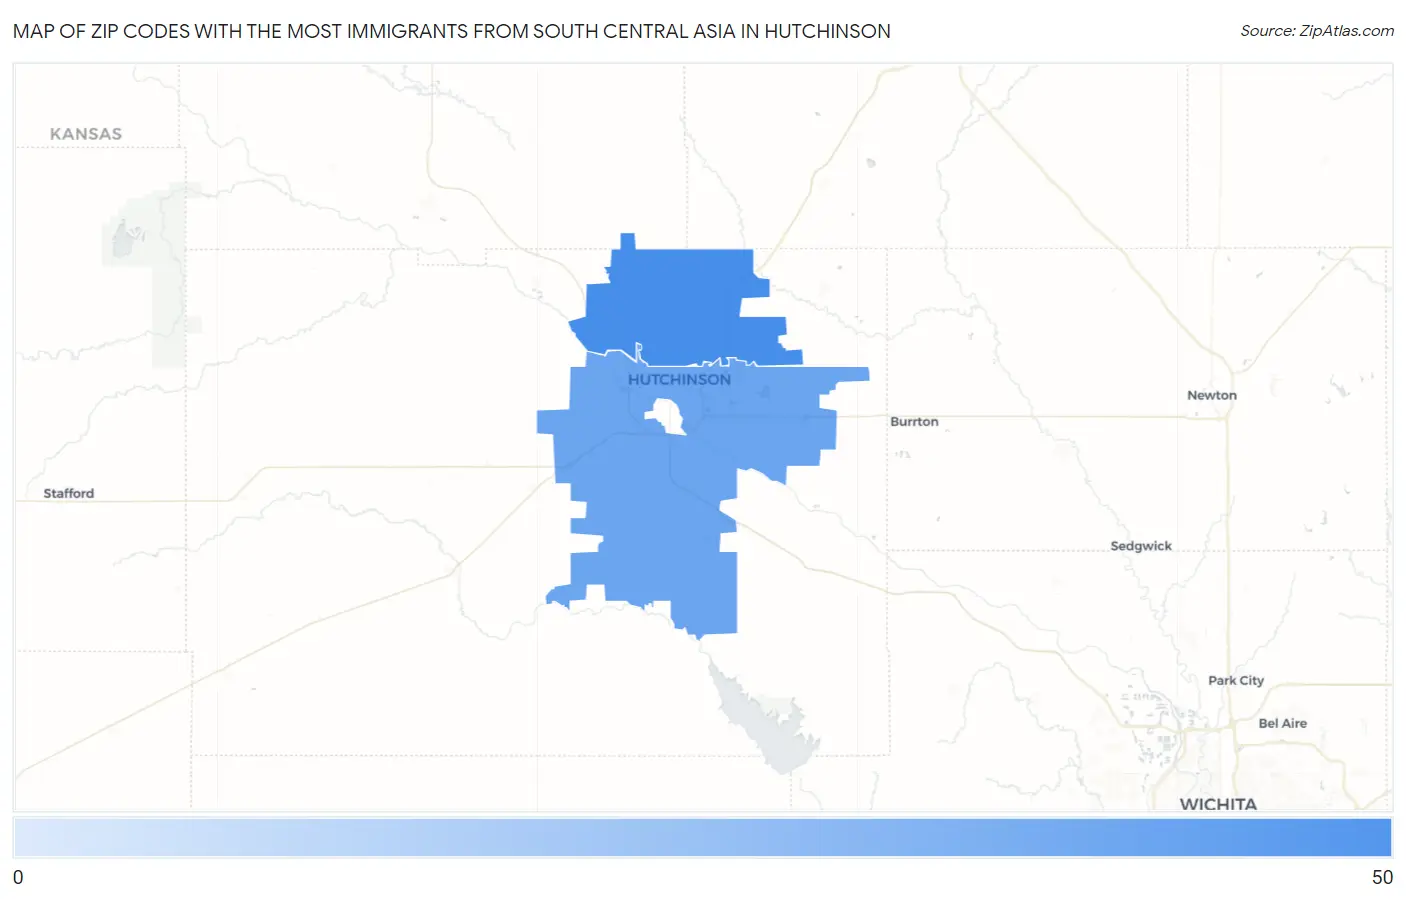
Map of Zip Codes with the Most Immigrants from South Central Asia in Hutchinson
16
42
Zip Codes with the Most Immigrants from South Central Asia in Hutchinson, KS
| Zip Code | South Central Asia | vs State | vs National | |
| 1. | 67502 | 42 | 20,001(0.21%)#60 | 4,330,976(0.00%)#7,135 |
| 2. | 67501 | 16 | 20,001(0.08%)#81 | 4,330,976(0.00%)#8,942 |
1
Common Questions
What are the Top Zip Codes with the Most Immigrants from South Central Asia in Hutchinson, KS?
Top Zip Codes with the Most Immigrants from South Central Asia in Hutchinson, KS are:
What zip code has the Most Immigrants from South Central Asia in Hutchinson, KS?
67502 has the Most Immigrants from South Central Asia in Hutchinson, KS with 42.
What is the Total Immigrants from South Central Asia in Hutchinson, KS?
Total Immigrants from South Central Asia in Hutchinson is 44.
What is the Total Immigrants from South Central Asia in Kansas?
Total Immigrants from South Central Asia in Kansas is 20,001.
What is the Total Immigrants from South Central Asia in the United States?
Total Immigrants from South Central Asia in the United States is 4,330,976.