Zip Codes with the Highest Percentage of Population Employed in Agriculture, Fishing & Hunting in Marion, IN
RELATED REPORTS & OPTIONS
Agriculture, Fishing & Hunting
Marion
Compare Zip Codes
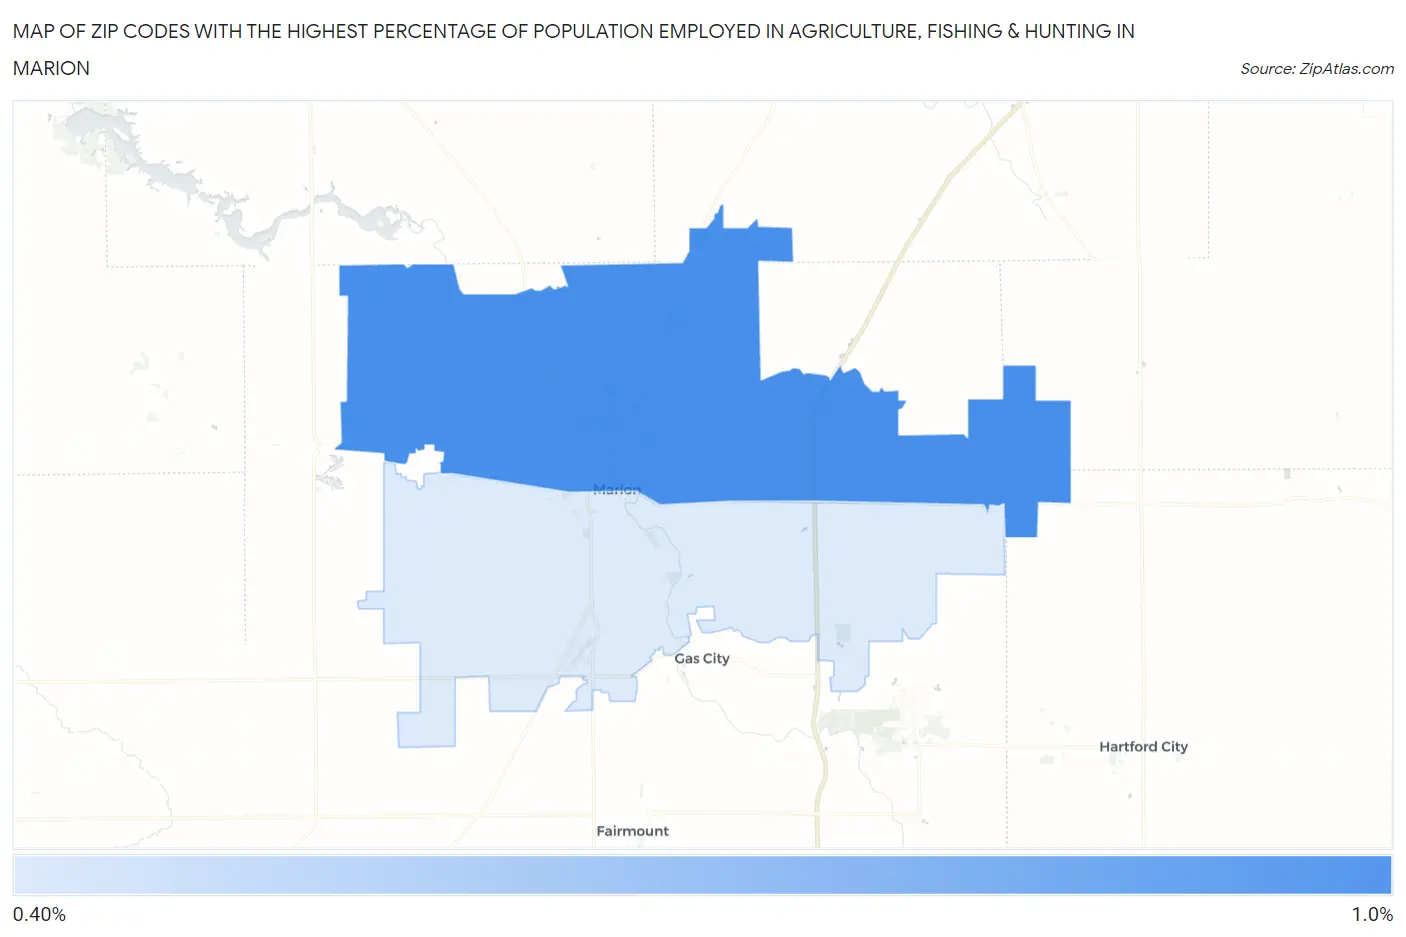
Map of Zip Codes with the Highest Percentage of Population Employed in Agriculture, Fishing & Hunting in Marion
0.0%
1.0%
Zip Codes with the Highest Percentage of Population Employed in Agriculture, Fishing & Hunting in Marion, IN
| Zip Code | % Employed | vs State | vs National | |
| 1. | 46952 | 0.89% | 1.1%(-0.172)#403 | 1.2%(-0.314)#16,787 |
| 2. | 46953 | 0.47% | 1.1%(-0.592)#476 | 1.2%(-0.734)#19,574 |
1
Common Questions
What are the Top Zip Codes with the Highest Percentage of Population Employed in Agriculture, Fishing & Hunting in Marion, IN?
Top Zip Codes with the Highest Percentage of Population Employed in Agriculture, Fishing & Hunting in Marion, IN are:
What zip code has the Highest Percentage of Population Employed in Agriculture, Fishing & Hunting in Marion, IN?
46952 has the Highest Percentage of Population Employed in Agriculture, Fishing & Hunting in Marion, IN with 0.89%.
What is the Percentage of Population Employed in Agriculture, Fishing & Hunting in Indiana?
Percentage of Population Employed in Agriculture, Fishing & Hunting in Indiana is 1.1%.
What is the Percentage of Population Employed in Agriculture, Fishing & Hunting in the United States?
Percentage of Population Employed in Agriculture, Fishing & Hunting in the United States is 1.2%.