Zip Codes with the Highest Percentage of Population Employed in Sales & Related in Greenwood, IN
RELATED REPORTS & OPTIONS
Sales & Related
Greenwood
Compare Zip Codes
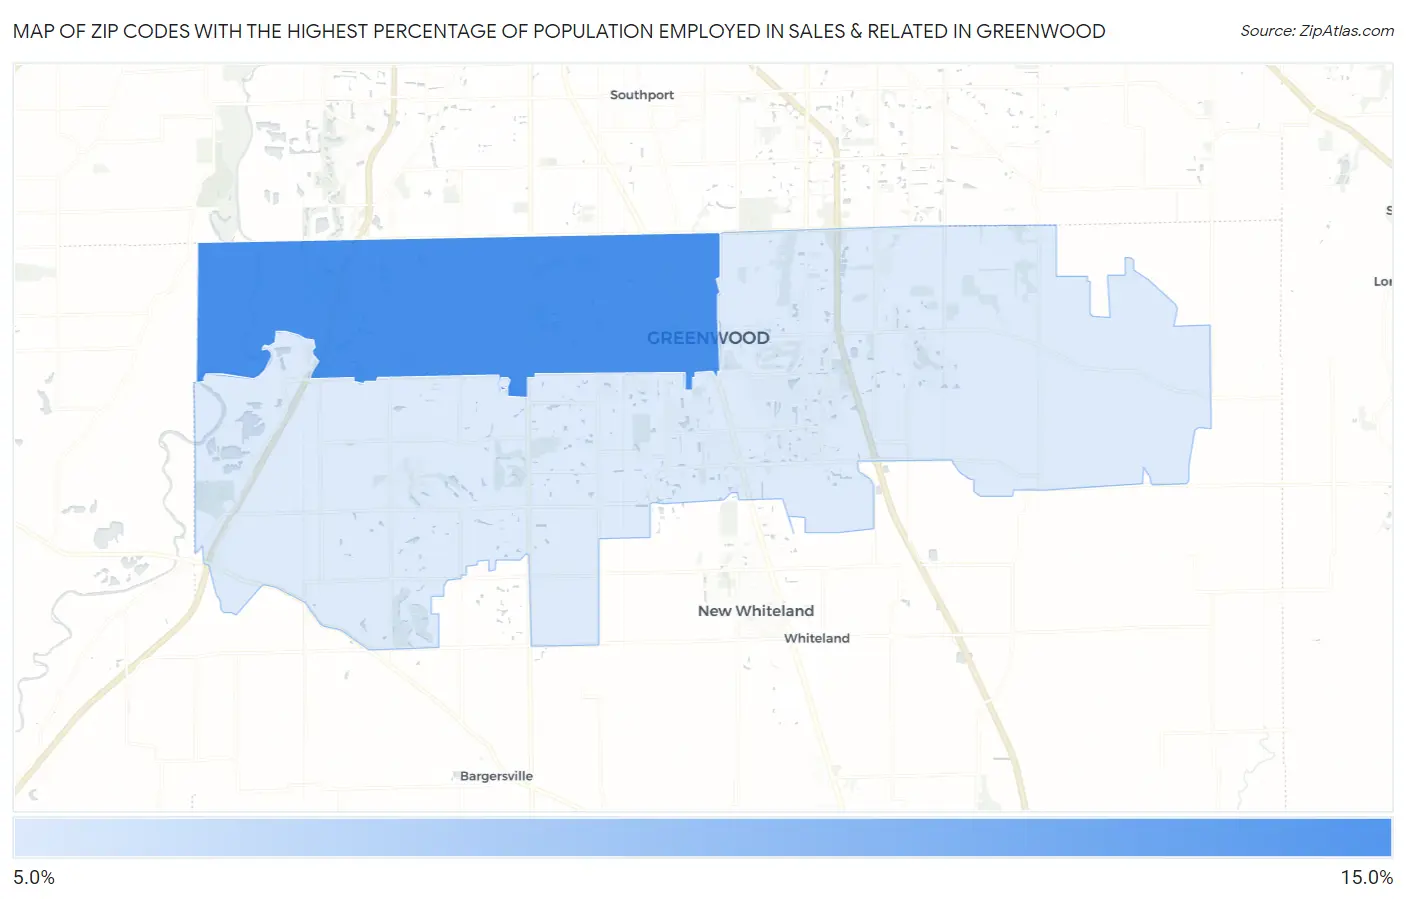
Map of Zip Codes with the Highest Percentage of Population Employed in Sales & Related in Greenwood
0.0%
15.0%
Zip Codes with the Highest Percentage of Population Employed in Sales & Related in Greenwood, IN
| Zip Code | % Employed | vs State | vs National | |
| 1. | 46142 | 10.8% | 8.8%(+1.99)#159 | 9.6%(+1.24)#8,619 |
| 2. | 46143 | 9.8% | 8.8%(+0.995)#216 | 9.6%(+0.240)#11,526 |
1
Common Questions
What are the Top Zip Codes with the Highest Percentage of Population Employed in Sales & Related in Greenwood, IN?
Top Zip Codes with the Highest Percentage of Population Employed in Sales & Related in Greenwood, IN are:
What zip code has the Highest Percentage of Population Employed in Sales & Related in Greenwood, IN?
46142 has the Highest Percentage of Population Employed in Sales & Related in Greenwood, IN with 10.8%.
What is the Percentage of Population Employed in Sales & Related in Greenwood, IN?
Percentage of Population Employed in Sales & Related in Greenwood is 9.5%.
What is the Percentage of Population Employed in Sales & Related in Indiana?
Percentage of Population Employed in Sales & Related in Indiana is 8.8%.
What is the Percentage of Population Employed in Sales & Related in the United States?
Percentage of Population Employed in Sales & Related in the United States is 9.6%.