Zip Codes with the Highest Percentage of Population Employed in Arts, Entertainment & Recreation in Champaign, IL
RELATED REPORTS & OPTIONS
Arts, Entertainment & Recreation
Champaign
Compare Zip Codes
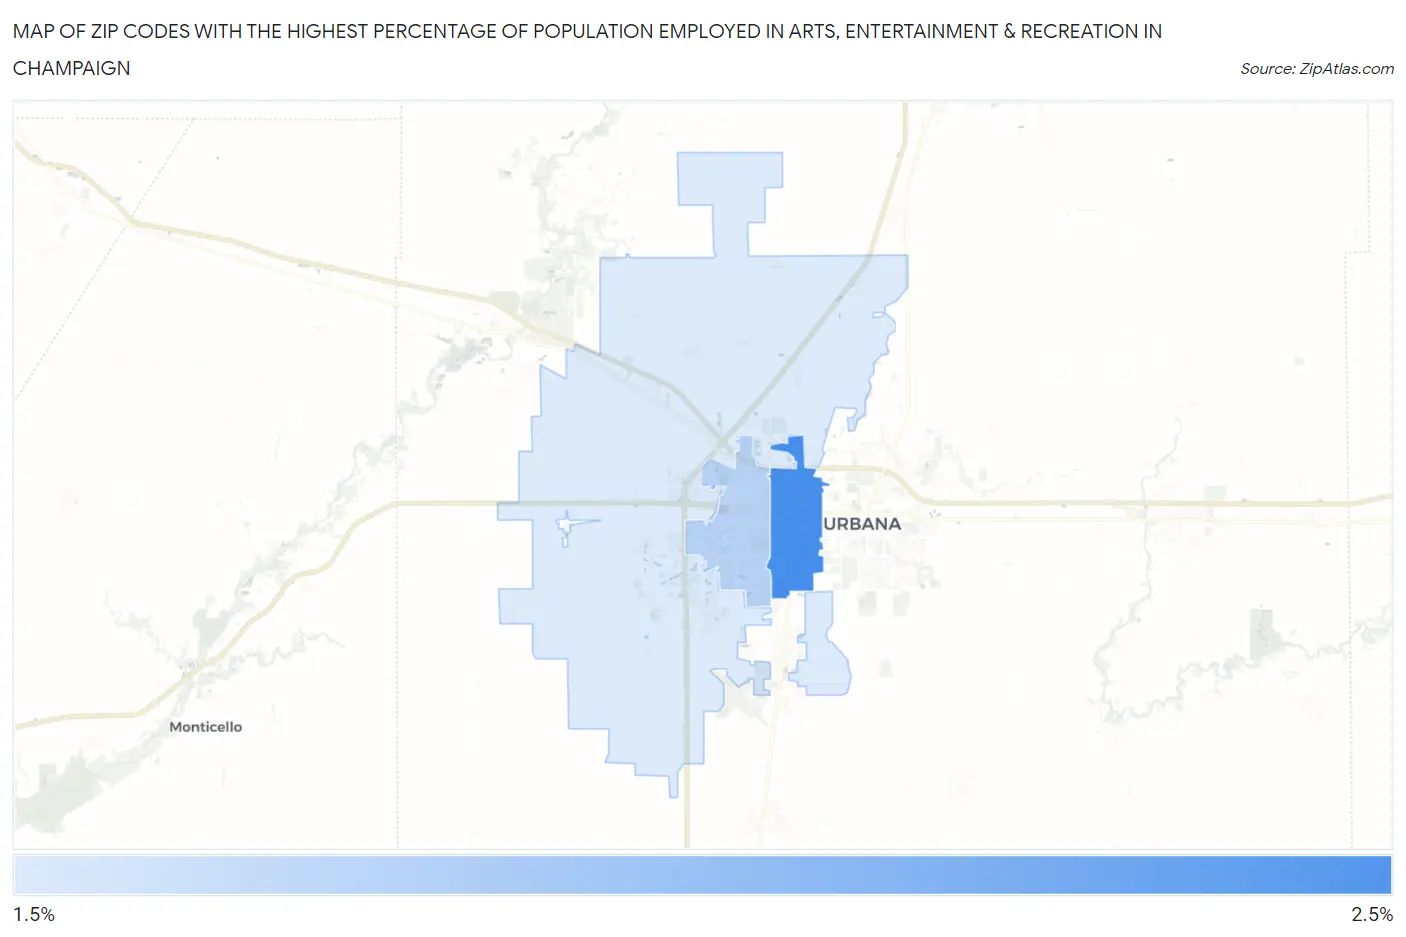
Map of Zip Codes with the Highest Percentage of Population Employed in Arts, Entertainment & Recreation in Champaign
0.0%
2.5%
Zip Codes with the Highest Percentage of Population Employed in Arts, Entertainment & Recreation in Champaign, IL
| Zip Code | % Employed | vs State | vs National | |
| 1. | 61820 | 2.4% | 1.9%(+0.470)#234 | 2.1%(+0.322)#7,629 |
| 2. | 61821 | 1.8% | 1.9%(-0.099)#385 | 2.1%(-0.247)#10,785 |
| 3. | 61822 | 1.6% | 1.9%(-0.287)#445 | 2.1%(-0.435)#12,104 |
1
Common Questions
What are the Top Zip Codes with the Highest Percentage of Population Employed in Arts, Entertainment & Recreation in Champaign, IL?
Top Zip Codes with the Highest Percentage of Population Employed in Arts, Entertainment & Recreation in Champaign, IL are:
What zip code has the Highest Percentage of Population Employed in Arts, Entertainment & Recreation in Champaign, IL?
61820 has the Highest Percentage of Population Employed in Arts, Entertainment & Recreation in Champaign, IL with 2.4%.
What is the Percentage of Population Employed in Arts, Entertainment & Recreation in Champaign, IL?
Percentage of Population Employed in Arts, Entertainment & Recreation in Champaign is 1.9%.
What is the Percentage of Population Employed in Arts, Entertainment & Recreation in Illinois?
Percentage of Population Employed in Arts, Entertainment & Recreation in Illinois is 1.9%.
What is the Percentage of Population Employed in Arts, Entertainment & Recreation in the United States?
Percentage of Population Employed in Arts, Entertainment & Recreation in the United States is 2.1%.